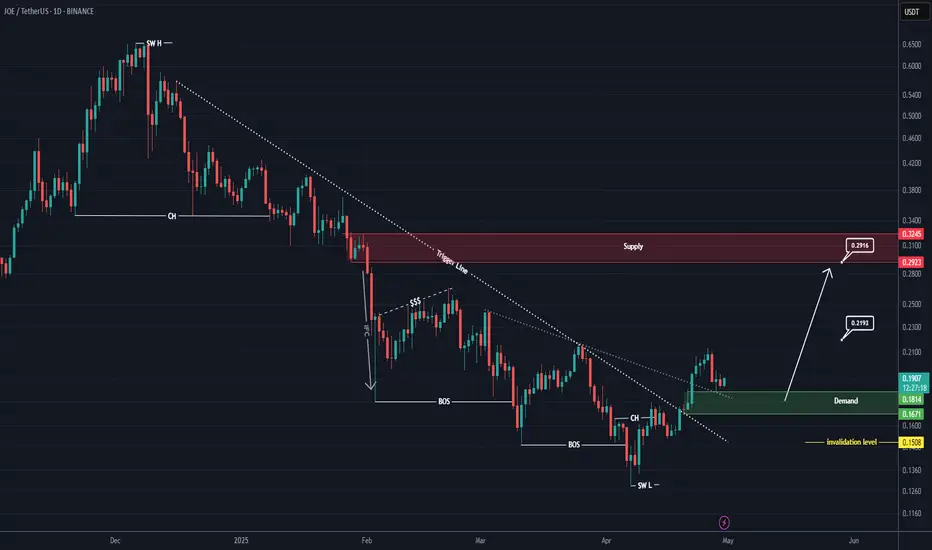
JOE Looks Bullish (1D)A 3D divergence is visible on the chart, indicating that sellers have exited their short positions.
A key trigger line has been broken, and the price has reclaimed critical levels.
We have identified two entry points where we plan to open buy/long positions.
A daily candle closing below the invalidation level will invalidate this analysis
Do not enter the position without capital management and stop setting
Comment if you have any questions
thank you
JOEBTC

JOE Looks Bullish (1D)Two important trigger lines have been broken, and a bullish CH (Change of Character) is also visible on the chart. A key support zone has formed, which is expected to hold.
The correction that occurred has been sufficient in terms of both time and price, and the break of the trigger line indicates that the correction is likely over.
There is also a liquidity pool above the chart that is expected to be swept soon
Targets are marked on the chart.
A daily candle closing below the invalidation level would invalidate this analysis.
For risk management, please don't forget stop loss and capital management
Comment if you have any questions
Thank You
#JOE/USDT#JOE
The price is moving in a descending channel on the 1-hour frame and is expected to continue upwards
We have a trend to stabilize above the moving average 100 again
We have a descending trend on the RSI indicator that supports the rise by breaking it upwards
We have a support area at the lower limit of the channel at a price of 0.2222
Entry price 0.2530
First target 0.2661
Second target 0.2826
Third target 0.3032

#JOE (SPOT) entry range(0.3000 - 0.3830) T.(0.7420) SL(0.2809)BINANCE:JOEUSDT
entry range (0.3000 - 0.3830)
Target1 (0.7420)
1 Extra Targets(optional) in chart, if you like to continue in the trade with making stoploss very high.
SL .1D close below (0.2809)
1:3 Trade
*** collect the coin slowly in the entry range ***
*** this coin is very heavy, it may take long time to achieve the target***
**** #Manta ,#OMNI, #DYM, #AI, #IO, #XAI , #ACE #NFP #RAD #WLD #ORDI #BLUR #SUI #Voxel #AEVO #VITE #APE #RDNT #FLUX #NMR #VANRY #TRB #HBAR #DGB #XEC #ERN #ALT #IO #ACA #HIVE #ASTR #ARDR #PIXEL #LTO #AERGO #SCRT #ATA #HOOK #FLOW #KSM #HFT #MINA #DATA #SC #JOE ****

JOEUSDT Symmetric Traingle!JOEUSDT technical analysis update
JOE price has broken out of the triangle pattern and is now retesting the support line. Once the retest is complete, we can expect a strong bullish move.
And JOE price trading above 100 EMA
Regards
Hexa

JOE ANALYSIS (12H)It seems that on the chart we have a large diametric that the F wave is ending.
The green range is the best and least risky place for buy/long positions.
The targets are marked on the chart.
Closing a daily candle below the invalidation level will violate the analysis.
For risk management, please don't forget stop loss and capital management
Comment if you have any questions
Thank You

JOE still seems bearishFrom where we entered "start" on the chart, it seems that Joe has entered the correction phase.
This correction phase appears to be a diametric pattern.
If it reaches the red range, we expect a downward price rejection.
Now the price is going to complete the F wave.
For risk management, please don't forget stop loss and capital management
When we reach the first target, save some profit and then change the stop to entry
Comment if you have any questions
Thank You

#JOE/USDT#JOE
The price is moving in a 1-hour bearish channel and sticking to it well
The price rebounded well from the lower channel border at the green support level 0.4900
We have a tendency to stabilize above the Moving Average 100
We are oversold on the RSI indicator and we have a downtrend that is expected to break higher to support the rise
Entry price is 0.5000
The first target is 0.5290
The second target is 0.5542
The third target is 0.5800

#JOE/USDT#JOE
The price has been moving in a descending triangle since May 2022
This pattern was broken by breaking the downtrend
Moving average 100 was broken
Supported by oversold on MACD
Current price 0.3800
First target 0.7118
Second target 1.2260
Which represents 400% of the current price
You should pay attention to the correction points on the chart

JOE looks bullishLooks like joe is in wave C of a diametric. Now it seems that wave C of this diametric itself is an abc, which is now at the end of wave b. Actually now we are in wave b of C of this diametric.
It is expected to reject upwards from the green range and the price will enter wave c of C.
Our target is the red box.
Closing a daily candle below the invalidation level will violate the analysis
For risk management, please don't forget stop loss and capital management
Comment if you have any questions
Thank You

JOEUSDT Trend Line Breakout!JOEUSDT Technical Nalaysis Update
JOE/USDT is breaking its trend resistance line. The price is trading above the 100EMA and 200EMA. We are expecting a good up move.
Buy zone : Below $0.418
Stop loss : $0.355
Resistance 1 : $0.474
Resistance 2 : $0.564
Resistance 3 : $0.725
Regards
Hexa

JOE / JOEUSDTGOOD LUCK>>>
• Warning •
Any deal I share does not mean that I am forcing you to enter into it, you enter in with your full risk, because I'll not gain any profits with you in the end.
The risk management of the position must comply with the stop loss.
(I am not sharing financial or investment advice, you should do your own research for your money.)

JOE SHORT SETUPHi, dear traders. how are you ? Today we have a viewpoint to SHORT/SELL the JOE symbol.
For risk management, please don't forget stop loss and capital management
When we reach the first target, save some profit and then change the stop to entry
Comment if you have any questions
Thank You

JOE token formed bullish BAT for upto 129% rallyHi dear friends, hope you are well and welcome to the new trade setup of JOE token with BTC pair.
Previously we caugh more than 90% pump of JOE as below:
Now on a daily time frame, JOE has formed another bullish BAT pattern for the next price reversal.
Note: Above idea is for educational purpose only. It is advised to diversify and strictly follow the stop loss, and don't get stuck with trade

Finally Joe showing Signs Of Life Forming Descending Channel In daily Timeframe Incase Of Breakout Expecting 140 to 150% bullish Move
always wait for confirmed breakout

$JOE/#BTC [#Trader Joe]: Resistance_Breakout_Confirmation◳◱ A Resistance Breakout and Confirmation has been detected on the $JOE / $BTC chart. The price has broken above a key resistance level and has been confirmed by a strong candle, indicating a potential bullish trend. The next resistance key levels are located at 0.00001218 | 0.00001348 | 0.00001556, and the major support zones can be found at 0.0000101 | 0.00000932 | 0.00000724. Consider entering a trade at the current price zone of 0.00001113 and targeting higher levels.
◰◲ General info :
▣ Name: Trader Joe
▣ Rank: 294
▣ Category/Sector: N/A
▣ Overview: Trader Joe is a decentralized trading platform on the Avalanche network that combines DEX services with DeFi lending to offer leveraged Trading. The platform allows users to trade (AMM exchange), participate in yield farming, staking, and borrowing.
◰◲ Technical Metrics :
▣ Mrkt Price: 0.00001113 ₿
▣ 24HVol: 1.533 ₿
▣ 24H Chng: 0.18%
▣ 7-Days Chng: -3.55%
▣ 1-Month Chng: 11.40%
▣ 3-Months Chng: 32.30%
◲◰ Pivot Points - Levels :
◥ Resistance: 0.00001218 | 0.00001348 | 0.00001556
◢ Support: 0.0000101 | 0.00000932 | 0.00000724
◱◳ Indicators recommendation :
▣ Oscillators: NEUTRAL
▣ Moving Averages: STRONG_BUY
◰◲ Technical Indicators Summary : BUY
◲◰ Sharpe Ratios :
▣ Last 30D: 3.41
▣ Last 90D: 2.24
▣ Last 1-Y: -0.29
▣ Last 3-Y: -0.57
◲◰ Volatility :
▣ Last 30D: 1.24
▣ Last 90D: 1.04
▣ Last 1-Y: 1.31
▣ Last 3-Y: 1.37
◳◰ Market Sentiment Index :
▣ News sentiment score is N/A
▣ Twitter sentiment score is N/A
▣ Reddit sentiment score is N/A
▣ In-depth JOEBTC technical analysis on Tradingview TA page
▣ What do you think of this analysis? Share your insights and let's discuss in the comments below. Your like, follow and support would be greatly appreciated!
◲ Disclaimer
Please note that the information and publications provided are for informational purposes only and should not be construed as financial, investment, trading, or any other type of advice or recommendation. We encourage you to conduct your own research and consult with a qualified professional before making any financial decisions. The use of the information provided is solely at your own risk.
▣ Welcome to the home of charting big: TradingView
Benefit from a ton of financial analysis features, instruments and data. Have a look around, and if you do choose to go with an upgraded plan, you'll get up to $30.
Discover it here - affiliate link -

JOE 2H BUYJOE 2H support is at ~$0.24
Enter 50% at the current price
and try to set some buy orders near the support zone
If JOE holds above the trendline,
the Take-Profit target would be 5%, 10%, and 15% from your entry
Cheers
