$JPM Bear Flag at All Time HighNYSE:JPM Bear Flag at All Time High. A bear flag is a technical analysis pattern that typically occurs after a significant downward price movement. It is identified by a rectangular-shaped consolidation, resembling a flag, that slopes against the prevailing trend. The flagpole represents the initial sharp decline, followed by a period of consolidation forming the flag. Traders often interpret the bear flag as a potential continuation pattern, suggesting that the previous downtrend may resume after the consolidation period, leading to further price declines.
Jpmorgan

JPMorgan's 4Q 2023: Navigating Challenges Amidst Resilience
In the intricate dance of finance, JPMorgan's fourth-quarter 2023 results unveil a narrative of resilience, strategic prowess, and a cautious gaze toward potential headwinds. As the behemoth financial institution reported adjusted earnings of $3.97 per share, surpassing expectations, CEO Jamie Dimon's reflections on the U.S. economy's resilience and his cautionary notes create a backdrop for a compelling analysis.
The Triumphs:
JPMorgan's stellar performance was propelled by a trio of factors – higher interest rates, the transformative First Republic Bank deal, and a moderate improvement in the Investment Banking (IB) segment. The adjusted earnings of $3.97 per share handily outpaced the Zacks Consensus Estimate, revealing a financial powerhouse that knows how to navigate challenges.
Strategic Moves:
The strategic landscape unfolded with notable achievements. The First Republic Bank deal and higher interest rates were pivotal in supporting Net Interest Income (NII), projected to hit $90 billion in the coming year. Commercial Banking witnessed a surge in average loan balances, while the IB business exhibited a commendable 13% increase in total fees. JPMorgan's calculated market moves showcased its ability to harness opportunities even in a dynamic environment.
Economic Caution and Global Uncertainties:
However, amidst the triumphs, Jamie Dimon's cautionary remarks echo the realities of the broader economic landscape. Stickier inflation and the geopolitical tensions in Ukraine and the Middle East pose potential threats, emphasizing the need for a vigilant approach. JPMorgan's acknowledgement of these challenges underscores the delicate balance the institution maintains in navigating global uncertainties.
Challenges and Concerns:
The financial tale is not devoid of challenges. Operating expenses witnessed an uptick, with adjusted non-interest expenses expected to hover around $90 billion. Net income, though robust in most segments, declined by 15%, raising eyebrows amid projections of a potential economic slowdown and reduced loan demand.
Financial Metrics Unveiled:
The financial metrics paint a comprehensive picture. Net revenues surged by 12% to $38.57 billion, yet fell short of the Zacks Consensus Estimate. NII witnessed a commendable 19% YoY increase to $24.05 billion, fueled by higher rates and revolving balances in Card Services. Non-interest income grew by a modest 1%, but non-interest expenses surged by 29%, partly due to the FDIC special assessment charge and rising compensation expenses.

USD/JPY Approaches 141.30, Extending Two-Day Decline USD/JPY continues its downward trend for the second consecutive session, trading below the 141.30 level during the Asian hours on Thursday. Improved trade data from Japan in November has exerted pressure on the currency pair. However, less optimistic remarks from Bank of Japan Governor Kazuo Ueda may weigh on the Japanese Yen.
From a technical standpoint, the spot price indicates potential recovery below the 142.00 level and appears to have broken the two-day decline. This suggests that breaking below the 200-day Simple Moving Average (SMA) is crucial support for bearish traders. Furthermore, oscillators on the daily chart remain deeply in negative territory, indicating limited resistance for USD/JPY on the downside. Any subsequent upward movement may still be viewed as a selling opportunity and is likely to be capped around the 142.75 level (200-day SMA). This implies that further buying activity leading to a move beyond the 143.00 level could trigger short-covering actions, allowing the bullish camp to reclaim the 144.00 milestone.
On the flip side, weakness below the Asian session's lowest levels around the 141.90-141.85 region would reaffirm the short-term trend and make USD/JPY susceptible to retesting below the 141.00 level, or the multi-month lows touched last week. Subsequent declines could potentially pull the spot price towards the intermediate support at 140.45 on the way to the psychological level of 140.00.

JP MORGAN Approaching the ideal sell level.JP Morgan Chase (JPM) has been trading within a Channel Up pattern since the October 12 2022 market bottom. Currently it is on a relentless rally since the October 27 2023 Higher Low, which is technically the Bullish Leg towards the Channel's top and new Higher High.
The peak points of the previous two main Bullish Legs of the Channel Up, took place when the 1D RSI formed Lower Highs against the price's Higher Highs, which is a technical Bearish Divergence. Since the price is currently so close to the top of the Channel Up, we will wait for the RSI to form that Lower High sequence and enter a confirmed sell. Our target will be 163.00, which is a projected contact with the 1D MA50 (blue trend-line) and the 0.382 Fibonacci Channel level, which has always been reached during Bearish Legs.
-------------------------------------------------------------------------------
** Please LIKE 👍, FOLLOW ✅, SHARE 🙌 and COMMENT ✍ if you enjoy this idea! Also share your ideas and charts in the comments section below! This is best way to keep it relevant, support us, keep the content here free and allow the idea to reach as many people as possible. **
-------------------------------------------------------------------------------
💸💸💸💸💸💸
👇 👇 👇 👇 👇 👇

Japanese Yen Weakens on Soft Inflation, BoJ Policy UncertaintyThe Japanese Yen (JPY) faced a decline after softer domestic consumer inflation data, raising uncertainties about the Bank of Japan's (BoJ) potential policy tightening. BoJ's October meeting minutes revealed a consensus to maintain the accommodative policy, contributing to JPY weakness. The USD/JPY pair saw a modest recovery from weekly lows, supported by the USD's modest strength.
Japan's core CPI remains at 2% for the 20th consecutive month, and optimism about future wage growth suggests a potential shift in BoJ's stance. However, the market anticipates a more positive U.S. Federal Reserve (Fed) policy easing in 2024, influenced by the U.S. Q3 GDP report. Investors are now watching the U.S. Core PCE Price Index for further guidance on USD/JPY short-term direction. Despite this, the fundamental outlook leans towards JPY strength, indicating a downside bias for the currency pair.

Japanese Yen Retreats on Soft Inflation, USD StrengthensFrom a technical standpoint, spot prices indicate a potential rebound below the 142.00 level, seemingly breaking the two-day downtrend. This suggests that the overnight break back below the 200-day Simple Moving Average (SMA) is crucial support for bearish traders. Furthermore, oscillators on the daily chart remain firmly in negative territory, indicating minimal resistance for the USD/JPY pair on the downside. Therefore, any subsequent upward move may still be considered a selling opportunity and remains capped near the 142.75 level (200-day SMA). This implies that further buying activity, leading to a move beyond the 143.00 mark, could trigger short-covering actions and allow the bullish camp to reclaim the round figure of 144.00 in the short term.
On the flip side, weakness below the intraday low around the 141.90-141.85 region would reaffirm the short-term trend, making the USD/JPY pair vulnerable to a retest of the sub-141.00 level or the multi-month lows touched last week. The subsequent decline could potentially drive spot prices towards intermediate support at 140.45 on the way to the psychological milestone of 140.00.

JP MORGAN: Can extend this rise to the top of the Channel UpJPM may be overbought on the 1D technical outlook (RSI = 82.199, MACD = 3.72, ADX = 70.645) but is extending the bullish leg of the 14 month Channel Up. It sits comfortably over its middle and calls for an extension. We will enter on the closing of the first red 1D candle and target the 1.618 Fibonacci extension (TP = 174.00), which was the December 1st 2022 HH.
See how our prior idea has worked:
## If you like our free content follow our profile to get more daily ideas. ##
## Comments and likes are greatly appreciated. ##

"USD/JPY: Japanese Yen Halts Decline, Eyes US CPI Data"The Japanese Yen regained positive momentum in the Asian trading session on Tuesday. USD/JPY partially eroded some of the strong recovery seen in the past two days. Investors are awaiting the US Consumer Price Index (CPI) for fresh impetus ahead of the FOMC meeting on Wednesday.
From a technical standpoint, USD/JPY showed a certain degree of recovery last week at the crucial 200-day Simple Moving Average (SMA). The subsequent move exceeded the 23.6% Fibonacci retracement of the recent decline from the vicinity of 152.00, or the YTD high, supporting bullish sentiments. However, the sharp rise during the day halted near the 200-hour SMA, now closing around the 146.50 level. This area will now play a crucial pivot point, and clearing it would allow the price to test the 50% Fibonacci level, around 146.80, and reclaim the 147.00 milestone.
Meanwhile, oscillators on the daily chart are deep in positive territory, supporting the potential for some upward action at higher levels. This suggests that the resistance at the 100-hour SMA, around 145.85, may now act to defend the downside just ahead of the psychological level of 145.00. Further selling pressure could push USD/JPY back towards the intermediate support zone of 144.55-144.50 on the way to the 144.00 mark. A convincing break below this level would be considered a strong bearish catalyst, paving the way for deeper losses.
On the other hand, the Japanese Yen (JPY) extends its downward trend for the second consecutive day, pushing the USD/JPY pair towards the 146.00 level during the European trading session on Monday. A report on Friday suggested that comments from Bank of Japan (BoJ) Governor Kazuo Ueda last week were misunderstood, and the central bank will maintain the status quo until positive wage inflation begins. This comes alongside weaker-than-expected GDP reports from Japan, indicating the domestic economy remains fragile and expectations of imminent rate hikes may be inflated.
Conversely, the US Dollar (USD) attracts some renewed buying interest after betting on an early Federal Reserve (Fed) policy easing was scaled back, proving to be another supportive factor for the USD/JPY exchange rate. Friday's closely watched US employment figures showed a rapid growth pace in November, with the unemployment rate dropping to 3.7%. This indicates signs of underlying strength in the labor market and suggests that current market pricing for a rate cut in March 2024 may be premature.
The recent sharp upward move seen around the USD/JPY pair in the past hour may be attributed to some technical buying based on sustained strength beyond the 100-hour Simple Moving Average (SMA). This suggests that concerns about a deeper global economic downturn and geopolitical risks may limit losses for the safe-haven JPY and restrict any further upside moves for the currency. Traders may also limit strong bets ahead of this week's significant event/data risks - US Consumer Price Index on Tuesday and the crucial FOMC policy decision on Wednesday."

USD/JPY Weakens on Fed Rate Cut Speculation and BoJ PivotThe Japanese Yen has surrendered recent gains against the US Dollar amidst speculation of a Fed rate cut in March and a shift in the Bank of Japan's (BoJ) policies. Despite a day-end recovery, USD/JPY experiences one of its worst trading days in over a year, dropping below 142.00 and closing just above 144.00.
Despite the intraday recovery, USD/JPY had one of its worst trading days in over a year, slipping below 140.00 in November last year. Throughout Thursday's trading session, USD/JPY transitioned from a slight decrease to a drop below the 200-day Simple Moving Average, requiring significant progress for a recovery towards the 147.00 handle. The 50-day SMA is currently positioned higher than the price action on Thursday, pushing towards the 114.90 region.
Expectations of a Fed rate cut weigh on the US Dollar
There is growing speculation that the Federal Reserve has concluded its rate hikes and will commence a rate cut in March, putting pressure on the US Dollar. In contrast, the Bank of Japan is expected to move away from extremely loose monetary policy in the coming months. This, coupled with risk aversion sentiment, offsets the safe-haven appeal of the Japanese Yen.
USD/JPY witnessed a more than 4% decline on Thursday, quickly dropping below 142.00 before larger markets staged a modest recovery, pulling the Japanese Yen (JPY) back into a reasonable price range. USD/JPY closed Thursday down by around 2%, while the Yen entered Friday's market session in the green for the week.
The Yen saw a broader market recovery following unconventional comments from Bank of Japan Governor Kazuo Ueda, unexpectedly hinting at the eventual end of BoJ's negative interest rate policy, possibly in the early part of next year.

"JPY Surges to Three-Month High Against USD"The Japanese Yen extended its robust upward momentum against the US Dollar on Friday and kicked off the new week with a positive sign, pulling the USD/JPY pair to a nearly three-week low around the 146.25-146.20 range during the Asian trading session. The US Dollar is attempting to recover from its lowest point in two and a half months at 146.65, supported by a slight rebound in US Treasury yields, which is exerting pressure on the Japanese Yen.
On Thursday, New York Fed President John Williams suggested that interest rates could reach their highest point, supporting this perspective. In this context, the analysis of Fed Chairman Powell's conference later today will be closely scrutinized to evaluate the central bank's next steps.
On the other hand, growing expectations that the Bank of Japan may move away from its extremely accommodative monetary policy by 2024 are providing some support for the JPY.
From a broader perspective, this currency pair maintains a downward trend from its mid-November high near 152.00, with a resistance level at 148.75 likely to limit the upward movement before the late November peak at 149.75. Support levels are identified at 147.77 and 146.65.

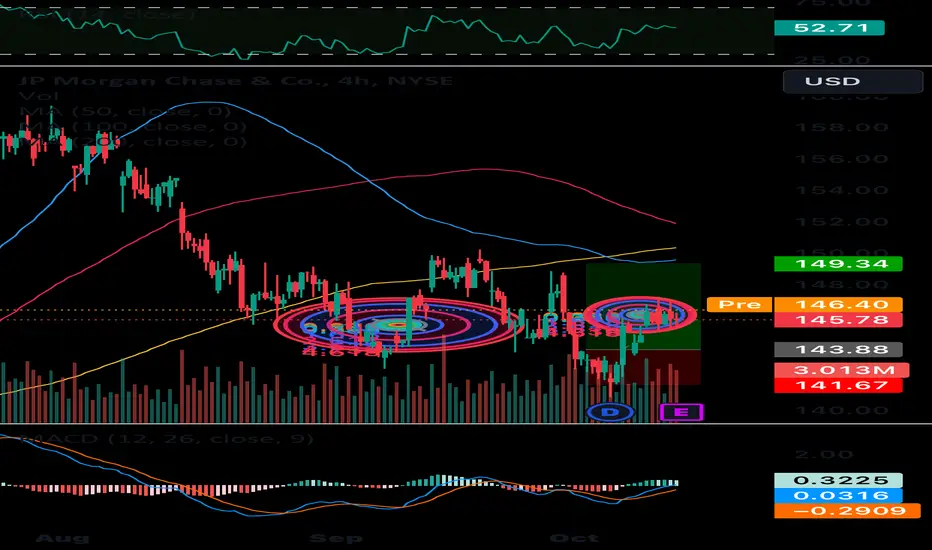
JPM (JP Morgan Chase & Co) with Sell SignalMy SSG system produced a sell signal on JPM. Volatility not so attractive to short calls imho, so I am looking into buying puts currently, maybe financed by a short call...

AVAX EXPLOSIVE Growth Potential - DAPP BuilderPlease Excuse the audio, I have a version on my Youtube with far better audio, for some reason, my computer won't let me select my Microphone. You can find our youtube link in our trading view bio
With the recent announcement by JP Morgan's ONYX regarding their stake in AVAX I thought this would be the perfect time to cover this Incredible asset.
In short ONYX is predicting that subnets ( individual blockchains that have been specifically designed to suit the needs of institutions. That means extra consideration has been given to network privacy, gas, ETC) will be extremely valuable to institutions in the near future and are betting big, since this announcement we have already seen over a 20% increase in price, but how much more can we actually run?
From a Technical side, we are at a huge inflection point, In the past when we have crossed the $18 region we have seen explosive growth, anywhere from 200% - 700%. Although it is highly dependent on bitcoin / ETF approval/ overall market, If we can maintain above this zone its only a matter of time before we fly to our first targets / Resistance points
Outlined here are a few important zones to watch
Resistance Point 1 .382 level: $24.00 ( Just rejected off this 12 hours ago)
Target 1 : - $ 26.60
Target 2 (Midterm Major Resistance/Support Zone): $61.86
Strong Resistance Zone : $93.50
Target 3/ Breakout Resistance Zone: $112.75

"USD/JPY Holds Near Yearly Highs, Trading Around 151.70"The USD/JPY pair regains positive momentum, partially reversing significant losses from the previous day, returning to the 150.15 zone, the week's lowest level. Intraday buying activity intensified after Japan's GDP print fell below expectations, pushing the spot price to new daily highs. The USD/JPY exchange rate fluctuates around 151.70 during the Asian trading session on Tuesday.
The USD/JPY pair maintains its yearly high and has the potential to surpass these levels if the U.S. Dollar (USD) successfully halts recent losses. However, the greenback is facing hurdles from the volatile yields of U.S. Treasury bonds. At the time of writing, the yield on the 10-year U.S. Treasury bond hovers around 4.63%.

USD/JPY Recovers from Recent Losses, Hovers Around 150.50"USD/JPY rebounds from recent losses observed in the previous session following weaker-than-expected US inflation data. However, the pair trades slightly higher around 150.60 in Asian trading on Wednesday. The USD/JPY exchange rate fluctuates around 151.70 in Tuesday's Asian session. The pair holds near yearly highs and has the potential to surpass these levels if the US Dollar (USD) successfully mitigates recent losses. Nevertheless, the greenback faces challenges from volatile US bond yields, with the 10-year Treasury yield hovering around 4.63% at the time of writing.

$ORGN Long Play. C02 Tax Credit PlayPotential Opportunity regarding the new Carbon Credit ESG Tax benefits.
As most of you probably know, new tax regulations are being rolled out that incentivize carbon emission neutrality and many companies are jumping on the opportunity. (See Jpmorgan Purchasing massive swathes of timber forest land)
Origin is the world's leading carbon negative materials company. Our mission is to enable the world’s transition to sustainable materials. Therefore this offers a unique opportunity to be able to cash in on the benefits of these new tax credits without breaking the bank by buying forest land.
Current Target Projections are listed in the illustration. I am keeping a fairly tight stop loss but this isn't necessary if you plan on holding longer term.

Japanese Yen Nears 33-Year Low Amid Powell's Rate Hike SignalThe Japanese yen faced rapid depreciation today, approaching levels not seen in 33 years, following signals from Federal Reserve Chairman Jerome Powell that interest rate hikes may continue amid concerns about persistent inflation. The yen traded at 151.44 against the US dollar, showing a slight 0.06% increase from the previous session.
On Thursday, Powell reiterated hawkish views on interest rates, challenging market expectations that had predicted rate cuts in 2024. His comments underscored doubts about achieving the Fed's 2% inflation target with the current policy framework, leading the market to reconsider the potential for rate cuts in mid-2024 from June to July.
This stance contributed to the yen's worst performance since August, with a monthly decline of 1.42%. The currency's notable slide over the past month hit a one-year low of 151.72 against the dollar on October 31 and is now approaching levels not seen since 151.96.
The sharp decline of the yen has drawn the attention of Japan's Ministry of Finance (MOF), raising growing concerns about the need for intervention in the currency market to stabilize the yen and minimize potential impacts on the Japanese economy. The MOF closely monitors these developments as currency exchange rates hover near a crucial level that previously prompted official action.

JPM JPMorgan Chase & Co Options Ahead of EarningsIf you haven`t sold JPM here:
or reentered ahead of the previous earnings:
Now analyzing the options chain and the chart patterns of JPM JPMorgan Chase & Co prior to the earnings report this week,
I would consider purchasing the 147usd strike price Calls with
an expiration date of 2023-10-13,
for a premium of approximately $1.91.
If these options prove to be profitable prior to the earnings release, I would sell at least half of them.
Looking forward to read your opinion about it.

JP MORGAN Buy signal triggered.JP Morgan Chase crossed over the MA50 (1d) and despite the intra day pull back, it is considered a bullish signal.
This came after the price hit and bounced on the MA200 (1d).
That was the bottom of the 11 month Channel Up.
Trading Plan:
1. Buy on the current market price.
Targets:
1. 157.00 (under the Resistance, same with the April break out).
Tips:
1. The RSI (1d) also crossed over its Falling Resistance. Again similar to April's fractal.
Please like, follow and comment!!

JP MORGAN CHASE 3rd quarter adjusted revenue beats estimatesJPMorgan Chase (NYSE:JPM) has reported adjusted revenue for the third quarter of $40.69 billion, topping Bloomberg consensus estimates of $39.92B.
JP Morgan Chase to continue in the uptrend?JPMorgan Chase - 30d expiry - We look to Buy at 150.35 (stop at 146.75)
The primary trend remains bullish.
A Doji style candle has been posted from the base.
Although the bears are in control, the stalling negative momentum indicates a turnaround is possible.
Daily signals are bullish.
A break of the recent high at 150.25 should result in a further move higher.
The bias is to break to the upside.
Our profit targets will be 159.35 and 161.35
Resistance: 148.87 / 150.25 / 153.00
Support: 143.70 / 142.65 / 140.00
Please be advised that the in formation presented on TradingView is provided to Vantage (‘Vantage Global Limited’, ‘we’) by a third-party provider (‘Everest Fortune Group’). Please be reminded that you are solely responsible for the trading decisions on your account. There is a very high degree of risk involved in trading. Any information and/or content is intended entirely for research, educational and informational purposes only and does not constitute investment or consultation advice or investment strategy. The information is not tailored to the investment needs of any specific person and therefore does not involve a consideration of any of the investment objectives, financial situation or needs of any viewer that may receive it. Kindly also note that past performance is not a reliable indicator of future results. Actual results may differ materially from those anticipated in forward-looking or past performance statements. We assume no liability as to the accuracy or completeness of any of the information and/or content provided herein and the Company cannot be held responsible for any omission, mistake nor for any loss or damage including without limitation to any loss of profit which may arise from reliance on any information supplied by Everest Fortune Group

JP MORGAN: The final buy signal.JP Morgan Chase is trading inside a Channel Up and the most recent HL was on September 8th. Yesterday the 1D MACD formed a Bullish Cross and one last buy validation signal remains, crossing over the 1D MA50. The 1D technical outlooks already just turned bullish (RSI = 55.829, MACD = -1.250, ADX = 38.742) so we will buy that 1D MA50 cross and aim at a +16% total price increase (TP = 165.00).
Prior idea:
## If you like our free content follow our profile to get more daily ideas. ##
## Comments and likes are greatly appreciated. ##

JPM - The banking crisis is not overBesides the obvious head & shoulders, as you increase the timeline from 1M to 2, 3 or 6M the more horrendous it gets.
Massive bearish divergence in RSI.
Price being rejected at the 25 MA, that will most likely lead to a death cross
MACD being rejected at the signal line after the inflated march 2020 pump (looking even more rubbish at higher timeframes)
PPO printing a bearish alert for the first time in its history at 6M (not shown)
I think it will fall to the 0.786 retracement /400 monthly MA / previous top of 50$ minimum . It can go much lower as the MACD suggests, but a 70% is a common retracement for a JP Morgan bear trend and every time it enters a bearish market a retracement to its previous top and to the monthly 400 MA is a guaranteed target.
I think this won't affect negatively the cryptomarket as some people suggest.

JPM continuously negative for 6 weeksJPM continuously negative for 6 weeks
This chart shows the weekly candle chart of JP Morgan's stocks over the past two years. The top to bottom golden section at the end of 2021 is superimposed in the figure. As shown in the figure, JP Morgan's stock hit its high point at the end of July and early August of this year, hitting the top to bottom golden ratio of 0.618 in the chart. Then, it has been continuously negative for 6 weeks, and its low point in the past two weeks has hit the top to bottom golden ratio of 1.382 in the chart! So in the future, just use the lowest point of the previous week as the watershed to determine the strength of JP Morgan's stock!
