JP225 Long Trap or Bull Escape? Heist in Motion.🦹♂️🎯 JP225 Ninja Heist: Breakout Loot Plan 💥💰 (Long Game Playbook)
🌟Hi! Hola! Ola! Bonjour! Hallo! Assallamu Allaikum!🌟
Dear Money Makers, Market Raiders & Silent Robbers, 🤑💰💸✈️
It’s time to gear up for the ultimate breakout heist on the JP225 / NIKKEI Index CFD Market. Based on my 🔥Thief Trading style🔥—a mix of slick technical strategy and deep fundamental recon—this operation is primed for a bullish break-in.
🧠 Plan of Attack:
Our team is targeting a long-side entry only, aiming to loot the market before it hits the Electric Trap Resistance Zone ⚡—a known danger zone where big bears lie in wait. Let’s outsmart them!
🚪 Entry Plan – The Door to Gold
📈 "The heist is on once we crack that resistance vault!"
📍Trigger: Wait for candle close above 40,100 – that's your breakout cue.
🧲Pullback Setup: Place Buy Limit near recent swing low on the 15/30 min timeframe, or stack multiple DCA-style orders to scale in silently.
🔔 Don’t forget to set alerts—you snooze, you lose.
🛡️ Stop Loss – Don’t Get Caught
🛑 "Keep your escape plan ready, always!"
📍Preferred SL: Recent swing low on 4H timeframe @ 39,500
🎯 Adjust based on your risk level and lot sizing.
🧠 Smart robbers move stop loss only after breakout confirmation—don’t let hesitation cost you your cut.
🎯 Profit Target – Secure the Bag
🏴☠️ Escape Plan: Aim for 41,200 or bail early if the scene gets messy.
Use trailing SLs to protect your stash.
Scalpers, only play long side. Let the swing traders set the traps while you slice the pie.
📊 Why This Trade Works:
JP225 is currently fueled by:
🔼 Strong bullish momentum
🔍 Technical breakout setup
💹 Fundamental backdrop: macro trends, institutional flow, COT report, and global sentiment lining up like guards on break
🗞️ Want more intel? Check out the broaderr macroeconomic, sentiment, and positioning insights 🔗🔗🔗
⚠️ Risk Management Alert:
📰 During news hours, don’t act greedy.
❌ Avoid entries near big news drops.
✅ Use trailing SLs to protect profits from volatility whiplash.
❤️ Robbery Crew Boost Request
💥Hit that Boost if this plan helps you grab the market loot!
Let’s grow our Thief Trading Army together—every trader deserves a smooth escape and a fat wallet 🏆💪💸
📌 Disclaimer: This is not financial advice. Just a masterplan from a fellow market raider. Adapt your risk and strategy based on your own style. Markets can flip faster than you can say “bank run”—stay updated, stay sharp, and stay stealthy. 🕶️
🎭 See you at the next heist.
Nikkei 225 JPN225 CFD

Nikkei 225 D1 | Strong upward momentumThe Nikkei 225 (JPN225) is falling towards a pullback support and could potentially bounce off this level to climb higher.
Buy entry is at 40,670.02 which is a pullback support that aligns with the 23.6% Fibonacci retracement.
Stop loss is at 39,100.00 which is a level that lies underneath an overlap support and the 23.6% and 50% Fibonacci retracements.
Take profit is at 42,550.16 which is a swing-high resistance.
High Risk Investment Warning
Trading Forex/CFDs on margin carries a high level of risk and may not be suitable for all investors. Leverage can work against you.
Stratos Markets Limited (tradu.com ):
CFDs are complex instruments and come with a high risk of losing money rapidly due to leverage. 66% of retail investor accounts lose money when trading CFDs with this provider. You should consider whether you understand how CFDs work and whether you can afford to take the high risk of losing your money.
Stratos Europe Ltd (tradu.com ):
CFDs are complex instruments and come with a high risk of losing money rapidly due to leverage. 66% of retail investor accounts lose money when trading CFDs with this provider. You should consider whether you understand how CFDs work and whether you can afford to take the high risk of losing your money.
Stratos Global LLC (tradu.com ):
Losses can exceed deposits.
Please be advised that the information presented on TradingView is provided to Tradu (‘Company’, ‘we’) by a third-party provider (‘TFA Global Pte Ltd’). Please be reminded that you are solely responsible for the trading decisions on your account. There is a very high degree of risk involved in trading. Any information and/or content is intended entirely for research, educational and informational purposes only and does not constitute investment or consultation advice or investment strategy. The information is not tailored to the investment needs of any specific person and therefore does not involve a consideration of any of the investment objectives, financial situation or needs of any viewer that may receive it. Kindly also note that past performance is not a reliable indicator of future results. Actual results may differ materially from those anticipated in forward-looking or past performance statements. We assume no liability as to the accuracy or completeness of any of the information and/or content provided herein and the Company cannot be held responsible for any omission, mistake nor for any loss or damage including without limitation to any loss of profit which may arise from reliance on any information supplied by TFA Global Pte Ltd.
The speaker(s) is neither an employee, agent nor representative of Tradu and is therefore acting independently. The opinions given are their own, constitute general market commentary, and do not constitute the opinion or advice of Tradu or any form of personal or investment advice. Tradu neither endorses nor guarantees offerings of third-party speakers, nor is Tradu responsible for the content, veracity or opinions of third-party speakers, presenters or participants.

Nikkei 225 Index Surges Above 41,000 PointsNikkei 225 Index Surges Above 41,000 Points
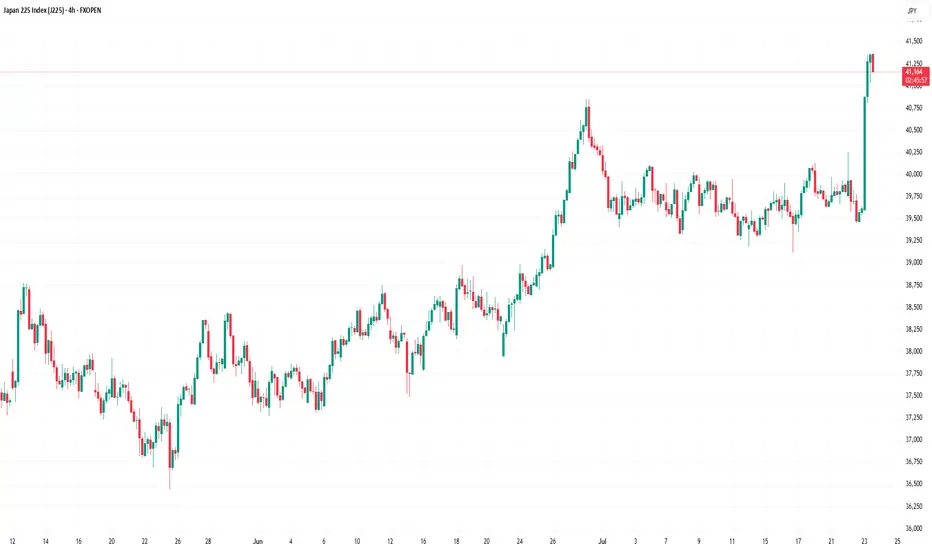
As the chart indicates, the value of the Nikkei 225 stock index has risen above the 41,000-point level — its highest mark since July 2024.
The primary bullish driver is the conclusion of a trade agreement between the United States and Japan. According to media reports, the deal will involve Japan paying a 15% duty on exports to the US, down from the previous 25% tariff. Shares of automotive companies are among the top gainers on the Japanese stock market.
European stock indices have also risen, as EU officials are scheduled to visit Washington on Wednesday, raising hopes for a potential US-EU trade agreement.
Technical Analysis of the Nikkei 225 Chart
Approximately a month ago, we outlined an ascending channel based on the price fluctuations observed in 2025. This formation remains relevant, and:
→ The price has moved into the upper half of the channel, suggesting that the median line may act as a support level going forward.
→ The nature of the latest price action is worth noting: as an immediate reaction to the news of the deal, two long bullish candles formed on the chart. However, once the price reached its 2025 high, upward momentum slowed sharply.
→ The RSI indicator signals overbought conditions.
Thus, it is reasonable to assume that, following an approximate 3.6% surge over an eight-hour period, the bullish momentum may have largely been exhausted. Nikkei 225 (Japan 225 on FXOpen) could now be vulnerable to a pullback, potentially towards the median line. Nonetheless, the ultimate direction will be shaped primarily by fundamental news.
This article represents the opinion of the Companies operating under the FXOpen brand only. It is not to be construed as an offer, solicitation, or recommendation with respect to products and services provided by the Companies operating under the FXOpen brand, nor is it to be considered financial advice.
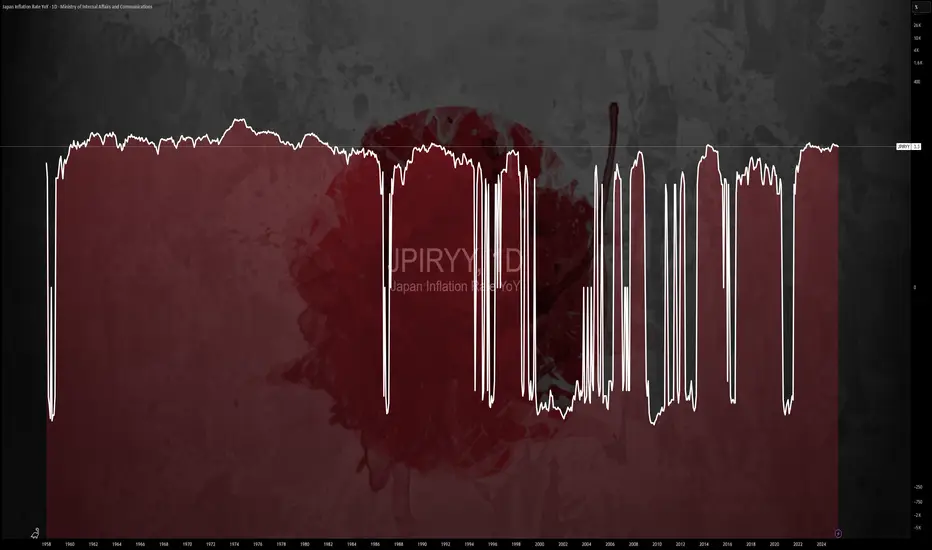
$JPIRYY -Japan Inflation Hits 7-Month Low (June/2025)ECONOMICS:JPIRYY 3.3%
June/2025
source: Ministry of Internal Affairs & Communications
-Japan’s annual inflation rate eased to 3.3% in June 2025 from 3.5% in May, marking the lowest reading since last November, as a sharp slowdown in electricity and gas prices offset persistent upward pressure from rice.
Core inflation also matched the headline rate at 3.3%, pointing to a three-month low and aligning with expectations.
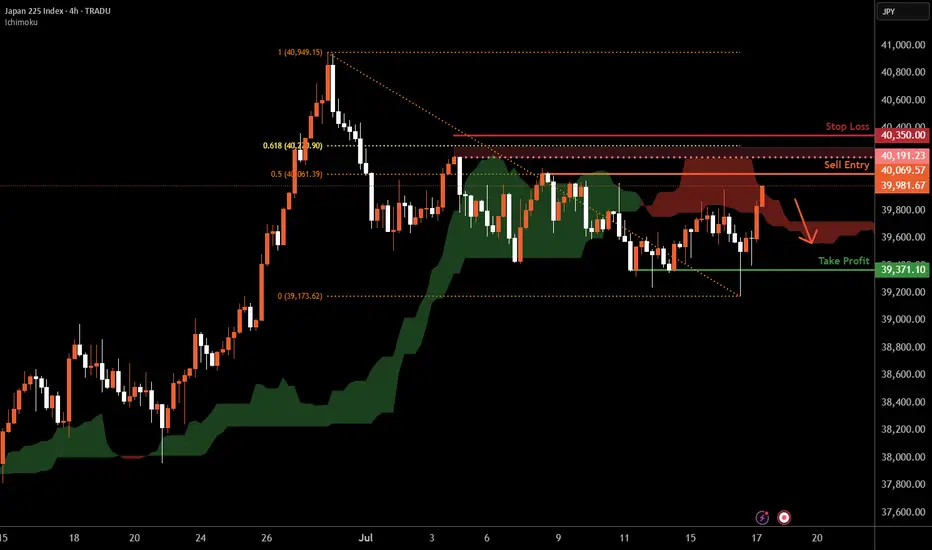
Nikkei 225 H4 | Swing-high resistance at 50% Fibo retracementThe Nikkei 225 (JPN225) is rising towards a swing-high resistance and could potentially reverse off this level to drop lower.
Sell entry is at 40,069.57 which is a swing-high resistance that aligns with the 50% Fibonacci retracement.
Stop loss is at 40,350.00 which is a level that sits above the 61.8% Fibonacci retracement and a swing-high resistance.
Take profit is at 39,371.10 which is a multi-swing-low support.
High Risk Investment Warning
Trading Forex/CFDs on margin carries a high level of risk and may not be suitable for all investors. Leverage can work against you.
Stratos Markets Limited (tradu.com ):
CFDs are complex instruments and come with a high risk of losing money rapidly due to leverage. 66% of retail investor accounts lose money when trading CFDs with this provider. You should consider whether you understand how CFDs work and whether you can afford to take the high risk of losing your money.
Stratos Europe Ltd (tradu.com ):
CFDs are complex instruments and come with a high risk of losing money rapidly due to leverage. 66% of retail investor accounts lose money when trading CFDs with this provider. You should consider whether you understand how CFDs work and whether you can afford to take the high risk of losing your money.
Stratos Global LLC (tradu.com ):
Losses can exceed deposits.
Please be advised that the information presented on TradingView is provided to Tradu (‘Company’, ‘we’) by a third-party provider (‘TFA Global Pte Ltd’). Please be reminded that you are solely responsible for the trading decisions on your account. There is a very high degree of risk involved in trading. Any information and/or content is intended entirely for research, educational and informational purposes only and does not constitute investment or consultation advice or investment strategy. The information is not tailored to the investment needs of any specific person and therefore does not involve a consideration of any of the investment objectives, financial situation or needs of any viewer that may receive it. Kindly also note that past performance is not a reliable indicator of future results. Actual results may differ materially from those anticipated in forward-looking or past performance statements. We assume no liability as to the accuracy or completeness of any of the information and/or content provided herein and the Company cannot be held responsible for any omission, mistake nor for any loss or damage including without limitation to any loss of profit which may arise from reliance on any information supplied by TFA Global Pte Ltd.
The speaker(s) is neither an employee, agent nor representative of Tradu and is therefore acting independently. The opinions given are their own, constitute general market commentary, and do not constitute the opinion or advice of Tradu or any form of personal or investment advice. Tradu neither endorses nor guarantees offerings of third-party speakers, nor is Tradu responsible for the content, veracity or opinions of third-party speakers, presenters or participants.
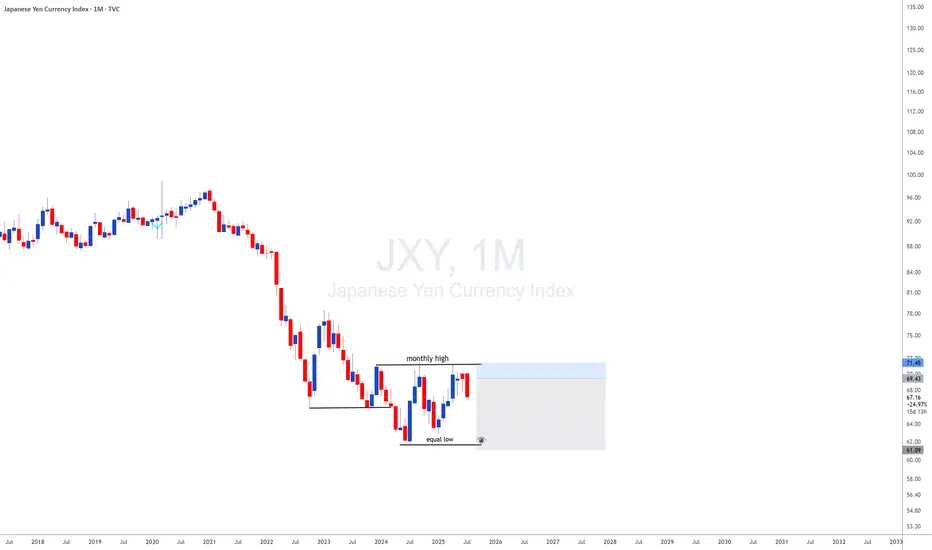
JXY with JXY looking monthly downside and DXY looing upside i will be looking for 35 years breakout of usdjpy meanning uj is a long therm upside
How to View the Assets in Japan
It should be noted that many of the assets the government owns are not marketable, or, if so, their
price can sharply drop in the case of fiscal crisis. Therefore, the financial situation should be assessed
first by gross debt.
In addition, the assets earmarked with the liabilities (such as pension reserves and FILP loans) are
not directly related to fiscal consolidation because they are not included in “Bonds outstanding of
central and local governments”, which is the benchmark of fiscal consolidation target
Nikkei 225 H1 | Swing-high resistance at a Fibo confluence zoneThe Nikkei 225 (JPN225) is rising towards a swing-high resistance and could potentially reverse off this level to drop lower.
Sell entry is at 40,196.22 which is a swing-high resistance that aligns with a confluence of Fibonacci levels i.e. the 78.6% projection and the 127.2% extension.
Stop loss is at 40,480.00 which is a level that sits above the 161.8% Fibonacci extension and an overlap resistance.
Take profit is at 39,712.53 which is a swing-low support.
High Risk Investment Warning
Trading Forex/CFDs on margin carries a high level of risk and may not be suitable for all investors. Leverage can work against you.
Stratos Markets Limited (tradu.com ):
CFDs are complex instruments and come with a high risk of losing money rapidly due to leverage. 63% of retail investor accounts lose money when trading CFDs with this provider. You should consider whether you understand how CFDs work and whether you can afford to take the high risk of losing your money.
Stratos Europe Ltd (tradu.com ):
CFDs are complex instruments and come with a high risk of losing money rapidly due to leverage. 63% of retail investor accounts lose money when trading CFDs with this provider. You should consider whether you understand how CFDs work and whether you can afford to take the high risk of losing your money.
Stratos Global LLC (tradu.com ):
Losses can exceed deposits.
Please be advised that the information presented on TradingView is provided to Tradu (‘Company’, ‘we’) by a third-party provider (‘TFA Global Pte Ltd’). Please be reminded that you are solely responsible for the trading decisions on your account. There is a very high degree of risk involved in trading. Any information and/or content is intended entirely for research, educational and informational purposes only and does not constitute investment or consultation advice or investment strategy. The information is not tailored to the investment needs of any specific person and therefore does not involve a consideration of any of the investment objectives, financial situation or needs of any viewer that may receive it. Kindly also note that past performance is not a reliable indicator of future results. Actual results may differ materially from those anticipated in forward-looking or past performance statements. We assume no liability as to the accuracy or completeness of any of the information and/or content provided herein and the Company cannot be held responsible for any omission, mistake nor for any loss or damage including without limitation to any loss of profit which may arise from reliance on any information supplied by TFA Global Pte Ltd.
The speaker(s) is neither an employee, agent nor representative of Tradu and is therefore acting independently. The opinions given are their own, constitute general market commentary, and do not constitute the opinion or advice of Tradu or any form of personal or investment advice. Tradu neither endorses nor guarantees offerings of third-party speakers, nor is Tradu responsible for the content, veracity or opinions of third-party speakers, presenters or participants.

Nikkei 225 H1 | Potential bullish bounceThe Nikkei 225 (JPN225) is falling towards an overlap support and could potentially bounce off this level to climb higher.
Buy entry is at 39,552.68 which is an overlap support that aligns with the 50% Fibonacci retracement.
Stop loss is at 38,850.00 which is a level that lies underneath an overlap support and the 61.8% Fibonacci retracement.
Take profit is at 40,453.12 which is an overlap resistance that aligns with the 61.8% Fibonacci retracement.
High Risk Investment Warning
Trading Forex/CFDs on margin carries a high level of risk and may not be suitable for all investors. Leverage can work against you.
Stratos Markets Limited (tradu.com ):
CFDs are complex instruments and come with a high risk of losing money rapidly due to leverage. 63% of retail investor accounts lose money when trading CFDs with this provider. You should consider whether you understand how CFDs work and whether you can afford to take the high risk of losing your money.
Stratos Europe Ltd (tradu.com ):
CFDs are complex instruments and come with a high risk of losing money rapidly due to leverage. 63% of retail investor accounts lose money when trading CFDs with this provider. You should consider whether you understand how CFDs work and whether you can afford to take the high risk of losing your money.
Stratos Global LLC (tradu.com ):
Losses can exceed deposits.
Please be advised that the information presented on TradingView is provided to Tradu (‘Company’, ‘we’) by a third-party provider (‘TFA Global Pte Ltd’). Please be reminded that you are solely responsible for the trading decisions on your account. There is a very high degree of risk involved in trading. Any information and/or content is intended entirely for research, educational and informational purposes only and does not constitute investment or consultation advice or investment strategy. The information is not tailored to the investment needs of any specific person and therefore does not involve a consideration of any of the investment objectives, financial situation or needs of any viewer that may receive it. Kindly also note that past performance is not a reliable indicator of future results. Actual results may differ materially from those anticipated in forward-looking or past performance statements. We assume no liability as to the accuracy or completeness of any of the information and/or content provided herein and the Company cannot be held responsible for any omission, mistake nor for any loss or damage including without limitation to any loss of profit which may arise from reliance on any information supplied by TFA Global Pte Ltd.
The speaker(s) is neither an employee, agent nor representative of Tradu and is therefore acting independently. The opinions given are their own, constitute general market commentary, and do not constitute the opinion or advice of Tradu or any form of personal or investment advice. Tradu neither endorses nor guarantees offerings of third-party speakers, nor is Tradu responsible for the content, veracity or opinions of third-party speakers, presenters or participants.

Is Japan's Economic Future at a Tariff Crossroads?The Nikkei 225, Japan's benchmark stock index, stands at a critical juncture, facing significant pressure from potential US tariffs of up to 35% on Japanese imports. This assertive stance by US President Donald Trump has already triggered a notable decline in Japanese equities, with the Nikkei 225 experiencing a 1.1% drop and the broader Topix Index falling 0.6% on Wednesday, marking consecutive days of losses. This immediate market reaction, characterized by a broad-based selloff across all sectors, underscores profound investor concern and a pre-emptive pricing-in of negative outcomes, particularly for the highly vulnerable automotive and agricultural sectors.
The looming July 9 deadline for a trade agreement is pivotal, with President Trump explicitly stating his intention not to extend the current tariff pause. These proposed tariffs would far exceed previous rates, adding substantial financial burdens to industries already facing existing levies. Japan's economy, already struggling with a recent contraction in GDP and persistent declines in real wages, is particularly susceptible to such external shocks. This pre-existing economic fragility implies that the tariffs could amplify existing weaknesses, pushing the nation closer to recession and intensifying domestic discontent.
Beyond immediate trade concerns, Washington appears to be leveraging the tariff threat to compel allies like Japan to increase military spending, aiming for 5% of GDP amidst rising geopolitical tensions. This demand strains the "ironclad" US-Japan military alliance, as evidenced by diplomatic setbacks and Japan's internal political challenges in meeting such ambitious defense targets. The unpredictable nature of US trade policy, coupled with these geopolitical undercurrents, creates a complex environment where Japan's economic stability and strategic autonomy are simultaneously challenged, necessitating significant strategic adjustments in its international relationships.

Can You Rob JP225 Profits with This Thief Trading Trick?🌍 Master the Nikkei Heist: Your Ticket to Epic Profits! 🌍
Hello, Profit Pirates & Market Marauders! 🤑💰🚀
Get ready to raid the JP225/Nikkei Index CFD market with our Thief Trading Style—a killer mix of technical precision and fundamental flair! 🎯 This plan is your map to a long entry heist, dodging the high-risk Red Zone where overbought traps and bearish bandits lurk. Follow this strategy, lock in those gains, and sail away with the loot! 💪🎉
📈 Entry: Strike When the Iron’s Hot!
Breakout Blitz 🚀: Watch for the MA breakout at 38,400, then jump in for bullish riches!
Smart Moves 📌: Place buy stop orders above the moving average or set buy limit orders on pullbacks within the latest 15/30-minute swing low/high.
Stay Sharp 🔔: Set a chart alert to catch the breakout signal as it happens!
🛑 Stop Loss: Protect Your Treasure!
Buy Stop Strategy 📍: Hold off on setting your stop loss until the breakout confirms. Place it at the 4H timeframe recent/swing low (37,200) for swing trades.
Risk Your Way ⚠️: Tailor your SL to your lot size, risk appetite, and number of orders. Stay cautious, not crazy! 🔥
Wild Card 😎: Want to roll the dice? Set your SL wherever you dare—just don’t cry if the market bites back! 👊
🎯 Target: Grab the Gold and Go!
Profit Zone 🏆: Aim for 40,500 or slip out early if the market throws curveballs.
Scalper Alert 👀: Stick to long-side scalps. Got a big budget? Dive in! Smaller funds? Team up with swing traders and use a trailing SL to guard your gains. 💰
🐂 Why the Nikkei’s Ready to Run
The JP225/Nikkei Index CFD is roaring bullish, driven by:
📊 Macro & Fundamental Insights: Dive into global economic trends, COT reports, and intermarket dynamics for the full scoop.
📰 News & Sentiment: Geopolitical moves and market vibes are fueling this rally—keep your finger on the pulse!
⚠️ Trading Alert: Sidestep the News Traps!
News can rattle markets like a storm. Stay safe:
🚫 Skip new trades during major news drops.
🛡️ Use trailing stop-loss orders to lock in profits and shield open positions.
💥 Power Up the Heist: Boost and Win! 💥
Rally behind our Thief Trading Style by hitting that Boost Button! 🚀 It supercharges our crew to snatch profits daily. Join the gang, stack cash, and keep the market guessing! 🤝❤️
Catch you at the next heist, legends! 🤑🐱👤🎉

Nikkei 225 Index Rises Above 40,000 PointsNikkei 225 Index Rises Above 40,000 Points
As the chart shows, the Nikkei 225 stock index (Japan 225 on FXOpen) has risen above the psychological level of 40,000 points — for the first time in five months.
Bullish drivers include:
→ Reduced geopolitical risks. A ceasefire between Iran and Israel has boosted market sentiment, with stock indices rising both on Wall Street (yesterday the Nasdaq 100 hit a new all-time high) and in Japan.
→ Easing fears of a prolonged trade war. White House Press Secretary Karoline Leavitt noted that the timeline for implementing tariffs is flexible and could be extended.
→ Economic news. Recent data shows that inflation in Japan has slowed for the first time in four months: the core consumer price index fell to 3.1% from 3.6% in May.
Technical Analysis of the Nikkei 225 Chart
Price movements are forming an upward channel (highlighted in blue), but the market appears vulnerable to a pullback, as suggested by:
→ proximity to the upper boundary of the channel;
→ overbought conditions indicated by the RSI.
If a pullback develops, it will provide yet another example of how the price failed to hold above the psychological level of 40,000 — something we've seen repeatedly since October 2024, and we've been pointing out this pattern for quite some time.
Therefore, we might witness another false breakout above the 40K level on the Nikkei 225 (Japan 225 on FXOpen), followed by a retreat deeper into the blue channel — potentially towards its median line.
This article represents the opinion of the Companies operating under the FXOpen brand only. It is not to be construed as an offer, solicitation, or recommendation with respect to products and services provided by the Companies operating under the FXOpen brand, nor is it to be considered financial advice.

Nikkei 225 H4 | Rising toward a 61.8% Fibonacci retracementThe Nikkei 225 (JPN225) is rising towards a pullback resistance and could potentially reverse off this level to drop lower.
Sell entry is at 38,651.50 which is a pullback resistance that aligns closely with the 61.8% Fibonacci retracement.
Stop loss is at 39,000.00 which is a level that sits above a multi-swing-high resistance.
Take profit is at 37,840.09 which is a pullback support that aligns closely with the 78.6% Fibonacci retracement.
High Risk Investment Warning
Trading Forex/CFDs on margin carries a high level of risk and may not be suitable for all investors. Leverage can work against you.
Stratos Markets Limited (tradu.com ):
CFDs are complex instruments and come with a high risk of losing money rapidly due to leverage. 63% of retail investor accounts lose money when trading CFDs with this provider. You should consider whether you understand how CFDs work and whether you can afford to take the high risk of losing your money.
Stratos Europe Ltd (tradu.com ):
CFDs are complex instruments and come with a high risk of losing money rapidly due to leverage. 63% of retail investor accounts lose money when trading CFDs with this provider. You should consider whether you understand how CFDs work and whether you can afford to take the high risk of losing your money.
Stratos Global LLC (tradu.com ):
Losses can exceed deposits.
Please be advised that the information presented on TradingView is provided to Tradu (‘Company’, ‘we’) by a third-party provider (‘TFA Global Pte Ltd’). Please be reminded that you are solely responsible for the trading decisions on your account. There is a very high degree of risk involved in trading. Any information and/or content is intended entirely for research, educational and informational purposes only and does not constitute investment or consultation advice or investment strategy. The information is not tailored to the investment needs of any specific person and therefore does not involve a consideration of any of the investment objectives, financial situation or needs of any viewer that may receive it. Kindly also note that past performance is not a reliable indicator of future results. Actual results may differ materially from those anticipated in forward-looking or past performance statements. We assume no liability as to the accuracy or completeness of any of the information and/or content provided herein and the Company cannot be held responsible for any omission, mistake nor for any loss or damage including without limitation to any loss of profit which may arise from reliance on any information supplied by TFA Global Pte Ltd.
The speaker(s) is neither an employee, agent nor representative of Tradu and is therefore acting independently. The opinions given are their own, constitute general market commentary, and do not constitute the opinion or advice of Tradu or any form of personal or investment advice. Tradu neither endorses nor guarantees offerings of third-party speakers, nor is Tradu responsible for the content, veracity or opinions of third-party speakers, presenters or participants.

$JPIRYY -Japan CPI (May/2025)ECONOMICS:JPIRYY
May/2025
source: Ministry of Internal Affairs & Communications
- Japan's annual inflation rate edged down to 3.5% in May 2025 from 3.6% in the previous two months, marking the lowest level since November.
Price growth eased for clothing (2.6% vs 2.7% in April), household items (3.6% vs 4.1%), and healthcare (2.0% vs 2.2%), while education costs fell further (-5.6%). In contrast, inflation held steady for transport (2.7%) and miscellaneous items (1.3%), but accelerated for housing (1.1% vs 1.0%), recreation (3.0% vs 2.7%), and communications (1.9% vs 1.1%).
Meanwhile, prices of electricity (11.3% vs 13.5%) and gas (5.4% vs 4.4%) remained elevated.
On the food side, prices increased by 6.5%, staying at the slowest pace in four months, though rice prices soared over 100%, underscoring the limited impact of government efforts to rein in staple food costs.
Meanwhile, the core inflation accelerated to 3.7% from 3.5% in April, reaching its highest level in over two years, ahead of the summer election.
Monthly, the CPI rose 0.3%, after a 0.1% gain in April.

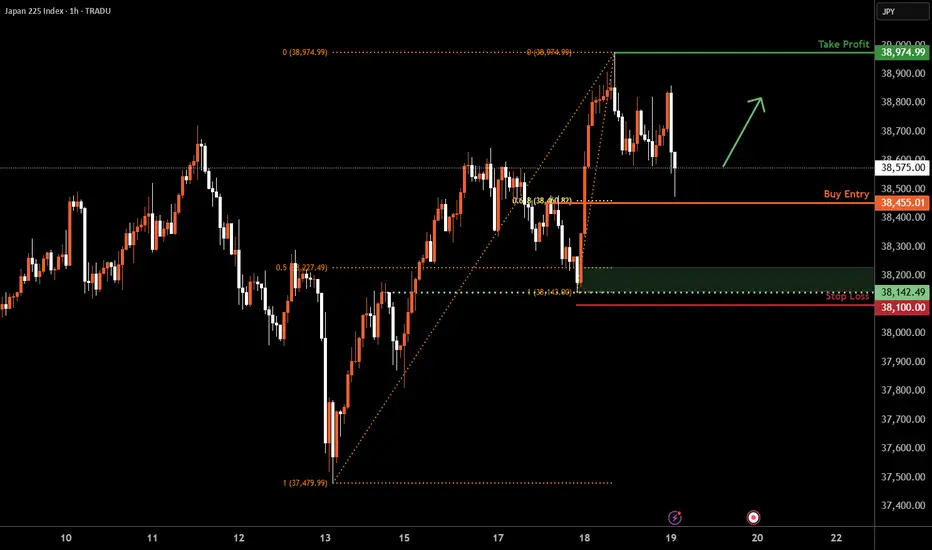
Nikkei 225 H1 | Pullback support at 61.8% Fibonacci retracementThe Nikkei 225 (JPN225) is falling towards a pullback support and could potentially bounce off this level to climb higher.
Buy entry is at 38,455.01 which is a pullback support that aligns with the 61.8% Fibonacci retracement.
Stop loss is at 38,100.00 which is a level that lies underneath an overlap support and the 50% Fibonacci retracement.
Take profit is at 38,974.99 which is a swing-high resistance.
High Risk Investment Warning
Trading Forex/CFDs on margin carries a high level of risk and may not be suitable for all investors. Leverage can work against you.
Stratos Markets Limited (tradu.com ):
CFDs are complex instruments and come with a high risk of losing money rapidly due to leverage. 63% of retail investor accounts lose money when trading CFDs with this provider. You should consider whether you understand how CFDs work and whether you can afford to take the high risk of losing your money.
Stratos Europe Ltd (tradu.com ):
CFDs are complex instruments and come with a high risk of losing money rapidly due to leverage. 63% of retail investor accounts lose money when trading CFDs with this provider. You should consider whether you understand how CFDs work and whether you can afford to take the high risk of losing your money.
Stratos Global LLC (tradu.com ):
Losses can exceed deposits.
Please be advised that the information presented on TradingView is provided to Tradu (‘Company’, ‘we’) by a third-party provider (‘TFA Global Pte Ltd’). Please be reminded that you are solely responsible for the trading decisions on your account. There is a very high degree of risk involved in trading. Any information and/or content is intended entirely for research, educational and informational purposes only and does not constitute investment or consultation advice or investment strategy. The information is not tailored to the investment needs of any specific person and therefore does not involve a consideration of any of the investment objectives, financial situation or needs of any viewer that may receive it. Kindly also note that past performance is not a reliable indicator of future results. Actual results may differ materially from those anticipated in forward-looking or past performance statements. We assume no liability as to the accuracy or completeness of any of the information and/or content provided herein and the Company cannot be held responsible for any omission, mistake nor for any loss or damage including without limitation to any loss of profit which may arise from reliance on any information supplied by TFA Global Pte Ltd.
The speaker(s) is neither an employee, agent nor representative of Tradu and is therefore acting independently. The opinions given are their own, constitute general market commentary, and do not constitute the opinion or advice of Tradu or any form of personal or investment advice. Tradu neither endorses nor guarantees offerings of third-party speakers, nor is Tradu responsible for the content, veracity or opinions of third-party speakers, presenters or participants.
Nikkei 225 H1 | Swing-high resistance at 61.8% Fibo retracementThe Nikkei 225 (JPN225) is rising towards a swing-high resistance and could potentially reverse off this level to drop lower.
Sell entry is at 38,245.01 which is a swing-high resistance that aligns with the 61.8% Fibonacci retracement.
Stop loss is at 38,500.00 which is a level that sits above the 78.6% Fibonacci retracement and a pullback resistance.
Take profit is at 37,855.58 which is an overlap support.
High Risk Investment Warning
Trading Forex/CFDs on margin carries a high level of risk and may not be suitable for all investors. Leverage can work against you.
Stratos Markets Limited (tradu.com ):
CFDs are complex instruments and come with a high risk of losing money rapidly due to leverage. 63% of retail investor accounts lose money when trading CFDs with this provider. You should consider whether you understand how CFDs work and whether you can afford to take the high risk of losing your money.
Stratos Europe Ltd (tradu.com ):
CFDs are complex instruments and come with a high risk of losing money rapidly due to leverage. 63% of retail investor accounts lose money when trading CFDs with this provider. You should consider whether you understand how CFDs work and whether you can afford to take the high risk of losing your money.
Stratos Global LLC (tradu.com ):
Losses can exceed deposits.
Please be advised that the information presented on TradingView is provided to Tradu (‘Company’, ‘we’) by a third-party provider (‘TFA Global Pte Ltd’). Please be reminded that you are solely responsible for the trading decisions on your account. There is a very high degree of risk involved in trading. Any information and/or content is intended entirely for research, educational and informational purposes only and does not constitute investment or consultation advice or investment strategy. The information is not tailored to the investment needs of any specific person and therefore does not involve a consideration of any of the investment objectives, financial situation or needs of any viewer that may receive it. Kindly also note that past performance is not a reliable indicator of future results. Actual results may differ materially from those anticipated in forward-looking or past performance statements. We assume no liability as to the accuracy or completeness of any of the information and/or content provided herein and the Company cannot be held responsible for any omission, mistake nor for any loss or damage including without limitation to any loss of profit which may arise from reliance on any information supplied by TFA Global Pte Ltd.
The speaker(s) is neither an employee, agent nor representative of Tradu and is therefore acting independently. The opinions given are their own, constitute general market commentary, and do not constitute the opinion or advice of Tradu or any form of personal or investment advice. Tradu neither endorses nor guarantees offerings of third-party speakers, nor is Tradu responsible for the content, veracity or opinions of third-party speakers, presenters or participants.

Nikkei 225. Tokyo Open Delivery cause of Geopolitical DriversSharing my Tokyo Open model for the daily expansion on Nikkei. Along with Intraday market profiles. And Quarterly Theory

Nikkei H4 | Falling toward a multi-swing-low supportNikkei (JPN225) is falling towards a multi-swing-low support and could potentially bounce off this level to climb higher.
Buy entry is at 36,688.39 which is a multi-swing-low support that aligns with the 23.6% Fibonacci retracement.
Stop loss is at 35,300.00 which is a level that lies underneath an overlap support and the 38.2% Fibonacci retracement.
Take profit is at 38,831.79 which is a swing-high resistance.
High Risk Investment Warning
Trading Forex/CFDs on margin carries a high level of risk and may not be suitable for all investors. Leverage can work against you.
Stratos Markets Limited (tradu.com ):
CFDs are complex instruments and come with a high risk of losing money rapidly due to leverage. 63% of retail investor accounts lose money when trading CFDs with this provider. You should consider whether you understand how CFDs work and whether you can afford to take the high risk of losing your money.
Stratos Europe Ltd (tradu.com ):
CFDs are complex instruments and come with a high risk of losing money rapidly due to leverage. 63% of retail investor accounts lose money when trading CFDs with this provider. You should consider whether you understand how CFDs work and whether you can afford to take the high risk of losing your money.
Stratos Global LLC (tradu.com ):
Losses can exceed deposits.
Please be advised that the information presented on TradingView is provided to Tradu (‘Company’, ‘we’) by a third-party provider (‘TFA Global Pte Ltd’). Please be reminded that you are solely responsible for the trading decisions on your account. There is a very high degree of risk involved in trading. Any information and/or content is intended entirely for research, educational and informational purposes only and does not constitute investment or consultation advice or investment strategy. The information is not tailored to the investment needs of any specific person and therefore does not involve a consideration of any of the investment objectives, financial situation or needs of any viewer that may receive it. Kindly also note that past performance is not a reliable indicator of future results. Actual results may differ materially from those anticipated in forward-looking or past performance statements. We assume no liability as to the accuracy or completeness of any of the information and/or content provided herein and the Company cannot be held responsible for any omission, mistake nor for any loss or damage including without limitation to any loss of profit which may arise from reliance on any information supplied by TFA Global Pte Ltd.
The speaker(s) is neither an employee, agent nor representative of Tradu and is therefore acting independently. The opinions given are their own, constitute general market commentary, and do not constitute the opinion or advice of Tradu or any form of personal or investment advice. Tradu neither endorses nor guarantees offerings of third-party speakers, nor is Tradu responsible for the content, veracity or opinions of third-party speakers, presenters or participants.

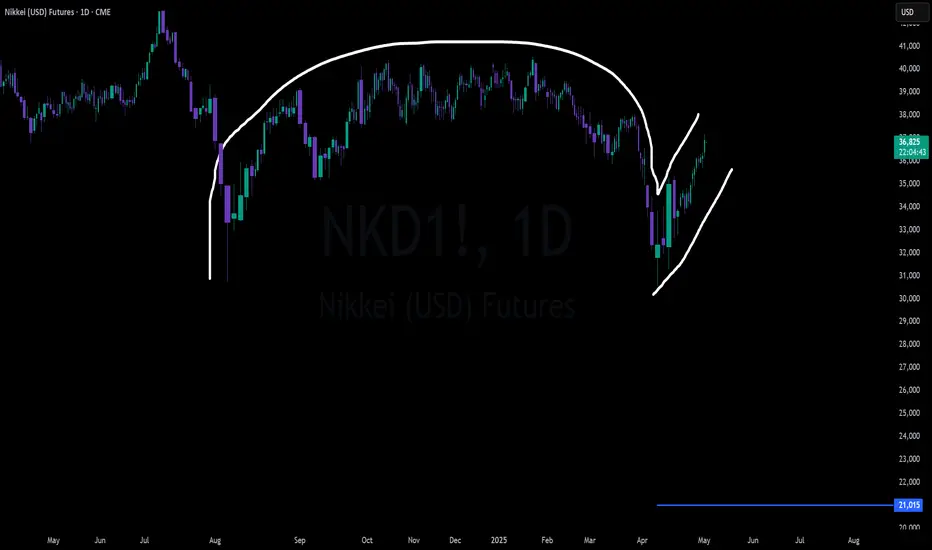
Nikkei Futures (NKD/Nikkei 225) Inverse Cup and HandleNikkei futures have setup an inverse cup and handle on the daily. A somewhat rare pattern as most of them turn into double bottoms or sideways consolidation. Maximum downside target for the pattern is 21,000
- Global macro trends continue to worsen
- BOJ stuck between saving the Yen and helping the dollar
- Japan economic fundamentals may allow BOJ to allow inflation to run hot
- Possible US recession could spread around the world
- Yen carry trade still in play although most likely only blows up in catastrophic situation
- Japan has seen the benefit of US monetary and fiscal policy, Trump admin likely to try to pressure Japan into spending money on US goods such as food and weapons
Overall sentiment on NKD is that it has followed US markets especially the Nasdaq for some time. DXY moving up takes pressure off the Yen carry but could be a sign of now US firms taking profit on a very large run up in the past few weeks. Regardless of outcome, volatility is expected.
$JPINTR -BoJ Holds Rates but Cuts GDP Growth Outlook (May/2025)ECONOMICS:JPINTR
May/2025
source: Bank of Japan
-The Bank of Japan (BoJ) kept its key short-term interest rate at 0.5% during its May meeting, in line with expectations.
The unanimous decision came amid growing concerns over the impact of U.S. tariffs.
In its quarterly outlook, the BoJ slashed its FY 2025 GDP growth forecast to 0.5%, from January’s estimate of 1.0%.
The growth outlook for FY 2026 was also lowered to 0.7% from the prior forecast of 1.0%.

"JP225 / NIKKEI" Index CFD Market Heist Plan (Swing/Day Trade)🌟Hi! Hola! Ola! Bonjour! Hallo! Marhaba!🌟
Dear Money Makers & Robbers, 🤑 💰💸✈️
Based on 🔥Thief Trading style technical and fundamental analysis🔥, here is our master plan to heist the "JP225 / NIKKEI" Index CFD Market. Please adhere to the strategy I've outlined in the chart, which emphasizes long entry. Our aim is to escape near the high-risk ATR Zone. Risky level, overbought market, consolidation, trend reversal, trap at the level where traders and bearish robbers are stronger. 🏆💸"Take profit and treat yourself, traders. You deserve it!💪🏆🎉
Entry 📈 : "The heist is on! Wait for the MA breakout (34700) then make your move - Bullish profits await!"
however I advise to Place Buy stop orders above the Moving average (or) Place buy limit orders within a 15 or 30 minute timeframe most recent or swing, low or high level for Pullback entries.
📌I strongly advise you to set an "alert (Alarm)" on your chart so you can see when the breakout entry occurs.
Stop Loss 🛑: "🔊 Yo, listen up! 🗣️ If you're lookin' to get in on a buy stop order, don't even think about settin' that stop loss till after the breakout 🚀. You feel me? Now, if you're smart, you'll place that stop loss where I told you to 📍, but if you're a rebel, you can put it wherever you like 🤪 - just don't say I didn't warn you ⚠️. You're playin' with fire 🔥, and it's your risk, not mine 👊."
📍 Thief SL placed at the recent/swing low level Using the 3H timeframe (33600) Day trade basis.
📍 SL is based on your risk of the trade, lot size and how many multiple orders you have to take.
🏴☠️Target 🎯: 36100 (or) Escape Before the Target
🧲Scalpers, take note 👀 : only scalp on the Long side. If you have a lot of money, you can go straight away; if not, you can join swing traders and carry out the robbery plan. Use trailing SL to safeguard your money 💰.
💰💵💴💸"JP225 / NIKKEI" Index CFD Market Heist Plan (Day / Swing Trade) is currently experiencing a bullishness🐂.., driven by several key factors.👆👆👆
📰🗞️Get & Read the Fundamental, Macro economics, COT Report, Geopolitical and News Analysis, Sentimental Outlook, Intermarket Analysis, Index-Specific Analysis,Positioning and future trend targets with Overall Score...... go ahead to check 👉👉👉🔗🔗
⚠️Trading Alert : News Releases and Position Management 📰 🗞️ 🚫🚏
As a reminder, news releases can have a significant impact on market prices and volatility. To minimize potential losses and protect your running positions,
we recommend the following:
Avoid taking new trades during news releases
Use trailing stop-loss orders to protect your running positions and lock in profits
💖Supporting our robbery plan 💥Hit the Boost Button💥 will enable us to effortlessly make and steal money 💰💵. Boost the strength of our robbery team. Every day in this market make money with ease by using the Thief Trading Style.🏆💪🤝❤️🎉🚀
I'll see you soon with another heist plan, so stay tuned 🤑🐱👤🤗🤩

GBP/JPY Triangle Breakout (11.04.2025)The GBP/JPY Pair on the M30 timeframe presents a Potential Selling Opportunity due to a recent Formation of a Triangle Breakout Pattern. This suggests a shift in momentum towards the downside in the coming hours.
Possible Short Trade:
Entry: Consider Entering A Short Position around Trendline Of The Pattern.
Target Levels:
1st Support – 184.40
2nd Support – 182.60
🎁 Please hit the like button and
🎁 Leave a comment to support for My Post !
Your likes and comments are incredibly motivating and will encourage me to share more analysis with you.
Best Regards, KABHI_TA_TRADING
Thank you.

The level to sell JPN225 is33,300 based on our charts.
Big picture:
1) Daily Trend is down
2) H4 is down
3) Trend Line hitting on H4
There is a M5 pattern to sell this pair. It is currently showing weakness and we will monitor for an entry close to 33,000

short opportunity This is a very bearish chart. I missed to opened a short position so now I have to wait for the second chance.
I will open a short position if and when:
1. the price comes back up to fill the gap in the daily chart.
2. The price is going to roll back down at major fib level such as 0.618 and 0.5.
3. Momentum indicators in daily chart stay in the bear zone and roll down to the downside.
