US 500 S&P INDEX MARKET TRADE SETUPS & SIGNALS For 11th Dec 2019www.youtube.com
I Publish Daily chart updates on over 49 Assets including Forex pairs, Indices, Commodities, Metals, Cryptos and more. Watch them via the above link
Nikkei 225 JPN225 CFD

US 500 S&P INDEX MARKET TRADE SETUPS & SIGNALS For 10th Dec 2019www.youtube.com
I Publish Daily chart updates on over 49 Assets including Forex pairs, Indices, Commodities, Metals, Cryptos and more. Watch them via the above link

JPN225: Nikkei potentially confirming a yearly uptrend soon...The Nikkei has been in an insane climb lately, and Japan as a whole, has been presenting more attractive valuations overall, than US or Europe stocks. Personally, I'm long EM equities, and some US ones, but, Japan does have a valid uptrend in the intermediate term, and soon in the long term as well. One concern you may have is mainly demographic, if you factor in the population aging, which could contribute to a slow down of growth over the long haul, as well as potential geopolitical risks, being so darn close to 'Rocket man'. Talking of Rocket man, did you know there was a Megaman prototype game called like that, before it was called Rockman X in Japan? I didn't either: www.youtube.com
Funny stories aside, wether Trump is a Megaman fan or not, this is a significantly interesting chart to monitor for bullish setups in select japanese equities.
Best of luck,
Ivan Labrie.

Nikkei USDJPY ratio at a very significant levelTVC:NI225/USDJP is at the same level it was in 1991,1995,1997,2018. The horiztontal trendline extends from 1990-2019 nearly 30 years. A closing above this trendline on a monthly basis will signal a bullish scenario in the Japanese stock market in my opinion.

USDJPY SHORTShort USDJPY with break of multi-week trend line. JPN225 retracing sharply from 2019 high.


Nikkei 225 Japanese supply and demand forecastNikkei 225 Japanese Index has been rallying for a few weeks creating new strong weekly demand imbalances. Nikkei 225 index has unfortunately not retraced yet to any of these two strong weekly imbalances and continues to rally on its way to weekly supply imbalance around 23600.
Nikkei 225 Japanese Index futures forecast. As per the weekly timeframe analysis, Nikkei 225 Index futures is in a clear uptrend creating new weekly demand imbalances at 21850 and lower at 20570. Nikkei tried to correct and reached bottom weekly demand level but it just couldn’t and kept on rallying ending up creating another strong weekly demand imbalance around 21850.
Long term long bias on Nikkei index. This is the kind of price action technical analysis you will learn in our trading community. You will learn how to locate new supply and demand imbalances and trade without using any indicators, no news, no fundamental analysis, no earnings announcements, no volume or VSA analysis. Just supply and demand imbalances.
Trading supply and demand imbalances is ideal for beginners and those with a full or half time job, you won’t need to stay in front of the computer all day long trying to move price action with your mind.


JP225 is going according to planAs I have published before that JP225 will be moving up in the next coming weeks, it has broken resistance and it is currently playing around the consolidation area highlighted in red as a zone. I am expecting it to drop to support before it can shoot up. Similarly, if it breaks support, `I am looking for a retest before I can take it down as a sell.

Brexit Catalyst for Equity Trade?Before I get into the trade idea, I need to preface that I still believe that US equities will be going higher in the longer term. Not really for any fundamental reasons, but more so that the world is in a bad place and the US looks the best, albeit having a lot of problems. Martin Armstrong calls the US and the US Dollar the prettiest sister out of the three ugly sisters.
Also, there will be nowhere to go for yield. We know QE (or QE but not calling it QE is coming) and interest rates will be dropping to 0 because central banks are out of options. Check out my posts linked below where I talk about all these things...predictions are coming true and we are truly in the reset/crisis.
With rates at 0, we are at the 'paradigm shift' environment that Ray Dalio has spoken about. Bonds are now being traded not for yield but to sell to another bigger fool. Real Estate historically goes up once the first rate hike occurs. You do not take a mortgage out when you know rates will be dropping lower later.
Stocks will be the only place for yield and not only that, the liquidity in this type of macro environment will be appealing. You can get in and get out relatively quickly.
So onto the short TRADE idea. Markets are still being affected by geopolitical and other uncertainties. This will affect equities in the short term, but again, as a fund manager money has to be deployed. You cannot hold cash for a long time. This money will go to work and I predict it will go into stocks for the yield factor described above.
We found out today at time of writing this idea that Brexit will be delayed until January.
I have mentioned how Brexit will likely not happen. It will keep getting delayed and we may very well see a re-vote. There are 3 reasons why Brexit will likely not happen:
1) The British politicians who are part of the European Parliament lose their 6 figure jobs and pensions. Not in their best interest to leave.
2) There will be a European economic/debt crisis. The German taxpayer will not be able to bail out Europe all by themselves. The British tax payer will be required to help.
3) Most importantly, Brexit sets a precedent. European nations like Greece, Spain, Italy and Portugal may get inspired by a deal.
Anyhow, the charts are setting up nicely for a move lower. We have been in an uptrend, with higher highs and higher lows, and then price began to stall at a resistance/flip zone or in some cases near all time highs.
For the SPX, we are seeing an exhaustion it appears. Would ideally like to see a break below this flip zone with a pattern like a head and shoulders.
The Nasdaq already had the break. Would like to see a retest with a confirmed lower high and lower low. Nice strong break.
The Nikkei is showing signs of a trend exhaustion here. Need to see if we get the break.
The China 50 already had the break. Awaiting for another swing (lower high).
The German Dax is at a crucial resistance/flip zone that you can see on the daily chart. Showing signs of exhaustion and potential reversal here.
We should cover the FTSE as well, but honestly, no real good pattern/set up for me on the lower time frames. The Daily still has a crucial level below.


Elliott Wave View: Nikkei Buyers in ControlNikkei shows Elliott Wave bullish sequence from December 26, 2018 low and August 26, 2019 low. This suggests that buyers are in control and favors further upside in the Index. The pullback to 21079 ended wave ((2)) and the Index has resumed higher in wave ((3)). Internal subdivision of wave ((3)) takes the form of a 5 waves impulse Elliott Wave structure.
Wave (1) of ((3)) is currently in progress as a leading diagonal. Up from 21079, wave 1 ended at 21650, wave 2 ended at 21325, wave 3 ended at 22265, and wave 4 ended at 21905. Expect Index to soon complete wave 5 of (1). Afterwards, Index should pullback in wave (2) to correct the cycle from October 3 low before the rally resumes. We don’t like selling the Index and expect buyers to appear in the sequence of 3, 7, or 11 swing as far as pivot at 21079 low stays intact.

NI225short for a pullback near the resistance then Macd is in a good momentum (MONTHLY bullish divergence)

short #nikkei #japan225 22000 and target 21785much overbought and pschological level
215 pts easy in short time trade


JPN225We believe that JPN225 is stalling on the 4HR timeframe, and is preparing for a large 200-period drop.
Follow us for more trading analyses.

JP225 has entered a zone consolidationBased on previous price action movement, I can drew points of consolidation and now it looks like JP225 will be in consolidation mode before reaching resistance. A possible move long if it doesn't break the minor support.

Elliott Wave View: Impulsive Rally in NikkeiElliott Wave view suggests the rally in Nikkei from August 26, 2019 low is unfolding as an impulse Elliott Wave structure. In the 1 hour chart below, the rally to 21890 on September 13, 2019 ended wave (3) and wave (4) pullback. Internal of wave (3) unfolded as an impulse in lesser degree. Wave 1 of (3) ended at 20800 and wave 2 of (3) ended at 20416. Up from there, wave 3 of (3) ended at 21455, wave 4 of (3) ended at 21295, and wave 5 of (3) ended at 22095.
Near term, the cycle is mature and thus it’s risky to chase the rally at this stage. However, while near term pullback stays above 21800, further upside can’t be ruled out within wave (5).

Short JPN225 @ 21,956; TP @ 21,077, SL your choiceShort JPN225 @ 21,956; TP @ 21,077, SL your choice

JPN225 (abc) pattern shaping up?While I'm no Elliott wave guru by any means... makes sense to me. US indices have similar chart patterns i.e. abc type patterns.

Nikkei Break Out Nearing?Our Dax and ESP 35 trades are continuing as mentioned in previous posts. It seems cheap money and easing will keep stocks propped as there will be nowhere to go for yield. Of course, a geopolitical issue or black swan event can nullify this...and I believe there will be a confidence crisis approaching.
However, we will deal with that when it appears and the bond market will give us the signal for this.
I like what I see here on the Nikkei. A nice downtrend with basing/range. You can say a cup and handle pattern too. Let us await for a break above this resistance one.
Other confluences fake out candles and engulfing candles at the major support below, indicating that we may have shown 2/3 market moves (downtrend and range).

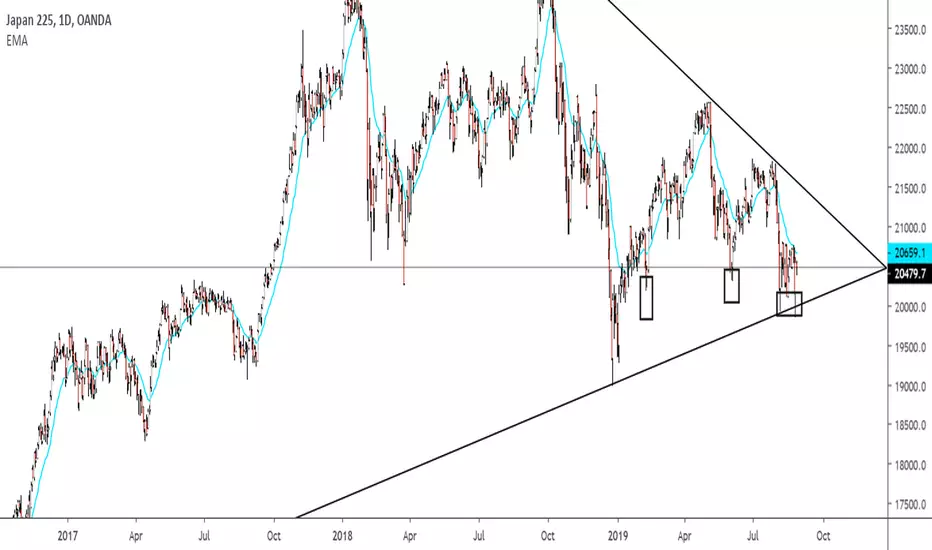
Nikkei Demand Wearing ThinA significant level of support (20500) is again being tested... The biggest test the level has had so far.
Up to now every test of the 20500 level has seen a quick 'touch and go' reaction, where supply has very quickly hit demand (waiting buy orders) and price has bounced away with strong momentum.
This time looks very different and suggests that the demand in this area is wearing thin, with sellers having their best chance so far of breaking through this level... If a breakdown in demand does come through and we see a daily close below the current congestion, then expect a swift retest as resistance before dropping to the low of December around 19000.
If the level is able to hold and we start to see some strength in the OBV, pushing positively away from its 20ema then price will meet some heavy resistance at the top of this current triangle.
I expect this to all play out over the next few days and will be heavily influenced by any Trump Tweets and US-Sino trade talk headlines.