Potential bullish rise?AUD/JPY has reacted off the pivot and could rise to the 1st resistance which acts as an overlap resistance.
Pivot: 96.89
1st Support: 95.68
1st Resistance: 98.01
Risk Warning:
Trading Forex and CFDs carries a high level of risk to your capital and you should only trade with money you can afford to lose. Trading Forex and CFDs may not be suitable for all investors, so please ensure that you fully understand the risks involved and seek independent advice if necessary.
Disclaimer:
The above opinions given constitute general market commentary, and do not constitute the opinion or advice of IC Markets or any form of personal or investment advice.
Any opinions, news, research, analyses, prices, other information, or links to third-party sites contained on this website are provided on an "as-is" basis, are intended only to be informative, is not an advice nor a recommendation, nor research, or a record of our trading prices, or an offer of, or solicitation for a transaction in any financial instrument and thus should not be treated as such. The information provided does not involve any specific investment objectives, financial situation and needs of any specific person who may receive it. Please be aware, that past performance is not a reliable indicator of future performance and/or results. Past Performance or Forward-looking scenarios based upon the reasonable beliefs of the third-party provider are not a guarantee of future performance. Actual results may differ materially from those anticipated in forward-looking or past performance statements. IC Markets makes no representation or warranty and assumes no liability as to the accuracy or completeness of the information provided, nor any loss arising from any investment based on a recommendation, forecast or any information supplied by any third-party.
Jpy

Potential bullish rise?AUD/JPY has reacted off the support level which is an overlap support and could rise from this level to our take profit.
Entry: 96.73
Why we like it:
There is an overlap support level.
Stop loss: 96.63
Why we like it"
There is a pullback support level.
Take profit: 98.06
Why we like it:
there is an overlap resistance level that is slightly above the 50% Fibonacci retracement.
Enjoying your TradingView experience? Review us!
Please be advised that the information presented on TradingView is provided to Vantage (‘Vantage Global Limited’, ‘we’) by a third-party provider (‘Everest Fortune Group’). Please be reminded that you are solely responsible for the trading decisions on your account. There is a very high degree of risk involved in trading. Any information and/or content is intended entirely for research, educational and informational purposes only and does not constitute investment or consultation advice or investment strategy. The information is not tailored to the investment needs of any specific person and therefore does not involve a consideration of any of the investment objectives, financial situation or needs of any viewer that may receive it. Kindly also note that past performance is not a reliable indicator of future results. Actual results may differ materially from those anticipated in forward-looking or past performance statements. We assume no liability as to the accuracy or completeness of any of the information and/or content provided herein and the Company cannot be held responsible for any omission, mistake nor for any loss or damage including without limitation to any loss of profit which may arise from reliance on any information supplied by Everest Fortune Group.

Bullish bounce?CAD/JPY is falling towards the pivot which acts as a pullback support and could bounce to the 1st resistance.
Pivot: 105.77
1st Support: 104.88
1st Resistance: 108.47
Risk Warning:
Trading Forex and CFDs carries a high level of risk to your capital and you should only trade with money you can afford to lose. Trading Forex and CFDs may not be suitable for all investors, so please ensure that you fully understand the risks involved and seek independent advice if necessary.
Disclaimer:
The above opinions given constitute general market commentary, and do not constitute the opinion or advice of IC Markets or any form of personal or investment advice.
Any opinions, news, research, analyses, prices, other information, or links to third-party sites contained on this website are provided on an "as-is" basis, are intended only to be informative, is not an advice nor a recommendation, nor research, or a record of our trading prices, or an offer of, or solicitation for a transaction in any financial instrument and thus should not be treated as such. The information provided does not involve any specific investment objectives, financial situation and needs of any specific person who may receive it. Please be aware, that past performance is not a reliable indicator of future performance and/or results. Past Performance or Forward-looking scenarios based upon the reasonable beliefs of the third-party provider are not a guarantee of future performance. Actual results may differ materially from those anticipated in forward-looking or past performance statements. IC Markets makes no representation or warranty and assumes no liability as to the accuracy or completeness of the information provided, nor any loss arising from any investment based on a recommendation, forecast or any information supplied by any third-party.

USDJPY Channel Up bottomed. Very strong BUY.USDJPY is trading inside a Channel Up and the price is starting to recover from November's bearish wave correction.
It has already crossed above the MA50 (4h) and only the MA200 (4h) remains to confirm the trend shift.
Trading Plan:
1. Buy after the price crosses above the MA200 (4h).
Targets:
1. 162.500 (top of the Channel Up and under the 2.0 Fibonacci extension).
Tips:
1. The RSI (4h) is printing a cup into Channel Up pattern, identical to the previous Low of the Channel Up. An additional buy signal.
Please like, follow and comment!!

NZDJPY to turnaround?NZDJPY - 24h expiry
Although the bears are in control, the stalling negative momentum indicates a turnaround is possible.
The selloff is close to an exhaustion count on the daily chart.
Price action looks to be forming a bottom.
Bespoke support is located at 87.80.
Risk/Reward would be poor to call a buy from current levels.
We look to Buy at 87.80 (stop at 87.30)
Our profit targets will be 89.00 and 89.25
Resistance: 89.00 / 89.50 / 90.00
Support: 88.50 / 87.80 / 87.30
Risk Disclaimer
The trade ideas beyond this page are for informational purposes only and do not constitute investment advice or a solicitation to trade. This information is provided by Signal Centre, a third-party unaffiliated with OANDA, and is intended for general circulation only. OANDA does not guarantee the accuracy of this information and assumes no responsibilities for the information provided by the third party. The information does not take into account the specific investment objectives, financial situation, or particular needs of any particular person. You should take into account your specific investment objectives, financial situation, and particular needs before making a commitment to trade, including seeking advice from an independent financial adviser regarding the suitability of the investment, under a separate engagement, as you deem fit.
You accept that you assume all risks in independently viewing the contents and selecting a chosen strategy.
Where the research is distributed in Singapore to a person who is not an Accredited Investor, Expert Investor or an Institutional Investor, Oanda Asia Pacific Pte Ltd (“OAP“) accepts legal responsibility for the contents of the report to such persons only to the extent required by law. Singapore customers should contact OAP at 6579 8289 for matters arising from, or in connection with, the information/research distributed.

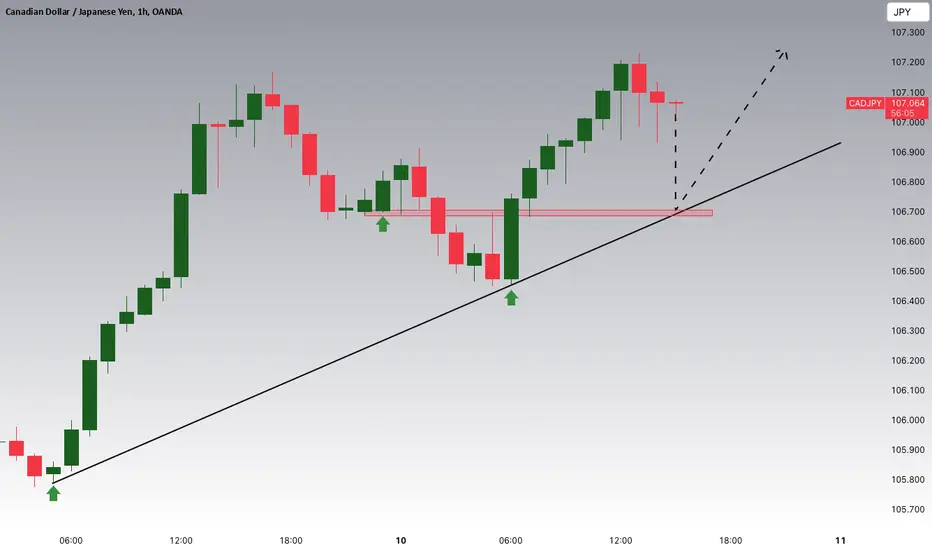
CADJPY Potential UpsidesHey Traders, in today's trading session we are monitoring CADJPY for a buying opportunity around 106.700 zone, CADJPY is trading in an uptrend and currently is in a correction phase in which it is approaching the trend at 106.700 support and resistance area.
Trade safe, Joe.
USD/JPY - Bullish Momentum in Action!Following yesterday's shared analysis, USD/JPY has aligned perfectly with the expected bullish scenario:
- 15-Minute Chart Breakdown:
- The structure shifted, transitioning from bearish to bullish as the market began forming higher highs and higher lows .
- After the structure shift, the price entered a reaccumulation phase , consolidating before the next impulse move.
- Indicator Precision:
- The WiseOwl Indicator identified a high-probability entry signal at the right moment, during the reaccumulation phase, allowing us to capitalize on the bullish trend.
- The trade has shown minimal drawdown and is now trending in profits.
- Outlook:
As long as the market respects the bullish structure, we anticipate continued momentum to the upside.
Key Takeaway:
This trade showcases the importance of combining **structure analysis** with precision tools like the WiseOwl Indicator to maximize opportunities in trending markets.

USDJPY has reached key resistance Intraday Update: The USDJPY has bounced back to the 38% retracement of the Nov 14th high to Dec 3rd low. The 152.00 level has been a massive pivot since Oct 2022, so the 151.80 level (38%) may offer strong resistance (or just above) today.

NZDJPY - NEW BREAKOUTHello Traders !
On Monday 9 Dec, The NZDJPY Reached the support level (86.273 - 87.020).
The price failed to create a new lower low !
The last lower high is broken (Choch).
So, I predict a bullish move📈
_____________
TARGET: 89.820🎯

Bearish reversal off 50% Fibonacci resistance?EUR/JPY is rising towards the resistance level which is an overlap resistance that lines up with the 50% Fibonacci retracement and could drop from this level to our take profit.
Entry: 160.40
Why we like it:
There is an overlap resistance level that lines up with the 50% Fibonacci retraecment.
Stop loss: 161.95
Why we like it:
There is a pullback resistance level that is slightly above the 61.8% Fibonacci retracement.
Take profit: 157.93
Why we like it:
There is an overlap support level.
Enjoying your TradingView experience? Review us!
Please be advised that the information presented on TradingView is provided to Vantage (‘Vantage Global Limited’, ‘we’) by a third-party provider (‘Everest Fortune Group’). Please be reminded that you are solely responsible for the trading decisions on your account. There is a very high degree of risk involved in trading. Any information and/or content is intended entirely for research, educational and informational purposes only and does not constitute investment or consultation advice or investment strategy. The information is not tailored to the investment needs of any specific person and therefore does not involve a consideration of any of the investment objectives, financial situation or needs of any viewer that may receive it. Kindly also note that past performance is not a reliable indicator of future results. Actual results may differ materially from those anticipated in forward-looking or past performance statements. We assume no liability as to the accuracy or completeness of any of the information and/or content provided herein and the Company cannot be held responsible for any omission, mistake nor for any loss or damage including without limitation to any loss of profit which may arise from reliance on any information supplied by Everest Fortune Group.

Heading into 50% Fibonacci resistance?EUR/JPY is rising towards the pivot and could reverse to the 1st support which acts as an overlap support.
Pivot: 160.59
1st Support: 157.98
1st Resistance: 162.16
Risk Warning:
Trading Forex and CFDs carries a high level of risk to your capital and you should only trade with money you can afford to lose. Trading Forex and CFDs may not be suitable for all investors, so please ensure that you fully understand the risks involved and seek independent advice if necessary.
Disclaimer:
The above opinions given constitute general market commentary, and do not constitute the opinion or advice of IC Markets or any form of personal or investment advice.
Any opinions, news, research, analyses, prices, other information, or links to third-party sites contained on this website are provided on an "as-is" basis, are intended only to be informative, is not an advice nor a recommendation, nor research, or a record of our trading prices, or an offer of, or solicitation for a transaction in any financial instrument and thus should not be treated as such. The information provided does not involve any specific investment objectives, financial situation and needs of any specific person who may receive it. Please be aware, that past performance is not a reliable indicator of future performance and/or results. Past Performance or Forward-looking scenarios based upon the reasonable beliefs of the third-party provider are not a guarantee of future performance. Actual results may differ materially from those anticipated in forward-looking or past performance statements. IC Markets makes no representation or warranty and assumes no liability as to the accuracy or completeness of the information provided, nor any loss arising from any investment based on a recommendation, forecast or any information supplied by any third-party.

Could the price reverse from here?GBP/JPY is rising towards the pivot which has been identified as a pullback resistance and could drop to the 1st support.
Pivot: 193.43
1st Support: 191.15
1st Resistance: 194.64
Risk Warning:
Trading Forex and CFDs carries a high level of risk to your capital and you should only trade with money you can afford to lose. Trading Forex and CFDs may not be suitable for all investors, so please ensure that you fully understand the risks involved and seek independent advice if necessary.
Disclaimer:
The above opinions given constitute general market commentary, and do not constitute the opinion or advice of IC Markets or any form of personal or investment advice.
Any opinions, news, research, analyses, prices, other information, or links to third-party sites contained on this website are provided on an "as-is" basis, are intended only to be informative, is not an advice nor a recommendation, nor research, or a record of our trading prices, or an offer of, or solicitation for a transaction in any financial instrument and thus should not be treated as such. The information provided does not involve any specific investment objectives, financial situation and needs of any specific person who may receive it. Please be aware, that past performance is not a reliable indicator of future performance and/or results. Past Performance or Forward-looking scenarios based upon the reasonable beliefs of the third-party provider are not a guarantee of future performance. Actual results may differ materially from those anticipated in forward-looking or past performance statements. IC Markets makes no representation or warranty and assumes no liability as to the accuracy or completeness of the information provided, nor any loss arising from any investment based on a recommendation, forecast or any information supplied by any third-party.

Overlap resistance ahead?USD/JPY is rising towards the pivot and could reverse to the 1st support which acts as a pullback support.
Pivot: 151.83
1st Support: 149.63
1st Resistance: 153.43
Risk Warning:
Trading Forex and CFDs carries a high level of risk to your capital and you should only trade with money you can afford to lose. Trading Forex and CFDs may not be suitable for all investors, so please ensure that you fully understand the risks involved and seek independent advice if necessary.
Disclaimer:
The above opinions given constitute general market commentary, and do not constitute the opinion or advice of IC Markets or any form of personal or investment advice.
Any opinions, news, research, analyses, prices, other information, or links to third-party sites contained on this website are provided on an "as-is" basis, are intended only to be informative, is not an advice nor a recommendation, nor research, or a record of our trading prices, or an offer of, or solicitation for a transaction in any financial instrument and thus should not be treated as such. The information provided does not involve any specific investment objectives, financial situation and needs of any specific person who may receive it. Please be aware, that past performance is not a reliable indicator of future performance and/or results. Past Performance or Forward-looking scenarios based upon the reasonable beliefs of the third-party provider are not a guarantee of future performance. Actual results may differ materially from those anticipated in forward-looking or past performance statements. IC Markets makes no representation or warranty and assumes no liability as to the accuracy or completeness of the information provided, nor any loss arising from any investment based on a recommendation, forecast or any information supplied by any third-party.

AUDJPY Potential DownsidesHey Traders, in today's trading session we are monitoring AUDJPY for a selling opportunity around 98.800 zone, AUDJPY is trading in a downtrend and currently is in a correction phase in which it is approaching the trend at 98.800 support and resistance area.
Trade safe, Joe.

#USDJPY Taking a closer look at the USD/JPY pair on the 1-hour timeframe, the current price action highlights a significant area of interest that could dictate the next move in the market. The momentum appears to be building around this key zone, offering potential opportunities for both intraday traders looking for quick gains and scalpers aiming to capitalize on shorter movements. Whether it leads to a breakout or a reversal will depend on how the price interacts with these critical levels, making patience and confirmation essential for executing a well-timed and calculated trade.

Bearish drop?USD/JPY has reacted off the pivot which is an overlap resistance and drop from this level to the pullback support.
Pivot: 151.88
1st Support: 147.20
1st Resistance: 154.70
Risk Warning:
Trading Forex and CFDs carries a high level of risk to your capital and you should only trade with money you can afford to lose. Trading Forex and CFDs may not be suitable for all investors, so please ensure that you fully understand the risks involved and seek independent advice if necessary.
Disclaimer:
The above opinions given constitute general market commentary, and do not constitute the opinion or advice of IC Markets or any form of personal or investment advice.
Any opinions, news, research, analyses, prices, other information, or links to third-party sites contained on this website are provided on an "as-is" basis, are intended only to be informative, is not an advice nor a recommendation, nor research, or a record of our trading prices, or an offer of, or solicitation for a transaction in any financial instrument and thus should not be treated as such. The information provided does not involve any specific investment objectives, financial situation and needs of any specific person who may receive it. Please be aware, that past performance is not a reliable indicator of future performance and/or results. Past Performance or Forward-looking scenarios based upon the reasonable beliefs of the third-party provider are not a guarantee of future performance. Actual results may differ materially from those anticipated in forward-looking or past performance statements. IC Markets makes no representation or warranty and assumes no liability as to the accuracy or completeness of the information provided, nor any loss arising from any investment based on a recommendation, forecast or any information supplied by any third-party.

Sell USD/JPY Channel BreakoutThe USD/JPY pair on the M30 timeframe presents a potential selling opportunity due to a recent downward breakout from a well-defined Channel pattern. This suggests a shift in momentum towards the downside in the coming Hours. OANDA:USDJPY
Key Points:
Sell Entry: Consider entering a short position around close to the breakout level. This offers an entry point near the perceived shift in momentum.
Target Levels:
1st Support – 148.82
2nd Support – 148.18
Your likes and comments are incredibly motivating and will encourage me to share more analysis with you.
Best Regards, KABHI FOREX TRADING
Thank you.

NZDJPY Offer Shorting OpportunitiesNZD/JPY remains in a bearish structure, rejecting key resistance near 88.88 and 89.98.
Sellers appear dominant, with the possibility of a retracement to trap liquidity before resuming the downtrend.
The next significant target lies at 86.60, a critical support level that aligns with previous demand.
The pair's bearish momentum suggests rallies may offer shorting opportunities.
This setup highlights patience in waiting for a retracement before positioning for a bearish continuation.
A clean break below 86.60 could unlock further downside potential.

Sell GBP/JPY Channel BreakoutThe GBP/JPY pair on the M30 timeframe presents a potential selling opportunity due to a recent downward breakout from a well-defined Channel pattern. This suggests a shift in momentum towards the downside in the coming Hours. FX:GBPJPY
Key Points:
Sell Entry: Consider entering a short position around close to the breakout level. This offers an entry point near the perceived shift in momentum.
Target Levels:
1st Support – 188.85
2nd Support – 187.55
Your likes and comments are incredibly motivating and will encourage me to share more analysis with you.
Best Regards, KABHI FOREX TRADING
Thank you.

USDJPY: Technical buy opportunity on RSI fractal.USDJPY turned bearish on its 1D technical outlook (RSI = 41.175, MACD = -0.460, ADX = 31.807) as it crossed under its 1D MA50 and has failed to recover it this week. Yet, this is technically a buy opportunity in disguise as this is the exact same pattern that the price did on the March 24th 2023 Low. After the initial bullish wave start of the long term Channel Up, the price pulled back again and formed that low with the RSI at 37.000. This is the level it is right now as well. We expect the bullish wave to resume the uptrend like it did then. We are again targeting the 1.786 Fibonacci extension, only a bit lower on the R1 level (TP = 161.870).
See how our prior idea has worked out:
## If you like our free content follow our profile to get more daily ideas. ##
## Comments and likes are greatly appreciated. ##

AUDJPY - NEW BREAKOUTHello Traders !
After a huge bearish move,
The AUDJPY price broke the support level (98.028 - 98.443).
This key level becomes a new resistance level !
So, I expect a bearish move 📉
________________
TARGET: 94.940🎯

Bullish bounce off overlap support?USD/JPY is falling towards the pivot which has been identified as an overlap support and could bounce to he 1st resistance which acts as an overlap resistance.
Pivot: 148.97
1st Support: 147.24
1st Resistance: 151.24
Risk Warning:
Trading Forex and CFDs carries a high level of risk to your capital and you should only trade with money you can afford to lose. Trading Forex and CFDs may not be suitable for all investors, so please ensure that you fully understand the risks involved and seek independent advice if necessary.
Disclaimer:
The above opinions given constitute general market commentary, and do not constitute the opinion or advice of IC Markets or any form of personal or investment advice.
Any opinions, news, research, analyses, prices, other information, or links to third-party sites contained on this website are provided on an "as-is" basis, are intended only to be informative, is not an advice nor a recommendation, nor research, or a record of our trading prices, or an offer of, or solicitation for a transaction in any financial instrument and thus should not be treated as such. The information provided does not involve any specific investment objectives, financial situation and needs of any specific person who may receive it. Please be aware, that past performance is not a reliable indicator of future performance and/or results. Past Performance or Forward-looking scenarios based upon the reasonable beliefs of the third-party provider are not a guarantee of future performance. Actual results may differ materially from those anticipated in forward-looking or past performance statements. IC Markets makes no representation or warranty and assumes no liability as to the accuracy or completeness of the information provided, nor any loss arising from any investment based on a recommendation, forecast or any information supplied by any third-party.

Bullish bounce?GBP/JPY is falling towards the pivot which acts as an overlap support that lines up with the 50% Fibonacci retracement and could bounce to the pullback resistance.
Pivot: 190.24
1st Support: 188.47
1st Resistance: 192.31
Risk Warning:
Trading Forex and CFDs carries a high level of risk to your capital and you should only trade with money you can afford to lose. Trading Forex and CFDs may not be suitable for all investors, so please ensure that you fully understand the risks involved and seek independent advice if necessary.
Disclaimer:
The above opinions given constitute general market commentary, and do not constitute the opinion or advice of IC Markets or any form of personal or investment advice.
Any opinions, news, research, analyses, prices, other information, or links to third-party sites contained on this website are provided on an "as-is" basis, are intended only to be informative, is not an advice nor a recommendation, nor research, or a record of our trading prices, or an offer of, or solicitation for a transaction in any financial instrument and thus should not be treated as such. The information provided does not involve any specific investment objectives, financial situation and needs of any specific person who may receive it. Please be aware, that past performance is not a reliable indicator of future performance and/or results. Past Performance or Forward-looking scenarios based upon the reasonable beliefs of the third-party provider are not a guarantee of future performance. Actual results may differ materially from those anticipated in forward-looking or past performance statements. IC Markets makes no representation or warranty and assumes no liability as to the accuracy or completeness of the information provided, nor any loss arising from any investment based on a recommendation, forecast or any information supplied by any third-party.
