USD increased slightly and JPY decreased deeplyThe world USD price increased slightly. The USD-Index reached 98.79 points, 0.08 points higher than yesterday. According to CNBC, the USD increased in value compared to most currencies as the market focused on President Donald Trump's personnel nomination for the US Federal Reserve (Fed). Yesterday, President Donald Trump said he would soon announce decisions on replacing Governor Adriana Kugler, who resigned last Friday, including choosing the next Fed chair. Fed Chair Jerome Powell's term will end in May 2026.
Yesterday's report from the Institute for Supply Management said that the US non-manufacturing purchasing managers' index (PMI) in July fell to 50.1 from 50.8 in June. Economists polled by Reuters had forecast the services PMI would increase to 51.5. A PMI reading above 50 indicates growth in the services sector, which accounts for more than two-thirds of the economy. Investors are pricing in a high probability that the Fed will cut interest rates at its September meeting. Investment bank Goldman Sachs expects the Fed to deliver three consecutive 0.25% rate cuts starting in September...
JPYUSD
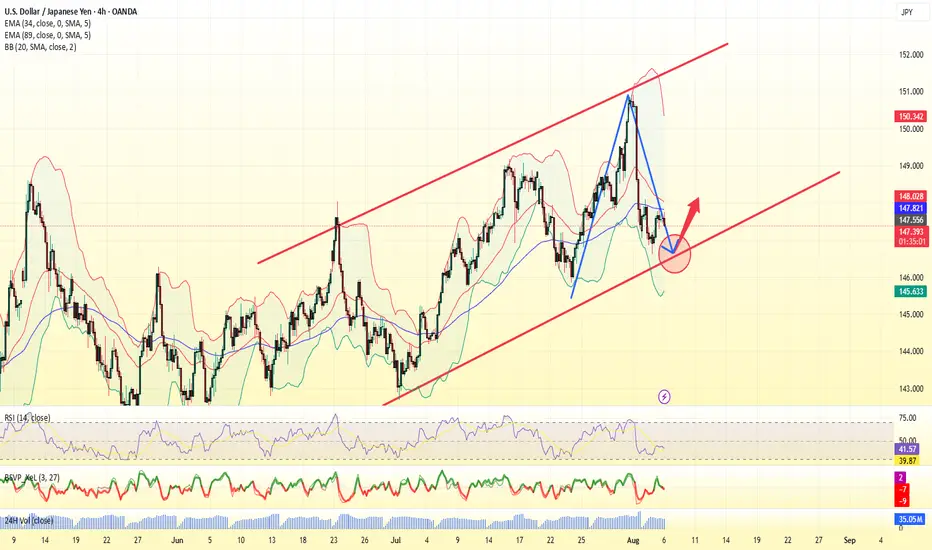
USD/JPY – Short-term bullish structure within a larger downtrendThe USD/JPY pair has been in a well-established downtrend on the daily timeframe, showing consistent weakness over recent weeks.
Daily timeframe
The pair recently bounced from a significant and well-respected support zone around the $140.00 level. This area has historically provided a strong base for price, and once again, it appears to be holding as reliable support. Although the overall daily trend remains bearish, this bounce introduces the potential for a short-term retracement or consolidation phase.
Clear Rising Trendline on the 4H Chart
Zooming into the 4-hour timeframe, the price action shows a notable shift in momentum. A clear rising trendline has formed, acting as a dynamic support level and guiding the pair higher in the short term. As long as this trendline remains intact and unbroken, the bullish bias on the 4H remains valid. This upward move suggests a corrective phase within the broader daily downtrend, supported by increasing demand at higher lows.
Approaching Key Resistance — FVG and 0.786 Fibonacci Level
The pair is currently approaching a key resistance area near the $145.50 level. This zone aligns with the 4-hour Fair Value Gap (FVG) left by the previous strong downward move and coincides with the 0.786 Fibonacci retracement level, measured from the most recent swing high to swing low. A few days ago, price action briefly tested the lower boundary of this FVG but failed to fully fill the imbalance. Given the current momentum, another attempt to fill the entire FVG and test the 0.786 Fibonacci level is likely. This confluence of technical factors creates a strong resistance zone that could trigger significant price reactions, potentially resuming the broader downtrend.
Target Levels — Where to Look for Reversal or Profit-Taking
A sensible short-term target would be the previous lower high around the $144.00 level. This zone may serve as an initial resistance or take-profit area before price challenges the $145.50 resistance region. Additionally, if the pair breaks below the rising trendline on the 4H, this $144.00 zone could become a support level from which the pair might attempt another move higher.
Conclusion
To summarize, the USD/JPY pair remains in a broader daily downtrend but has shown signs of short-term strength after bouncing from the $140.00 support zone. On the 4-hour timeframe, bullish momentum is evident, supported by a rising trendline and upward movement toward a significant resistance area. Traders should closely watch the $145.50 zone, as it represents a confluence of the FVG and 0.786 Fibonacci retracement — both of which could act as a strong ceiling for price. Until the rising trendline breaks, the short-term outlook remains cautiously bullish, but the medium-term bias leans bearish if resistance holds and selling pressure resumes.
Disclosure: I am part of Trade Nation's Influencer program and receive a monthly fee for using their TradingView charts in my analysis.
Thanks for your support.
- Make sure to follow me so you don't miss out on the next analysis!
- Drop a like and leave a comment!

JPYUSD Smart Money VIP Analysis – Eyeing High-Probability Target📈 Market Context:
The JPYUSD (Japanese Yen vs. US Dollar) is currently navigating through a critical structure phase where price is reacting to previously established institutional zones. Recent price movements reveal a clean and structured setup — one that aligns perfectly with Smart Money Concepts (SMC) and CHoCH (Change of Character) theory.
This 2H chart provides a roadmap for anticipating the next high-probability reversal, giving traders an edge in both short-term scalps and mid-term swing trades.
🔍 In-Depth Chart Analysis:
🧱 Resistance Zone (0.007020–0.007040):
This area has been tested multiple times in the past and acted as a strong supply zone. Institutional orders have previously caused significant bearish pressure from this level. Unless a strong bullish breakout occurs with volume, this zone is likely to hold again.
🔁 Next Reversal Zone (0.006975–0.006985):
Price is currently climbing from the SR Interchange Zone, heading toward this marked reversal area. Here's why this zone matters:
Confluence of past resistance and imbalance
Potential liquidity sweep above minor highs
Perfect setup for a bearish reaction to form a lower high
Traders should watch for signs of weak bullish candles, wicks, or a bearish engulfing here.
🔄 SR Interchange (Support-Resistance Flip):
This level held firm, showing buyer interest after a previous structure break. It signals a healthy correction phase — a typical SMC signature before larger moves occur. The market is offering a retracement opportunity.
🟡 CHoCH Zones:
Minor CHoCH (0.006900): A break and close below this level would invalidate bullish correction and confirm the shift in momentum.
Major CHoCH (0.006840): The final confirmation of bearish dominance. A breach here opens the door for new lows, targeting long-term support areas.
⚔️ Smart Money Playbook:
Current Move: Price is in bullish retracement from previous demand zone
Watch Zone: 0.006975–0.006985 (Potential Smart Money sell zone)
Reaction Setup:
Bearish structure forms (e.g., M pattern, liquidity sweep, bearish engulfing)
Price breaks minor CHoCH
Sell Entry: After confirmation, with stops above reversal zone
TP1: SR Interchange level
TP2: Major CHoCH zone
📅 Fundamental Triggers Ahead:
Watch for upcoming USD economic data (CPI, PPI, interest rate decisions) between June 11–14, which could act as catalysts for volatility and confirm technical setups.
🧠 Educational Note:
This setup is a classic example of market structure shift, liquidity engineering, and order block theory — concepts used by banks and smart money traders. Retail traders often get trapped on the wrong side of these zones. Your edge lies in anticipating the trap, not reacting to it.
🎯 Conclusion:
JPYUSD is offering a textbook Smart Money setup. The current retracement gives an opportunity to position early into a likely bearish continuation, provided structure confirms at the next reversal zone. Patience, discipline, and precise timing will be key to capitalizing on this move.

Japanese Yen to Da Moon!I compared the yen to every single currency pair and USDJPY is the most volatile. BOJ will raise interest rates to 0.75%-1% by late 2025/early 2026. And IF the FED chooses to lower rates that will further exacerbate Yen strength.
103.156 TP, but TBH I see price breaking well past that point and yen will make new all time highs. The dollar will get desecrated across all currencies, the yen will destroy it the hardest. Most likely BTC will also peak around this same time period and youll see and end to the bull cycle and we will enter BTC bear cycle but that is beside the point.
Potential Black Swan Event: the US enters into a recessionary environment, while I dont think this is likely bc everyone is saying that, it will be possible if we see a further escalation in the Ukraine conflict or if the US chooses to enter war with Iran. War is the only situation I see potential US recession.
I predicted then yen would get dusted during COVID, now I predict yen will make never seen before gains for the next 5 years minimum. Let's see how this plays out.

JPYUSD Technical Breakdown | Inverse Head & Shoulders + Target🔍 Pattern Breakdown: Inverse Head & Shoulders (H&S)
We’ve identified a textbook Inverse Head & Shoulders pattern, a classic bullish reversal formation that often appears at the end of a downtrend. Here's how the structure played out:
Left Shoulder:
The initial drop formed a local low, followed by a short recovery, creating the first "shoulder" on the left.
Head:
A deeper push down formed the lowest point of the pattern, indicating a possible trap for sellers or exhaustion in bearish momentum. This is the "head" and the key anchor of the pattern.
Right Shoulder:
A higher low forms, showing buyers stepping in earlier and with more strength. This symmetry confirms the structure and signals a potential reversal in trend.
Neckline:
Drawn across the highs between the shoulders, this key resistance line was broken decisively, confirming the bullish pattern and triggering an upward breakout.
📌 Trendline + Retest Zone = Confluence Support
After the breakout above the neckline:
Price surged strongly, showing confidence in the reversal.
It pulled back gently to retest the neckline, which now acts as support.
This retest also aligns with the upward trendline, adding confluence — a strong signal in technical trading that increases the probability of a successful continuation move.
This zone is labeled on the chart as:
🟦 “Like a Retesting Zone After Boom” — a perfect description of what’s occurring.
🎯 Target and Resistance Zones
The price is now moving toward a major resistance zone marked between 0.007020 – 0.007060, with a target zone slightly above at 0.007080.
These zones represent historical selling pressure or supply areas. A breakout above this region would open doors to even higher levels, signaling strong bullish continuation.
📈 Why This Setup Matters (MMC Strategy Applied)
Using the Market Mapping Concept (MMC) approach, this trade idea combines:
Market structure (Inverse H&S pattern)
Momentum confirmation (strong bullish move after breakout)
Zone mapping (support/resistance confluence)
Trendline validation (clean structure with pullback respect)
This creates a well-defined trade setup with clear entry and exit logic, excellent risk-to-reward potential, and technical confirmation.
✅ Summary: Bullish Outlook With Managed Risk
Bias: Bullish continuation as long as price holds above the neckline/trendline zone.
Confirmation: Inverse H&S pattern + successful retest.
Target: 0.007060–0.007080 resistance zone.
Invalidation: Break below 0.006980 and close under trendline support.
💬 Minds Post Caption (Extended)
🔥 JPYUSD Ready to Fly? Inverse Head & Shoulders Breakout Spotted!
Clean reversal pattern (H&S) just completed with a strong neckline breakout and a perfect retest at trendline confluence. MMC analysis suggests bullish continuation toward the 0.007060+ resistance zone. Classic "retest after boom" move. Watching price action closely! 🚀📊

6J Weekly TrajectionsWe got a good lower target liquidity and a nice rejection off of 4H FVG. This is my idea on where the price will be going over the next week.

JPYUSD Weekly Analysis (MMC) – Smart Structure & Target Zones🧠 Market Sentiment & Technical Landscape
The JPYUSD currency pair has entered a decisive phase in its multi-week bullish run, driven by structural integrity, smart money behavior, and market psychology. This chart captures a strategic trade progression using the Mind Market Concept (MMC) approach — a hybrid strategy blending curve dynamics, volume imprints, and structural flow to track institutional intent.
We're seeing a powerful alignment of structure, momentum, and volume signals, all pointing to a potential high-probability completion near the upper target/reversal zone.
🔍 In-Depth Technical Breakdown
🔹 1. Curve Support Foundation – The Psychological Bedrock
At the heart of this bullish move lies the Black Mind Curve Support — a dynamic, rounded trendline support based on momentum cycles and structural lows. This curve is not arbitrary; it’s a reflection of where smart money has repeatedly absorbed sell-side liquidity before marking up the price.
Multiple rejections from this zone around 0.00640 – 0.00650 provided confirmation of intent.
The rounded nature of this curve support mimics market accumulation patterns — think of it as a “loading zone” before explosive movement.
🔹 2. Structural Breakout – A Clean Bullish Sequence
Price respected a multi-month resistance line and finally broke out in April–May 2025. The breakout wasn't just technical — it occurred after:
A liquidity sweep below the February-March higher low
A retest of the curve
A sharp bullish engulfing formation on the weekly chart
This combination confirms a high-confidence shift in market structure — transitioning from ranging accumulation to directional markup.
🔹 3. Volume Imprints – Institutional Footprints
The chart highlights a Needed Volume area — this is where previous institutional order blocks likely existed. The strong bullish move into that zone confirms:
Buyers were active and aggressive
The area served as both resistance and a breakout retest
This volume footprint now acts as a supportive launchpad, reaffirming trend continuation logic.
🔹 4. Target + Next Reversal Zone
As price continues climbing, it’s now approaching a critical confluence zone around 0.00720 – 0.00725. This zone is projected using:
Fibonacci extension of the last impulse
Measured move symmetry
Historical supply and resistance (Q3 2024 highs)
This is not just a target — it’s a high-probability reversal area. Expect:
Potential exhaustion candles
Momentum divergence
Institutional profit-taking
📊 MMC Strategy Approach – Trade Blueprint
Parameter Detail
Bias Bullish (until reversal confirmation)
Current Price ~0.00694
Buy Zone 0.00685–0.00690 (pullback entry)
Target Zone 0.00720–0.00725
Curve Support 0.00650–0.00660
Invalidation Clean break below curve or engulfing bear momentum
This MMC-based setup emphasizes patience, psychological precision, and proper confirmation for both entry and exit. The idea is to buy smart (on structure), and exit smarter (at institutional interest zones).
⚠️ Key Trader Insights
Don’t chase — wait for clean entry signals near structure (curve or trendline retest).
Use volume confirmation — don’t trade against low-volume rejections at resistance.
Watch emotional extremes — FOMO at targets often precedes reversal.
Plan for both scenarios:
Continuation → scale partial profits at target
Reversal → shift bias if bearish confirmation aligns with momentum loss
🔖 Summary Outlook
✅ Trend: Bullish continuation, respecting structure
🎯 Immediate Focus: Reaching the 0.0072 Target + Next Reversal Zone
🔄 Actionable Tip: Monitor for rejection/absorption candles in the upper blue zone
💼 Risk Management: Use curve break or engulfing reversal as an exit trigger
This setup reflects high technical confluence and fits into a longer-term institutional roadmap. Whether you're swing trading or intraday scaling within this wave — the logic remains powerful.

JPYUSD Technical Analysis | (MMC) in Play + Target🟦 1. Structure & Price Action Overview
The chart is of JPY/USD on the 2-hour timeframe, showing a clear picture of price movement over several weeks.
We see three major market phases:
Range/Resistance Phase (Left side of chart)
Uptrend Phase (Middle – rising channel)
Reversal Setup (Right side – potential bearish move forming)
📈 2. Uptrend Channel (Accumulation to Expansion Phase)
From around May 13th, price started forming higher highs and higher lows, respecting a bullish channel (light blue shaded area).
This is a classic ascending channel, often seen during a controlled uptrend where buyers are still in control but momentum is slowing.
The channel took price directly into the resistance zone (marked in purple at the top).
🚫 3. Resistance Zone Rejection (Key Supply Zone)
Once price hit the resistance zone (~0.00705), it failed to break higher.
This level had previously caused sharp drops, so it's a well-established supply zone.
Price was rejected and dropped sharply, breaking out of the ascending channel – a strong bearish signal.
🔄 4. Mirror Market Concept (MMC) – Curve Bending Pattern
After the initial drop, price attempted a bounce, but couldn't even reach previous highs.
The curved arrow labeled "Curve Bending" shows how the market is “bending” its momentum – not pushing upward anymore but turning into a reversal.
This forms the mirror of the previous rise – indicating the market is ready to “mirror” that previous bullish leg, but to the downside.
🔄 5. SR Interchange (Support Flipped Resistance)
The previous demand zone (around 0.006950–0.007000), where buyers pushed price higher during the uptrend, is now acting as resistance.
This is called an SR Flip (Support becomes Resistance) – a very reliable technical sign of trend reversal.
🎯 6. Bearish Target Projection
Based on MMC and symmetry of past movements, the chart is projecting a strong drop toward the 0.006800 support zone.
This zone is also historically significant and acted as a demand area earlier.
The black arrow and target box show this expected move, which aligns with the mirror structure.
🧩 Conclusion & Trade Plan
Bias: Strong Bearish
Confirmation : Channel break + rejection at resistance + curve bending
Trigger: Price fails to reclaim 0.00700 and breaks below 0.006930
Target: 0.006800
Invalidation : Clean break & hold above 0.007050
🛡️ Pro Tips:
Don’t just jump in — wait for bearish confirmation (like a bearish engulfing candle, or a failed retest).
Always set your SL (Stop Loss) above the resistance zone (~0.007050).
Let the setup come to you — don’t force trades.

JPY/USD Deep Analysis Using MMC – Curve Zone + Volume Burst Zone📌 Overview:
Today’s chart setup on JPY/USD demonstrates a classic Mirror Market Concept scenario, where price mimics past structure and behavior to create high-probability trade setups. We are looking at a textbook reversal with a rounded bottom forming right above a key Support Zone—signaling a strong potential move upward.
This is not just a basic support bounce. It’s a multi-layered confluence where structure, volume, and price action come together to build a strong bullish narrative.
🌀 Phase 1: The Curve Zone Support (Accumulation)
The Curve Zone Support (marked clearly on the chart) sits right above 0.006890–0.006910.
Price touched this zone multiple times without breaking it, forming higher lows—a typical sign of accumulation.
This pattern resembles a “rounded bottom” or cup shape, indicating that sellers are getting exhausted and buyers are slowly stepping in.
💡 Market Psychology: This is where smart money begins to accumulate positions, absorbing panic sellers while price coils up.
🧱 Phase 2: SR Interchange + Central Zone Reaction
Notice the SR Interchange Zone around 0.006950. Previously it acted as a resistance, but price broke above and now respects it as support.
This is a textbook SR flip, confirming that this level holds weight.
The Central Zone, formed earlier, is where a battle between bulls and bears took place. Now price is creeping back toward it.
🧠 Mirror Market Concept Insight: Market tends to repeat structure. The earlier bullish rally from the same base level is a mirrored version of what’s forming now. That’s why this concept gives us confidence in projecting future price moves.
🔊 Phase 3: Volume Burst Area – The Target Zone
We’ve marked a Volume Burst Area around 0.007040. This is where heavy buying occurred before a sharp decline.
According to MMC, these areas often act like magnets—price gravitates back toward them once demand builds up below.
If price clears the midpoint (50% retracement) around 0.006960, it opens the door for a bullish breakout toward the volume cluster.
🎯 Trade Plan Based on This Setup:
Component Details
Entry Zone 0.006920 – 0.006930 (buy zone)
Stop Loss Below 0.006890
First Target 0.006980 (mid-level reaction)
Final Target 0.007000 – 0.007040 (Volume Zone)
🧬 MMC Confluences That Make This Setup Powerful:
✅ Curve Zone Support – Foundational base for entry.
✅ SR Flip (Interchange) – Old resistance turned support.
✅ Volume Burst Area – Target based on prior aggressive moves.
✅ Structure Break – Bullish structure shift as price forms higher lows.
✅ Psychology – Accumulation turning into expansion.
🏁 Final Thoughts:
This chart is a great example of how Mirror Market Concepts can unlock the hidden patterns of the market. It’s not just technicals, it’s also about understanding how traders think and how price reflects those emotions.
When you combine curve structures, SR interchanges, and volume dynamics, you’re not guessing—you’re anticipating. If price respects this structure, this could be a clean move toward 0.007000+, offering a great risk-to-reward ratio.

USDJPY PLAN – Will FOMC Be the Next Big Catalyst?USDJPY PLAN – Will FOMC Be the Next Big Catalyst?
💬 After several sessions of sideways movement, USDJPY is showing signs of a potential breakout, supported by both technical signals and macro fundamentals. As the FOMC meeting approaches, the market is poised for a major shift — making this the perfect time to prepare actionable trade plans.
🔍 TECHNICAL ANALYSIS
Primary Trend: Short-term bullish retracement within a broader downtrend – currently testing the 200 EMA on H2.
EMAs in use: EMA13 (black), EMA34 (orange), EMA89 (red) – effective dynamic support/resistance indicators.
Key Resistance Levels:
145.35: Major confluence zone with 0.618 Fibonacci and trendline resistance.
146.11 – 147.20: Previous highs and Fibonacci extension targets.
Key Support Zones:
144.61: EMA200 acting as immediate pressure point.
143.43 – 143.02: Crucial demand zone with strong reaction expected on pullback.
🌍 MACRO & FUNDAMENTAL FACTORS
FOMC Outlook: With recent CPI data softening and labor numbers moderating, markets anticipate a hold on rates. However, any hawkish tone from Chair Powell could trigger a sharp bullish move on USDJPY.
BOJ’s Dovish Stance: The Bank of Japan remains accommodative, showing no clear intent to hike rates. This weakens the Yen and supports mid-term upward momentum for USDJPY.
Interest Rate Differentials & Carry Trade Flows continue to drive volatility and directional bias in this pair.
🎯 TRADE SETUP SUGGESTION
If price breaks and sustains above 144.61 (EMA200): look to BUY on pullback toward 144.15–144.20, targeting 145.35 and 146.11.
If price gets rejected at 145.35: consider a short-term SELL toward 144.00 – 143.43 for a corrective leg.
⚠️ STRATEGY NOTE:
Avoid entering right at the time of the FOMC release. Wait for post-event confirmation. Prioritize strong breakouts or rejections, and manage risk carefully under volatile conditions.

JPY/USD – Clean Rejection from Mini Resistance | Bearish Move🔻 1. Major & Mini Resistance Zones
Mini Resistance Zone: This is a key supply area that aligns with previous highs and recent structure points. As the price approaches this level, it tends to react due to unfilled sell orders and trapped buyers.
The chart shows a rejection from this mini resistance zone — visible through strong bearish candles. This suggests institutional selling pressure has entered the market.
Major Resistance is still untouched above, which becomes a clear invalidation level for any short bias. If price breaks and sustains above it, the bearish idea would be invalidated.
🔄 2. MMC (Mirror Market Concepts) at Work
The MMC idea is clearly illustrated. The price movement after the last major drop is mirrored on the right side:
Strong rally > Formation of lower highs > Resistance retest > Sharp decline
These mirrored behaviors often hint at psychological repetition in the market, driven by trader memory and order placement.
The bearish movement after retesting the mini resistance looks nearly identical to the previous leg on the left — reinforcing the idea that we may see a similar downside structure repeat.
🌀 3. Central Zone Area – Liquidity Trap and Reaction Point
The Central Zone Area is labeled where a previous sharp bounce occurred. This zone is critical for several reasons:
It acted as support multiple times.
It’s also where a liquidity grab occurred — shown with a long wick — before a reversal rally.
In current price action, this zone may again act as a magnet for price, as institutions seek liquidity to fuel further moves. Once price reaches it, expect a temporary bounce or reaction.
📐 4. 50% Fibonacci Retracement Confluence
The projected target sits right on the 50% retracement level of the previous bullish leg.
Institutions frequently target the 50%–61.8% Fibonacci zones to rebalance orders and create continuation moves.
This target zone is marked in purple and is aligned with historical support, adding confluence.
📉 5. Sharp Bearish Reversal from Structure
You can observe a very clear shift in momentum:
The uptrend was broken with a strong bearish engulfing candle.
That move wiped out several minor bullish structures — a sign of structure collapse.
This breakdown, combined with the resistance rejection and MMC mirroring, strongly supports a bearish continuation bias.
📊 6. Previous Targets and Structure Memory
The previous targets and historical swing points are not just annotations — they represent real zones of order flow memory.
When price revisits these levels, you often see reactions (reversals, consolidations, or continuation).
🎯 Trade Plan (Based on Chart):
Bias: Bearish
Entry Zone: After rejection confirmation at mini resistance
Target Zone: 0.00675 area (50% retracement)
Invalidation: Close above 0.00715 (Major Resistance)
✅ Conclusion:
This JPY/USD 4H chart beautifully showcases the power of technical structure, Mirror Market Concepts, and liquidity-focused trading. With a clean rejection from mini resistance, a history of mirrored bearish setups, and a confluence target at the 50% zone, this chart suggests a high-probability short opportunity for disciplined traders.

USDJPY – Diverging Policies Drive Yen into Pressure Zone near 14USDJPY – Diverging Policies Drive Yen into Pressure Zone near 144
🌍 Macro Landscape: JPY Stuck Between Two Diverging Forces
In recent weeks, the US dollar has regained strength as the Federal Reserve remains committed to its "higher-for-longer" interest rate stance. On the flip side, the Bank of Japan (BoJ) is maintaining an ultra-loose monetary policy, widening the yield spread between the USD and JPY, and putting pressure on the yen.
The surge in US 10-year yields toward 4.5% is further dampening demand for JPY as a safe haven, prompting institutional capital outflows from the yen and inflows into USD-based assets.
🏦 Central Bank Policy Divergence: Fed Remains Firm, BoJ Stays Dovish
Federal Reserve: FOMC members continue to signal patience on rate cuts. Recent inflation data (PCE, CPI) shows sticky price pressure, especially in services.
Bank of Japan: BoJ remains hesitant to normalize policy despite inflation consistently above the 2% target.
This policy divergence is reminiscent of the conditions that pushed USDJPY above 151 last year — and current dynamics hint that history may repeat.
🌐 Capital Flows: JPY Loses Safe-Haven Appeal
Global capital flow models indicate a major shift. While gold and the US dollar are once again sought-after hedges amid US-China tensions and EU fiscal risk, the Japanese yen is being overlooked.
Japan’s debt-to-GDP ratio — the highest in the G7 — forces BoJ to maintain low rates to keep the fiscal structure sustainable. As a result, JPY is no longer viewed as a reliable store of safety.
📊 Technical Structure: Momentum Building Toward 144.1
On the H1 chart:
Price bounced sharply from the 142.33 demand zone, forming a higher low.
EMA 13 – 34 – 89 show a bullish alignment ("fan-out formation") confirming short-term bullish momentum.
Resistance near 144.13–144.20 is key: a clean breakout could trigger an extended rally to 145.00+
However, this zone may also trigger profit-taking, especially if traders react to upcoming macro data.
🎯 Trade Strategy Recommendations
Scenario 1 – Buy the Pullback (Preferred):
Entry: 142.70 – 142.90
Stop-Loss: 142.30
Take-Profit: 143.80 → 144.13 → 144.60
Scenario 2 – Breakout Momentum Buy:
Entry: 144.15
Stop-Loss: 143.70
Take-Profit: 145.00 → 145.50
⚠️ Key Events to Watch:
US PCE Price Index (April): If hotter-than-expected, this would reinforce the Fed’s hawkish tone and lift USD.
BoJ Governor Speech (end of week): Any unexpected hawkish shift could trigger a short-term rebound in JPY.

JPY/USD Rising Wedge Breakdown – Bearish Reversal in Play🔎 Technical Breakdown:
1. Rising Wedge Formation:
The pair has been trading within a Rising Wedge, a bearish reversal pattern that forms when price makes higher highs and higher lows but with diminishing momentum. The wedge is visible from the swing low on May 13, where price began to climb aggressively but within increasingly narrow price action. This narrowing range signals weakening bullish strength.
2. Key Resistance Zone:
The wedge forms right below a Major Resistance Zone marked earlier in the chart (around 0.007050), where price had previously faced heavy selling pressure. This adds confluence to the bearish bias, as the zone historically acted as a turning point.
3. SR Interchange Zone:
Below the wedge lies a Support-turned-Resistance (SR) Interchange level, a critical price area where past support may now act as resistance if the price attempts to retrace. This is a commonly watched level by institutional and technical traders.
4. Breakdown Confirmation:
The price has broken below the wedge's lower trendline, which is often considered the breakdown signal. A valid breakdown typically includes a close outside the wedge body followed by a retest or continuation.
5. Bearish Target:
The projected move is toward 0.006796, derived by measuring the wedge height and applying it from the breakdown point. This level aligns with a historical support zone, adding more confluence to the target.
🧠 Psychological & Structural View:
Bullish exhaustion: Buyers pushed price higher into resistance, but momentum slowed, signaling exhaustion.
Trapped longs: Traders who entered late in the wedge may now be trapped, potentially accelerating a sell-off as they exit.
Smart money behavior: Rising wedges near resistance often signal distribution by smart money before a drop.
🛠️ Trading Plan Suggestion (Not Financial Advice):
Entry: After a clear wedge breakdown, consider short entries on a retest of the broken trendline or a bearish candle confirmation.
SL: Above the wedge high or major resistance zone.
TP: Staggered exits below 0.006850 and final target around 0.006796.
🔁 What to Watch For:
Retest of the wedge breakdown (potential short entry zone)
Momentum confirmation via volume or bearish candles
Price reaction at SR Interchange and final support target
🧠 Minds Section – Condensed Summary
JPY/USD formed a Rising Wedge below major resistance, signaling bullish exhaustion. Price has broken down from the wedge, confirming bearish momentum. A clean breakdown targets 0.006796, with SR interchange acting as a minor support. A retest of the wedge breakdown could offer a good short opportunity.

JPY/USD Weekly Chart – Bullish Triangle Breakout Pattern Forming🔍 Chart Pattern Breakdown:
The chart is showing a symmetrical triangle pattern forming on the weekly timeframe of JPY/USD (Japanese Yen vs. US Dollar). This triangle is developing after a massive multi-year downtrend, which started all the way back in 2021. Such a triangle at the bottom of a trend often signals a potential reversal or a strong trend shift.
Here's what's happening technically:
🔺 Triangle Formation (Consolidation Phase):
Lower highs and higher lows indicate a clear symmetrical triangle.
The price has been bouncing between these converging trendlines for months.
This compression is like a spring — it’s storing energy and getting ready to break out.
The triangle pattern is nearing its apex, which means a breakout is likely soon.
📉 Previous Trend Context:
Before the triangle, the market had a strong bearish move — a downtrend that brought the pair into a major weekly support zone.
This support zone (marked in light blue) around 0.0062–0.0063 has been tested and respected multiple times.
📊 Key Technical Zones:
Support Zone: 0.0062 – 0.0063 — this is where price bounced and formed the base of the triangle.
Resistance Zone / Triangle Top: Around 0.0071 – this is the upper boundary of the triangle. A breakout above this will confirm the bullish scenario.
Target Area: 0.00829 – derived from measuring the height of the triangle and projecting it from the breakout point.
Major BOS (Break of Structure): Once price breaks above the triangle and the BOS line, it confirms a shift from bearish to bullish structure.
SL Zone: Stop loss area is just below the support zone at 0.00629 to protect against false breakouts.
🔁 Retest Setup:
After the breakout, it's common to see a pullback to retest the previous resistance (now turned support). That retest often provides a high-probability entry for swing and position traders. If it happens — that’s your golden moment!
🎯 Trade Plan (Example for Education):
Entry Criteria Value/Zone
Breakout Entry Above 0.0071 (confirmed candle close)
Retest Entry 0.0069 – 0.0070 (support flip)
Stop-Loss (SL) Below 0.00629
Target (TP) 0.00829
✅ Why This Setup Matters:
Clear structure on the weekly chart.
Multi-touch points on both trendlines = strong pattern.
Support zone backing the triangle base gives extra conviction.
A breakout from such consolidation patterns often results in sharp movements.
Risk/reward ratio is highly favorable.
⚠️ Risk Management Reminder:
Always trade with a plan, use a stop-loss, and don’t jump into the breakout blindly. Volume confirmation or retest confirmation will help increase the success rate. These kinds of setups are powerful, but only when approached with discipline.
🧠 Final Thoughts:
This JPY/USD triangle on the weekly chart is a textbook example of potential bullish reversal from a major downtrend. It’s showing signs of a structural shift, supported by strong support, tightening price action, and the chance for a breakout to deliver a major upside move toward 0.00829.
If you’re a swing or position trader, keep this on your radar. Momentum is building — don’t miss the move when the breakout hits. 📈🔥

JPYUSD | Head & Shoulders Breakdown Setup | Bearish move Build🔍 Technical Overview
A clear Head & Shoulders pattern has formed on the JPY/USD 8H chart — a well-known bearish reversal setup often signaling a shift from bullish momentum to bearish control. The pattern is confirmed with a left shoulder, higher head, and lower right shoulder, all aligned along a defined neckline acting as key horizontal support.
Currently, the price is retesting both the neckline and a descending trendline, which adds confluence to the bearish bias. If price fails to break back above this resistance zone, we can anticipate a further drop toward the projected target zone.
📌 Key Technical Levels
Head: ~0.007180
Neckline Support: ~0.006660
Retest Area (Confluence Zone): ~0.006940–0.006960
Bearish Target: ~0.006470 (measured from the head to the neckline and projected downward)
Trendline Resistance: Acting as dynamic resistance since the recent high
⚙️ Price Action Insights
Pattern Clarity: The structure of the H&S is clean and symmetrical — a classic sign of distribution and topping out after a bullish rally.
Retest in Play: Price is currently retesting the trendline resistance. Rejection from this area strengthens bearish continuation potential.
Momentum Shift: Bullish pressure is weakening. Lower highs on the right shoulder show buyer exhaustion.
🧠 Mindset & Strategy
This setup demonstrates how patience, pattern recognition, and confluence can align to offer a high-probability trading idea.
✅ Wait for Confirmation: A strong bearish candle off the retest zone or neckline breakdown gives a cleaner short entry.
✅ Risk Management First: Place stops just above the right shoulder or trendline (~0.007000 zone).
✅ Target Logically: The target is not random — it’s derived using the classic measured move technique, matching the head-to-neckline distance.
📋 Trade Idea (Not Financial Advice)
📍 Entry: On rejection at retest zone or confirmed neckline breakdown
🎯 Target: 0.006470
🛑 Stop Loss: Above 0.007000 (trendline/right shoulder area)
⚖️ Risk/Reward Ratio: Minimum 2:1 if entered post-retest confirmation
🧠 Trader’s Note (Minds Insight)
This is where discipline comes into play. Don’t chase the move. Let the pattern complete and confirm. Head and Shoulders formations are among the most reliable reversal patterns — but only after neckline breaks or strong rejections.
This setup teaches traders to trust the process, combine horizontal and diagonal resistance, and let the price action do the talking.

JPY/USD Rising Wedge Pattern Formed | Retest & Move To Target🧠 Overview:
The JPY/USD pair has recently exhibited a Rising Wedge Pattern, a classic technical formation known for its bearish implications. This pattern has developed over several days of bullish price action, showing diminishing bullish momentum as price action narrows.
The wedge is forming right beneath a minor resistance zone, increasing the likelihood of a potential rejection and breakdown. This setup is particularly noteworthy due to the multiple layers of confluence supporting the bearish bias.
🔍 Technical Breakdown:
📌 1. Rising Wedge Formation
A rising wedge is often considered a bearish reversal pattern, especially after a strong uptrend.
As seen on the chart, price is respecting both the upper and lower bounds of the wedge, but with a loss of bullish momentum, indicated by shallower highs.
This tightening price action hints at indecision and likely exhaustion from buyers.
📌 2. Minor Resistance Zone
Price has approached a previous structure high where strong selling interest was seen before.
This zone has already rejected price once, acting as a supply area.
The repeated failure to break above reinforces the strength of this resistance.
📌 3. SR Interchange (Support Turned Resistance)
Below the current price action, there's a well-defined Support-Resistance Flip Zone (SR Interchange).
Previously a strong demand area, this zone may now act as a new resistance if price breaks below and retests it.
This is a key area where sellers are likely to step in again.
📌 4. Break & Retest Structure
As price begins to break the lower wedge boundary, the next move we anticipate is a retest of the broken wedge trendline.
This retest, if confirmed by rejection candles (such as bearish engulfing or pin bars), would present an ideal entry opportunity for short positions.
🎯 Trade Plan & Price Levels:
💼 Bearish Scenario
Entry Point: Wait for a successful retest of the broken wedge line (confirmation via price action: bearish engulfing or pin bar).
Stop Loss: Above the recent swing high or above the wedge resistance (~0.006920).
Take Profit 1 (TP1): 0.006845 – First key support zone.
Take Profit 2 (TP2): 0.006807 – Next major support / liquidity zone.
🧩 Why This Setup Makes Sense:
✅ Multiple Confluences:
Bearish wedge structure = reversal pattern.
Resistance zone = psychological and technical rejection.
SR Interchange = confirms institutional selling interest.
Retest confirmation = high-probability entry.
Target zones = based on recent support levels and market structure.
🛑 Risk Management:
Risk-to-reward ratio favors short positions if executed after retest.
Avoid jumping in early — wait for confirmation.
Proper stop loss is key to avoiding false breakouts or premature entries.
📊 Summary:
This is a textbook bearish setup with strong technical backing. The rising wedge pattern, when combined with resistance and retest zones, offers a great shorting opportunity — assuming price respects the pattern. Patience will be crucial here; wait for the break, the retest, and the confirmation before entering.
🔔 What to Watch:
Price behavior near the lower wedge boundary.
Reaction on retest — do bulls defend or do bears take over?
Confirmation from volume or price action (engulfing candles, rejection wicks).
Any fundamental catalysts or USD-related news.
✍️ Final Thoughts:
This is a well-structured short setup on the JPY/USD 1H chart. Wedges often deceive with temporary breakouts before reversing hard — so discipline, timing, and confirmation will be key. If the market respects this technical structure, we could see a clean drop toward our projected targets.

JPY/USD Breakout from Curve Line – Targeting Upper Resistance JPY/USD presents a classic curve bottom formation, which is a powerful technical structure indicating accumulation by smart money. It’s supported by key price action behaviors like support/resistance flips, retesting confirmation, and a well-defined target zone.
Let’s break it down piece by piece.
📉 1. Curve Formation – Accumulation Phase
The most noticeable element here is the parabolic (curve) structure formed between October 2024 and March 2025. This kind of structure often reflects a slow accumulation process:
Price dips over several months form a rounded bottom — also called a saucer pattern.
This shows institutional players are quietly accumulating, while retail traders are often trapped in sell-side positions.
As the curve matures, the volume and momentum begin to shift, signaling the beginning of a bullish breakout.
This accumulation curve is bullish by nature and becomes even more potent when followed by a breakout and retest.
🔄 2. SR Flip Zone (Support-Resistance Interchange)
One of the most critical concepts in price action is the SR flip — where old resistance turns into new support. In this case:
The yellow-shaded zone previously acted as resistance — confirmed by multiple rejections.
After the breakout, this same zone is being retested as support — a healthy technical confirmation that the market has accepted higher prices.
This flip zone is a launchpad for continuation to the upside.
📍 3. Retest Confirmation – Smart Entry Opportunity
Zooming into recent price action:
The market pulled back cleanly into the SR zone and the curve line.
The confluence of horizontal support and the curved trendline makes this an extremely strong retest zone.
Buyers stepped in with force, suggesting that demand is active at this level.
This retest is where risk-to-reward is optimized. The ideal entries usually happen when price confirms structure after a breakout — not before.
🎯 4. Target Zone – Next Bullish Objective
The next logical target is shown in the blue box above (~0.00705–0.00710). Here's why this zone is important:
It marks a previous supply/resistance area.
It aligns with psychological round numbers and past consolidation.
A measured move from the bottom of the curve also aligns with this target.
In essence, it is the profit-taking zone where the market is likely to pause or reverse temporarily.
🔎 5. Insider Supply & Central Zone – Institutional Traces
The chart labels an “Insider Supply” area at the base of the curve. This implies:
Hidden accumulation likely occurred at this level.
Institutions tend to trap retail sellers during these periods with false breakdowns.
Once they’ve loaded up, price shifts upward in a controlled fashion — exactly what has happened here.
The Central Zone is the battlefield — the area where prior indecision took place, which has now turned into a stepping stone for upward movement.
💡 Strategy Recap:
Parameter Value
Entry Retest of SR Flip (0.00680–0.00685)
Stop Loss Below curve base (~0.00670 or lower)
Target 0.00705–0.00710
R/R Ratio 1:2 or better
This strategy is technically sound, supported by structure, and has strong reward potential.
🧠 Market Psychology:
Smart money accumulates when price is quiet and sentiment is bearish.
After accumulation, a controlled markup begins, with retests engineered to confirm the breakout.
Retail traders tend to enter late or get faked out — while institutions already hold positions.
This chart is a textbook example of how professional traders operate and manage structure-based risk.
🏁 Final Thoughts:
This is a high-probability technical setup built on multiple layers of confluence:
Curve structure
SR flip
Demand zone retest
Momentum shift
If momentum continues, the 0.00710 zone is a very realistic short-term target. Traders should manage risk tightly and monitor price behavior near the upper resistance box.

GBPJPY UPDATEHello friends
Given the channel break and the continuation of the decline, we expect the price to move to the two specified supports.
*Trade safely with us*

GJ Ideasmall idea for this trade, I hate typing when i'm not looking at the charts so this might be easier lol

Fundamental Market Analysis for April 18, 2025 USDJPYThe USD/JPY pair is down to 142.25 in thin trading session on Friday. The US Dollar (USD) is declining against the Japanese Yen (JPY) amid concerns over the economic impact of tariffs.
Data released by the Statistics Bureau of Japan on Friday showed that the national consumer price index (CPI) rose 3.6% in March, up from the previous reading of 3.7%. Meanwhile, the national CPI excluding fresh food was 3.2% y/y in March, up from 3.0% previously. The reading was in line with the market consensus.
Finally, the consumer price index excluding fresh food and energy rose 2.9% y/y in March vs. the previous reading of 2.6%. The Japanese Yen remains strong against the US Dollar as an immediate reaction to Japanese inflation data.
However, JPY gains may be limited as Bank of Japan (BoJ) officials signalled a pause in the consideration of interest rate hikes, emphasising the need to monitor uncertainty heightened by US tariff measures.
Economic data from the US on Thursday was mixed. US initial jobless claims fell to their lowest level in two months, signalling a stable labour market. In addition, the Philadelphia Fed index fell short of expectations, a warning shot from the manufacturing sector.
Trade recommendation: SELL 142.05, SL 143.40, TP 139.80
JPY/USD Daily Chart – Falling Wedge Breakout & Bullish Target🔍 Full Technical Analysis of JPY/USD (Daily Timeframe)
🧭 Overview
The chart shows a sophisticated price structure unfolding over several months. A falling wedge reversal pattern formed during a sustained downtrend, which later transitioned into a bullish breakout and continuation. This analysis provides insights into market behavior, price psychology, and a high-probability trading opportunity supported by classical technical analysis principles.
🔶 1. Market Context & Structure
Before diving into the pattern, it’s essential to understand the macro structure of the chart:
The pair experienced a strong bearish move from around August to December 2024, marked by lower highs and lower lows.
During this decline, volatility gradually decreased, which often indicates seller exhaustion.
A reversal zone emerged near a major support region — historically significant and previously tested.
🔷 2. The Falling Wedge Pattern (Reversal Signal)
A falling wedge is a bullish reversal pattern that forms when price is in a downtrend but begins to consolidate within converging trendlines. This pattern typically signals that the downtrend is losing momentum and a breakout to the upside is imminent.
📌 Characteristics of This Wedge:
Downward Convergence: The highs and lows begin to narrow over time, indicating reduced selling pressure.
Volume Decline (Implied): Though not displayed, falling wedges usually see volume dry up before breakout.
Duration: This wedge developed over several months (October 2024 – January 2025), lending strength to the pattern.
False Break Attempts: Several lower spikes failed to break the support, showing buying interest building.
✅ Bullish Breakout:
The breakout occurred decisively in late January 2025, with a large bullish candlestick closing above the upper wedge boundary — a confirmed breakout.
Post-breakout, the price rallied strongly, indicating that buyers were firmly in control.
🔷 3. Support & Resistance Zones
🔽 Support Zone (Demand Area):
Range: 0.006300 – 0.006400
Historical pivot zone where price previously reversed, now serving as a demand base.
The lower wick rejections near this zone reinforce it as a high liquidity zone for buyers.
🔼 Resistance Zone (Supply Area):
Range: 0.006850 – 0.006950
This area capped price during several prior rally attempts, making it a key breakout point.
Once price broke above this zone, it became a support flip zone, indicating trend reversal confirmation.
🎯 Target Level:
Marked at 0.007126, derived from a measured move:
Measure the height of the wedge at its widest point.
Project this vertically from the breakout level.
This target aligns with psychological round numbers and prior resistance, adding confluence.
🔶 4. Post-Breakout Price Action: Bullish Retest
A breakout is only the first part of a trade; the retest phase confirms the move and offers an optimal entry.
🔁 Retest Details:
After reaching the resistance zone, price pulled back, testing both:
The broken wedge trendline (now acting as dynamic support).
The horizontal structure support zone near 0.006650–0.006700.
A bullish engulfing candle or similar reversal pattern formed at this level — a classic retest entry.
📌 Trendline Respect:
A rising dotted trendline was drawn from the breakout low through higher lows.
This line acted as price memory and was respected multiple times, reinforcing the uptrend.
🔷 5. Trade Setup Breakdown
This is a swing trade setup based on pattern breakout, structural confluence, and trend continuation. Here's how it’s structured:
Component Details
Pattern Falling Wedge (Reversal)
Trade Bias Long (Buy)
Entry Price ~0.006700
Stop Loss 0.006614 (below trendline)
Target Price 0.007126 (measured wedge move)
R/R Ratio Approx. 3:1
Timeframe Daily (Medium-term swing)
🧠 6. Market Psychology & Behavior
Understanding the sentiment behind the candles is critical:
❗ Before the Breakout:
Sellers dominated but with weakening momentum.
Each push down was met with buying strength, seen in long wicks and smaller-bodied candles.
✅ At the Breakout:
Buyers overwhelmed sellers, often with a volume spike and wide-bodied green candle.
This is usually driven by institutional positioning and stop-loss triggering from short-sellers.
🔁 During the Retest:
Some retail traders exited prematurely, fearing a fakeout.
Smart money used the dip to accumulate positions, confirmed by the bounce from trendline.
🔼 Continuation Rally:
Strong continuation candle signals momentum traders entering.
Break above resistance signals a shift in sentiment and structure.
🛠️ 7. Strategy Notes & Professional Tips
📌 Risk Management:
Never risk more than 1–2% of capital.
Use dynamic trailing stop if price breaks above target zone.
📌 Trade Confirmation Ideas:
Look for volume spikes on breakout candles.
Use RSI or MACD divergence to confirm reversal (optional).
Look for candlestick patterns (engulfing, pin bar) on retests.
📌 Exit Plan:
Partial exit at key resistance.
Full exit at projected target or if price forms reversal signs (e.g., doji at resistance).
✅ Final Summary
This JPY/USD chart demonstrates an exemplary price action-based trading setup rooted in:
A well-formed falling wedge (bullish reversal).
Clean breakout + retest + continuation structure.
Multiple confluence factors: trendline, horizontal S/R, pattern projection.
Professional-grade risk/reward profile with a logical entry, stop, and target.
This kind of setup is highly favored among swing traders, price action purists, and institutional-level strategists due to its clarity and predictability.

JPY/USD – Rising Wedge Breakdown & Bearish Trading Setup1. Market Structure & Technical Pattern:
The Japanese Yen (JPY) against the U.S. Dollar (USD) has been exhibiting a clear Rising Wedge Pattern over the past few months. This is a classic bearish reversal pattern, indicating that buying momentum is gradually weakening, and a strong decline is likely to follow.
Formation of the Rising Wedge:
The price has been making higher highs and higher lows, confined within two converging trendlines (black lines).
The lower boundary (support trendline) has been consistently acting as a dynamic support level.
The upper boundary (resistance trendline) has been limiting further upward movement, indicating exhaustion of buying pressure.
Breakout Confirmation:
The price action tested the resistance zone multiple times but failed to sustain bullish momentum.
A strong rejection from the upper resistance level led to a sharp sell-off, causing a breakdown of the support trendline.
Once the price broke below the wedge, selling pressure intensified, confirming the trend reversal.
2. Key Technical Levels & Zones:
Resistance Level (0.006895):
The price previously struggled to break above this resistance zone, forming a strong supply area where sellers dominated.
This level aligns with the upper boundary of the rising wedge, making it a significant turning point.
The rejection from this zone initiated the bearish breakdown.
Support Level (Broken – 0.006650):
This level acted as a strong demand zone, preventing further downside movement during the wedge formation.
However, once the price broke below this level, it confirmed the end of the uptrend and the beginning of a downtrend.
This level may now act as a new resistance (role reversal principle).
Stop Loss Placement (Above 0.006895):
A logical stop-loss is placed just above the resistance level to protect against a potential invalidation of the bearish setup.
If the price closes above this level, the bearish thesis would be invalidated.
3. Trading Execution & Risk Management:
Sell Entry Strategy:
Traders looking for short positions should enter after a confirmed break below the wedge’s support.
A potential pullback (retest) to the broken trendline could offer an additional shorting opportunity.
The retest would confirm the previous support turning into resistance before a continuation of the downtrend.
Take Profit Targets (TP1 & TP2):
TP1 (0.006481):
This level represents a strong demand zone where short-term buyers may step in.
Traders may choose to book partial profits here.
TP2 (0.006251):
This is a deeper support level and the final target for this trade setup.
If the price sustains bearish momentum, it is likely to reach this level before stabilizing.
Risk-to-Reward Ratio Consideration:
This setup offers a high probability short trade with an attractive risk-to-reward ratio.
The stop-loss is well-defined, minimizing potential losses while maximizing profit potential.
4. Expected Price Movement & Projection:
Short-term Outlook:
A possible pullback to the broken wedge (previous support now acting as resistance) before continuation lower.
If the price retests and rejects the 0.006650 level, expect acceleration in the downtrend.
Medium-term Outlook:
If the price reaches TP1 (0.006481) and breaks below, it increases the probability of hitting TP2 (0.006251).
A bearish trend continuation could form, potentially leading to further downside levels.
Invalidation Scenario:
If the price closes above the stop-loss level (0.006895), the bearish setup is invalidated, and a bullish breakout could follow instead.
5. Conclusion & Trading Plan:
The rising wedge breakdown signals a shift from bullish to bearish market sentiment.
Traders should look for short entries after a confirmed breakdown or wait for a pullback before executing trades.
The risk-to-reward ratio makes this a strong high-probability trade setup.
Following the plan with strict stop-loss placement ensures risk is controlled while maximizing profit potential.
6. Summary & Key Takeaways:
✅ Pattern: Rising Wedge (Bearish Reversal)
✅ Breakout Direction: Downside
✅ Resistance Level: 0.006895
✅ Support Levels: 0.006650 (broken), 0.006481 (TP1), 0.006251 (TP2)
✅ Stop-Loss Placement: Above 0.006895
✅ Profit Targets: TP1 – 0.006481, TP2 – 0.006251
✅ Trade Bias: Bearish

PY/USD Analysis: Rising Wedge Bearish Reversal & Short SetupThis chart represents the JPY/USD (Japanese Yen vs. US Dollar) on a daily timeframe (1D), published on April 3, 2025, via TradingView. The price action and technical indicators suggest a bearish outlook based on the formation of a Rising Wedge Pattern, a classic reversal structure signaling potential price depreciation.
1. Chart Structure & Identified Patterns
A. Rising Wedge Formation (Bearish Reversal Pattern)
The price has been moving in an uptrend, forming higher highs (HH) and higher lows (HL).
The two converging black trendlines indicate a rising wedge, a pattern that typically precedes a downside breakout.
A rising wedge is considered a bearish signal, especially when formed after a strong rally.
B. Support and Resistance Levels
Resistance Zone (Highlighted in Beige, Upper Range)
This level represents a historically significant supply area where selling pressure is expected.
Price action shows multiple rejections at this level, indicating the presence of strong resistance.
The red downward arrow further confirms that this level is acting as a cap on price movement.
Support Zone (Highlighted in Beige, Lower Range)
This area previously served as a strong demand level, where buyers stepped in, reversing the price.
The green upward arrow suggests that it played a critical role in the prior bullish move.
C. Key Price Levels
All-Time High (ATH) Marked at ~0.007155
This represents the historical peak price, which serves as a potential long-term resistance.
Stop-Loss Placement (~0.006959)
This is placed above the resistance level to manage risk in case of a false breakout.
Target Level (~0.006178)
Based on the wedge height, this level is calculated as the measured move after a breakdown.
2. Price Action & Market Sentiment
A. Recent Bullish Move
The market has been in a strong uptrend since hitting the support zone.
This move was characterized by higher lows and higher highs, reinforcing bullish momentum.
However, momentum appears to be weakening as the price struggles to break through the resistance.
B. Confirmation of a Bearish Reversal
The price has touched the upper resistance zone multiple times but failed to break through.
The trendline breakdown (expected move) suggests sellers are stepping in.
A lower high formation is seen as an early warning of a reversal.
3. Trade Setup: Short Position Strategy
This setup aligns with the principles of technical analysis, utilizing the Rising Wedge as a bearish reversal pattern.
A. Entry Strategy
Sell Entry Trigger: Enter a short trade upon a confirmed breakdown below the lower trendline.
Retest Confirmation: Ideally, wait for a pullback to the broken trendline before shorting to avoid false signals.
B. Risk Management
Stop-Loss Placement: Above the resistance zone at 0.006959, to protect against an invalidation.
Take-Profit Target: Set at 0.006178, calculated based on the wedge’s height projection.
C. Reward-to-Risk Ratio (RRR)
RRR = 2:1 or higher
The target level offers a risk-reward ratio that justifies the trade setup.
4. Summary & Final Outlook
Bearish Signals:
✅ Rising Wedge Pattern – A strong reversal indicator.
✅ Lower Highs and Weak Momentum – Suggests selling pressure.
✅ Failure to Break Resistance – Indicates bullish exhaustion.
✅ Projected Target Based on Wedge – Price expected to reach 0.006178.
Neutral Considerations:
If price does not break the lower trendline, the pattern is not validated.
If a false breakdown occurs, prices may briefly recover before falling.
Bullish Invalidation:
If the price breaks above 0.006959 and sustains above resistance, the bearish setup is invalidated.
Final Verdict:
📉 Bearish Bias – The market setup favors a downside move upon a confirmed breakdown.
🎯 Target: 0.006178 (Key support level).
⚠️ Risk: If the price does not break lower, consolidation may occur before a clearer move.
