JPYUSD | Head & Shoulders Breakdown Setup | Bearish move Build🔍 Technical Overview
A clear Head & Shoulders pattern has formed on the JPY/USD 8H chart — a well-known bearish reversal setup often signaling a shift from bullish momentum to bearish control. The pattern is confirmed with a left shoulder, higher head, and lower right shoulder, all aligned along a defined neckline acting as key horizontal support.
Currently, the price is retesting both the neckline and a descending trendline, which adds confluence to the bearish bias. If price fails to break back above this resistance zone, we can anticipate a further drop toward the projected target zone.
📌 Key Technical Levels
Head: ~0.007180
Neckline Support: ~0.006660
Retest Area (Confluence Zone): ~0.006940–0.006960
Bearish Target: ~0.006470 (measured from the head to the neckline and projected downward)
Trendline Resistance: Acting as dynamic resistance since the recent high
⚙️ Price Action Insights
Pattern Clarity: The structure of the H&S is clean and symmetrical — a classic sign of distribution and topping out after a bullish rally.
Retest in Play: Price is currently retesting the trendline resistance. Rejection from this area strengthens bearish continuation potential.
Momentum Shift: Bullish pressure is weakening. Lower highs on the right shoulder show buyer exhaustion.
🧠 Mindset & Strategy
This setup demonstrates how patience, pattern recognition, and confluence can align to offer a high-probability trading idea.
✅ Wait for Confirmation: A strong bearish candle off the retest zone or neckline breakdown gives a cleaner short entry.
✅ Risk Management First: Place stops just above the right shoulder or trendline (~0.007000 zone).
✅ Target Logically: The target is not random — it’s derived using the classic measured move technique, matching the head-to-neckline distance.
📋 Trade Idea (Not Financial Advice)
📍 Entry: On rejection at retest zone or confirmed neckline breakdown
🎯 Target: 0.006470
🛑 Stop Loss: Above 0.007000 (trendline/right shoulder area)
⚖️ Risk/Reward Ratio: Minimum 2:1 if entered post-retest confirmation
🧠 Trader’s Note (Minds Insight)
This is where discipline comes into play. Don’t chase the move. Let the pattern complete and confirm. Head and Shoulders formations are among the most reliable reversal patterns — but only after neckline breaks or strong rejections.
This setup teaches traders to trust the process, combine horizontal and diagonal resistance, and let the price action do the talking.
Jpyusdshort

JPY/USD Rising Wedge Pattern Formed | Retest & Move To Target🧠 Overview:
The JPY/USD pair has recently exhibited a Rising Wedge Pattern, a classic technical formation known for its bearish implications. This pattern has developed over several days of bullish price action, showing diminishing bullish momentum as price action narrows.
The wedge is forming right beneath a minor resistance zone, increasing the likelihood of a potential rejection and breakdown. This setup is particularly noteworthy due to the multiple layers of confluence supporting the bearish bias.
🔍 Technical Breakdown:
📌 1. Rising Wedge Formation
A rising wedge is often considered a bearish reversal pattern, especially after a strong uptrend.
As seen on the chart, price is respecting both the upper and lower bounds of the wedge, but with a loss of bullish momentum, indicated by shallower highs.
This tightening price action hints at indecision and likely exhaustion from buyers.
📌 2. Minor Resistance Zone
Price has approached a previous structure high where strong selling interest was seen before.
This zone has already rejected price once, acting as a supply area.
The repeated failure to break above reinforces the strength of this resistance.
📌 3. SR Interchange (Support Turned Resistance)
Below the current price action, there's a well-defined Support-Resistance Flip Zone (SR Interchange).
Previously a strong demand area, this zone may now act as a new resistance if price breaks below and retests it.
This is a key area where sellers are likely to step in again.
📌 4. Break & Retest Structure
As price begins to break the lower wedge boundary, the next move we anticipate is a retest of the broken wedge trendline.
This retest, if confirmed by rejection candles (such as bearish engulfing or pin bars), would present an ideal entry opportunity for short positions.
🎯 Trade Plan & Price Levels:
💼 Bearish Scenario
Entry Point: Wait for a successful retest of the broken wedge line (confirmation via price action: bearish engulfing or pin bar).
Stop Loss: Above the recent swing high or above the wedge resistance (~0.006920).
Take Profit 1 (TP1): 0.006845 – First key support zone.
Take Profit 2 (TP2): 0.006807 – Next major support / liquidity zone.
🧩 Why This Setup Makes Sense:
✅ Multiple Confluences:
Bearish wedge structure = reversal pattern.
Resistance zone = psychological and technical rejection.
SR Interchange = confirms institutional selling interest.
Retest confirmation = high-probability entry.
Target zones = based on recent support levels and market structure.
🛑 Risk Management:
Risk-to-reward ratio favors short positions if executed after retest.
Avoid jumping in early — wait for confirmation.
Proper stop loss is key to avoiding false breakouts or premature entries.
📊 Summary:
This is a textbook bearish setup with strong technical backing. The rising wedge pattern, when combined with resistance and retest zones, offers a great shorting opportunity — assuming price respects the pattern. Patience will be crucial here; wait for the break, the retest, and the confirmation before entering.
🔔 What to Watch:
Price behavior near the lower wedge boundary.
Reaction on retest — do bulls defend or do bears take over?
Confirmation from volume or price action (engulfing candles, rejection wicks).
Any fundamental catalysts or USD-related news.
✍️ Final Thoughts:
This is a well-structured short setup on the JPY/USD 1H chart. Wedges often deceive with temporary breakouts before reversing hard — so discipline, timing, and confirmation will be key. If the market respects this technical structure, we could see a clean drop toward our projected targets.

JPY/USD – Rising Wedge Breakdown & Bearish Trading Setup1. Market Structure & Technical Pattern:
The Japanese Yen (JPY) against the U.S. Dollar (USD) has been exhibiting a clear Rising Wedge Pattern over the past few months. This is a classic bearish reversal pattern, indicating that buying momentum is gradually weakening, and a strong decline is likely to follow.
Formation of the Rising Wedge:
The price has been making higher highs and higher lows, confined within two converging trendlines (black lines).
The lower boundary (support trendline) has been consistently acting as a dynamic support level.
The upper boundary (resistance trendline) has been limiting further upward movement, indicating exhaustion of buying pressure.
Breakout Confirmation:
The price action tested the resistance zone multiple times but failed to sustain bullish momentum.
A strong rejection from the upper resistance level led to a sharp sell-off, causing a breakdown of the support trendline.
Once the price broke below the wedge, selling pressure intensified, confirming the trend reversal.
2. Key Technical Levels & Zones:
Resistance Level (0.006895):
The price previously struggled to break above this resistance zone, forming a strong supply area where sellers dominated.
This level aligns with the upper boundary of the rising wedge, making it a significant turning point.
The rejection from this zone initiated the bearish breakdown.
Support Level (Broken – 0.006650):
This level acted as a strong demand zone, preventing further downside movement during the wedge formation.
However, once the price broke below this level, it confirmed the end of the uptrend and the beginning of a downtrend.
This level may now act as a new resistance (role reversal principle).
Stop Loss Placement (Above 0.006895):
A logical stop-loss is placed just above the resistance level to protect against a potential invalidation of the bearish setup.
If the price closes above this level, the bearish thesis would be invalidated.
3. Trading Execution & Risk Management:
Sell Entry Strategy:
Traders looking for short positions should enter after a confirmed break below the wedge’s support.
A potential pullback (retest) to the broken trendline could offer an additional shorting opportunity.
The retest would confirm the previous support turning into resistance before a continuation of the downtrend.
Take Profit Targets (TP1 & TP2):
TP1 (0.006481):
This level represents a strong demand zone where short-term buyers may step in.
Traders may choose to book partial profits here.
TP2 (0.006251):
This is a deeper support level and the final target for this trade setup.
If the price sustains bearish momentum, it is likely to reach this level before stabilizing.
Risk-to-Reward Ratio Consideration:
This setup offers a high probability short trade with an attractive risk-to-reward ratio.
The stop-loss is well-defined, minimizing potential losses while maximizing profit potential.
4. Expected Price Movement & Projection:
Short-term Outlook:
A possible pullback to the broken wedge (previous support now acting as resistance) before continuation lower.
If the price retests and rejects the 0.006650 level, expect acceleration in the downtrend.
Medium-term Outlook:
If the price reaches TP1 (0.006481) and breaks below, it increases the probability of hitting TP2 (0.006251).
A bearish trend continuation could form, potentially leading to further downside levels.
Invalidation Scenario:
If the price closes above the stop-loss level (0.006895), the bearish setup is invalidated, and a bullish breakout could follow instead.
5. Conclusion & Trading Plan:
The rising wedge breakdown signals a shift from bullish to bearish market sentiment.
Traders should look for short entries after a confirmed breakdown or wait for a pullback before executing trades.
The risk-to-reward ratio makes this a strong high-probability trade setup.
Following the plan with strict stop-loss placement ensures risk is controlled while maximizing profit potential.
6. Summary & Key Takeaways:
✅ Pattern: Rising Wedge (Bearish Reversal)
✅ Breakout Direction: Downside
✅ Resistance Level: 0.006895
✅ Support Levels: 0.006650 (broken), 0.006481 (TP1), 0.006251 (TP2)
✅ Stop-Loss Placement: Above 0.006895
✅ Profit Targets: TP1 – 0.006481, TP2 – 0.006251
✅ Trade Bias: Bearish

PY/USD Analysis: Rising Wedge Bearish Reversal & Short SetupThis chart represents the JPY/USD (Japanese Yen vs. US Dollar) on a daily timeframe (1D), published on April 3, 2025, via TradingView. The price action and technical indicators suggest a bearish outlook based on the formation of a Rising Wedge Pattern, a classic reversal structure signaling potential price depreciation.
1. Chart Structure & Identified Patterns
A. Rising Wedge Formation (Bearish Reversal Pattern)
The price has been moving in an uptrend, forming higher highs (HH) and higher lows (HL).
The two converging black trendlines indicate a rising wedge, a pattern that typically precedes a downside breakout.
A rising wedge is considered a bearish signal, especially when formed after a strong rally.
B. Support and Resistance Levels
Resistance Zone (Highlighted in Beige, Upper Range)
This level represents a historically significant supply area where selling pressure is expected.
Price action shows multiple rejections at this level, indicating the presence of strong resistance.
The red downward arrow further confirms that this level is acting as a cap on price movement.
Support Zone (Highlighted in Beige, Lower Range)
This area previously served as a strong demand level, where buyers stepped in, reversing the price.
The green upward arrow suggests that it played a critical role in the prior bullish move.
C. Key Price Levels
All-Time High (ATH) Marked at ~0.007155
This represents the historical peak price, which serves as a potential long-term resistance.
Stop-Loss Placement (~0.006959)
This is placed above the resistance level to manage risk in case of a false breakout.
Target Level (~0.006178)
Based on the wedge height, this level is calculated as the measured move after a breakdown.
2. Price Action & Market Sentiment
A. Recent Bullish Move
The market has been in a strong uptrend since hitting the support zone.
This move was characterized by higher lows and higher highs, reinforcing bullish momentum.
However, momentum appears to be weakening as the price struggles to break through the resistance.
B. Confirmation of a Bearish Reversal
The price has touched the upper resistance zone multiple times but failed to break through.
The trendline breakdown (expected move) suggests sellers are stepping in.
A lower high formation is seen as an early warning of a reversal.
3. Trade Setup: Short Position Strategy
This setup aligns with the principles of technical analysis, utilizing the Rising Wedge as a bearish reversal pattern.
A. Entry Strategy
Sell Entry Trigger: Enter a short trade upon a confirmed breakdown below the lower trendline.
Retest Confirmation: Ideally, wait for a pullback to the broken trendline before shorting to avoid false signals.
B. Risk Management
Stop-Loss Placement: Above the resistance zone at 0.006959, to protect against an invalidation.
Take-Profit Target: Set at 0.006178, calculated based on the wedge’s height projection.
C. Reward-to-Risk Ratio (RRR)
RRR = 2:1 or higher
The target level offers a risk-reward ratio that justifies the trade setup.
4. Summary & Final Outlook
Bearish Signals:
✅ Rising Wedge Pattern – A strong reversal indicator.
✅ Lower Highs and Weak Momentum – Suggests selling pressure.
✅ Failure to Break Resistance – Indicates bullish exhaustion.
✅ Projected Target Based on Wedge – Price expected to reach 0.006178.
Neutral Considerations:
If price does not break the lower trendline, the pattern is not validated.
If a false breakdown occurs, prices may briefly recover before falling.
Bullish Invalidation:
If the price breaks above 0.006959 and sustains above resistance, the bearish setup is invalidated.
Final Verdict:
📉 Bearish Bias – The market setup favors a downside move upon a confirmed breakdown.
🎯 Target: 0.006178 (Key support level).
⚠️ Risk: If the price does not break lower, consolidation may occur before a clearer move.

JPY/USD: Bearish Triangle Pattern Breakout Towards TargetChart Pattern: Triangle Pattern
Pattern Description
Type: The chart identifies a Triangle Pattern, which is a type of consolidation pattern that can act as either a continuation or reversal pattern depending on the preceding trend and the breakout direction. Triangles are characterized by converging trendlines, indicating a period of indecision in the market as the price range narrows.
Specific Type: This appears to be a Symmetrical Triangle, as the upper and lower trendlines converge at a similar angle, suggesting neither buyers nor sellers have clear control during the consolidation phase.
Appearance on the Chart:
The Triangle Pattern is marked with two converging trendlines:
Upper Trendline (Resistance): Connects the lower highs, sloping downward.
Lower Trendline (Support): Connects the higher lows, sloping upward.
The pattern began forming around March 27, after a sharp downtrend, and continued until the breakout on April 2, 2025.
Breakout Direction:
Symmetrical Triangles can break out in either direction, but they often continue the preceding trend. In this case, the preceding trend was bearish (a sharp decline from 0.006720 to 0.006640), and the breakout is to the downside, confirming a bearish continuation.
The chart shows the price breaking below the lower trendline of the triangle around April 2, 2025, with a strong bearish candle, indicating a confirmed bearish breakout.
Key Levels and Trading Setup
1. Support Level
A horizontal support zone is marked around 0.006640 (approximately 0.00664–0.00665).
This level acted as a base during the triangle formation, with the price bouncing off this zone multiple times (e.g., on March 28 and March 31).
The price has now broken below this support, turning it into a resistance level on any potential retest.
2. Resistance Level
A resistance zone is marked around 0.006705 (approximately 0.00670–0.00671).
This level corresponds to a previous high within the triangle and aligns with the upper boundary of the triangle at the time of the breakout.
After the breakout, this resistance level is where the stop loss is placed, as a move back above this level would invalidate the bearish setup.
3. Target
The target for the breakout is projected at 0.006599 (approximately 0.00660).
This target is likely calculated by measuring the height of the triangle at its widest point (from the highest high to the lowest low within the pattern) and projecting that distance downward from the breakout point.
The chart indicates a potential move of -0.000604 (-0.96%), which aligns with the distance from the breakout level (around 0.006654) to the target (0.006599).
4. Stop Loss
A stop loss is suggested above the resistance level at 0.006705.
This placement ensures that if the breakout fails and the price moves back above the triangle’s lower trendline (now acting as resistance), the trade is exited with a manageable loss.
Trading Setup Summary
Entry:
The setup suggests entering a short (sell) position after the price breaks below the lower trendline of the Triangle Pattern, which occurred around April 2, 2025. The breakout is confirmed by a strong bearish candle closing below the trendline at approximately 0.006654.
Stop Loss:
Place a stop loss above the resistance level at 0.006705 to protect against a false breakout or reversal. The distance from the breakout level (0.006654) to the stop loss (0.006705) is 0.000051, representing the risk on the trade.
Take Profit/Target:
Aim for the target at 0.006599, which is the projected price objective based on the triangle’s height. The distance from the breakout level to the target is 0.000055, or a 0.96% move.
Risk-Reward Ratio:
The risk is 0.000051 (from 0.006654 to 0.006705), and the reward is 0.000055 (from 0.006654 to 0.006599), giving a risk-reward ratio of approximately 1:1.08 (0.000055 / 0.000051). While this ratio is slightly above 1:1, it’s on the lower side for a typical trading setup, so traders should ensure high confidence in the breakout.
Additional Observations
Price Action Context:
Before the triangle formed, the price experienced a sharp decline from 0.006720 (March 23) to 0.006640 (March 27), indicating a strong bearish trend.
The triangle represents a consolidation phase within this downtrend, and the downside breakout suggests a continuation of the bearish momentum.
Volume and Momentum:
The chart doesn’t display volume or momentum indicators (e.g., RSI, MACD). However, a typical confirmation of a triangle breakout would include:
An increase in volume on the breakout candle, indicating strong selling pressure.
Bearish momentum signals, such as an RSI below 50 or a bearish MACD crossover.
Traders might want to check these indicators for additional confirmation of the breakout’s strength.
Timeframe:
This is a 1-hour chart, so the setup is intended for short-term trading, with the target potentially being reached within a few hours to a day.
Market Context:
USD/JPY is influenced by factors like U.S. dollar strength, Japanese yen safe-haven demand, and interest rate differentials. A bearish move in USD/JPY could be driven by a stronger yen (e.g., due to risk-off sentiment) or a weaker dollar (e.g., due to dovish U.S. economic data).
Conclusion
The TradingView idea presents a bearish setup for USD/JPY based on a Symmetrical Triangle Pattern on the 1-hour chart. The price has broken below the triangle’s lower trendline, confirming a bearish continuation with a target of 0.006599. The setup includes a stop loss at 0.006705 to manage risk, offering a risk-reward ratio of approximately 1:1.08. Key levels to watch include the former support (now resistance) at 0.006640 and the resistance at 0.006705. Traders should consider additional confirmation from volume and momentum indicators, as well as broader market conditions, before executing the trade. Since this chart is from April 2, 2025, market conditions may have evolved, and I can assist with searching for more recent data if needed!

JPY/USD 4H Chart Analysis – Head & Shoulders Breakdown & BearishThis detailed technical analysis covers a Head & Shoulders pattern formation on the 4-hour chart of JPY/USD, highlighting a potential bearish reversal setup. The pattern suggests a shift from an uptrend to a downtrend, supported by a trendline breakdown and key resistance & support levels.
1️⃣ Understanding the Chart Pattern: Head & Shoulders (H&S)
📉 What is the Head & Shoulders Pattern?
The Head & Shoulders (H&S) is a classic bearish reversal pattern that appears after a prolonged uptrend, signaling a shift in market sentiment from bullish to bearish. It consists of three main parts:
Left Shoulder: A peak followed by a retracement.
Head: A higher peak, indicating the last strong bullish attempt.
Right Shoulder: A lower peak, failing to reach the height of the head, showing weakening momentum.
Neckline: A crucial support level that connects the lows of the shoulders. A confirmed break below this neckline is the trigger for a bearish continuation.
📊 Breakdown of the Pattern in This Chart
Left Shoulder (First Peak): The price made a high and then pulled back.
Head (Higher Peak): The market made another higher high but failed to sustain it, indicating exhaustion.
Right Shoulder (Lower Peak): A weaker attempt to push higher, but price failed to break previous highs, confirming the loss of bullish strength.
Neckline Breakout: The dotted trendline shows the ascending support that was eventually broken, confirming bearish momentum.
2️⃣ Key Technical Levels & Market Structure
Understanding the important levels in the market is crucial for setting up an effective trade.
🟧 Resistance Zone (Supply Area)
The resistance level, marked in a beige box, is located around 0.006800.
Price was rejected multiple times from this zone, confirming strong selling pressure.
The head of the pattern was formed in this region before a sharp drop.
🔵 Support Level (Neckline & Demand Area)
The neckline of the Head & Shoulders pattern was acting as support before being broken.
This level was tested multiple times before the final breakdown.
Once broken, it turned into a resistance level, meaning price may pull back to this area before continuing downward.
📉 Trendline Breakout (Bearish Confirmation)
A dashed trendline was previously supporting the uptrend but was broken, confirming the bearish shift in market structure.
This signals a trend reversal and a possible extended move lower.
3️⃣ Trading Strategy & Execution
A well-planned entry, stop loss, and take-profit strategy is essential for managing risk effectively.
📌 Entry Strategy (Short Setup)
Ideal Entry: Look for price to pull back to the neckline (previous support turned resistance).
Confirmation: Watch for bearish candlestick patterns such as:
Bearish engulfing
Pin bar rejection
Shooting star
Lower highs forming near the neckline
A rejection in this zone confirms seller dominance and a high-probability short setup.
📌 Stop Loss Placement
The Stop Loss is placed above the right shoulder at 0.006725.
This ensures protection from false breakouts or unexpected bullish moves.
📌 Profit Target Projection
Take-Profit Target: The projected move suggests a target at 0.006493.
This aligns with previous structural support, increasing its significance.
The measured move for Head & Shoulders suggests that price could fall further after confirmation.
Risk-Reward Ratio
The Risk (Stop Loss): Around 50 pips.
The Reward (Profit Target): Around 180 pips.
This results in a Risk-Reward Ratio of approximately 1:3, making it an attractive trade.
4️⃣ Market Sentiment & Expected Price Movement
📉 Bearish Scenario (Most Likely)
Price retests the neckline but fails to break above it.
Sellers step in, rejecting the resistance level, leading to further downside.
Price targets the next major support at 0.006493, completing the Head & Shoulders move.
📈 Bullish Scenario (Alternative)
If price reclaims the neckline and moves back above 0.006725, the pattern is invalidated.
This could lead to a bullish continuation back toward previous highs.
In this case, traders should cut losses early and avoid forcing a short trade.
5️⃣ Risk Management & Best Practices
1️⃣ Position Sizing:
Risk only 1-2% of your account per trade to maintain long-term profitability.
2️⃣ Confirmation Before Entry:
Wait for price to reject the neckline resistance before entering short.
Avoid entering too early without clear bearish signs.
3️⃣ Monitor News & Fundamentals:
Major economic events, interest rate decisions, or central bank announcements could impact JPY/USD price action.
🔎 Final Conclusion: Bearish Outlook on JPY/USD
The Head & Shoulders breakdown signals a trend reversal from bullish to bearish.
The neckline breakout confirms seller control over the market.
The best short entry is on a pullback to previous support (now resistance).
Target at 0.006493, with a Stop Loss at 0.006725 ensures controlled risk.
📢 Trading Bias: Bearish 📉
💡 Watch for a retest & rejection before entering short.

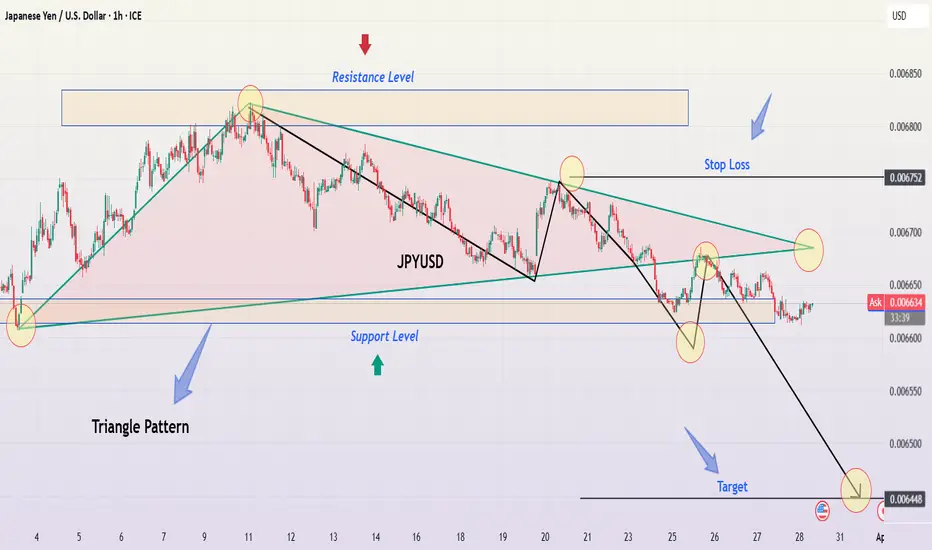
JPY/USD Descending Triangle Breakdown – Bearish Trading Setup📌 Overview: Understanding the Current Market Structure
This analysis focuses on the JPY/USD pair on the 1-hour timeframe, highlighting a well-defined descending triangle pattern, a classic bearish continuation setup. The price action indicates selling pressure increasing as lower highs form, while support remained relatively stable before ultimately breaking down.
This setup suggests a potential trend continuation to the downside, making it a compelling trade opportunity for short-sellers. Let's dive deeper into the technical breakdown, trading strategy, and market expectations.
📊 Technical Breakdown: Chart Pattern Analysis
1️⃣ The Descending Triangle Pattern: A Bearish Signal
The descending triangle is one of the most reliable continuation patterns in technical analysis, often leading to a breakdown when support is breached. This chart confirms the pattern through:
✅ Downward Sloping Resistance Line:
The price tested this level multiple times but was consistently rejected.
Lower highs indicate sellers are dominating and buyers are failing to push higher.
✅ Flat Support Level:
The price found strong support at a key horizontal level, bouncing off multiple times.
However, each bounce became weaker, signaling buyers losing strength.
✅ Breakout & Confirmation:
The final breakdown below support occurred with strong momentum.
The price has now turned previous support into resistance, a bearish confirmation.
🔎 Implication:
A descending triangle breakout to the downside often results in an extended downward move, aiming for the measured move target based on the triangle’s height.
2️⃣ Key Price Levels & Trading Zones
📌 🔴 Resistance Zone (Upper Triangle Boundary):
0.006700 – 0.006750
This level acted as a strong rejection zone, confirming lower highs.
It now serves as a resistance level after the breakdown.
📌 🟢 Support Level (Triangle Base):
This level previously held price from breaking lower multiple times.
However, with each bounce becoming weaker, it finally gave way.
Break & Close below this level confirms the bearish continuation.
📌 🎯 Target Projection (Based on Triangle Breakout):
0.006448 (Final Target) – This level aligns with historical price action and the triangle’s projected move.
📌 🚨 Stop Loss Placement:
Above the last swing high (~0.006752)
If price reclaims this zone, the bearish outlook becomes invalid.
📈 Price Action & Market Sentiment
3️⃣ Bearish Momentum & Breakdown Confirmation
✅ Lower Highs Indicate Weakness:
Buyers attempted multiple recoveries but were consistently rejected at lower levels.
This pattern suggests exhaustion in buying pressure.
✅ Breakout Candle Strength & Volume Confirmation:
The price broke support with strong momentum and increased volume, confirming sellers’ control.
A breakdown without volume is often a fakeout, but this chart shows clear momentum.
✅ Potential Retest Before Further Drop:
After a breakdown, price often retests the broken support before continuing lower.
A pullback to the resistance zone (~0.006650 - 0.006700) could offer an ideal short entry.
✅ Bearish Trend Confirmation:
The price remains below key resistance and continues forming lower lows.
The downtrend structure remains intact, reinforcing the bearish sentiment.
📉 Trading Strategy: How to Trade This Setup?
🔹 Entry Strategy:
Ideal Entry: Short after a pullback to broken support (~0.006650 - 0.006700).
Aggressive Entry: Short immediately on the breakdown if momentum remains strong.
🔹 Stop Loss Placement:
Place above last swing high (0.006752) to avoid being stopped out by noise.
Ensures protection against sudden bullish reversals or fakeouts.
🔹 Take Profit Targets:
✅ First Target: 0.006500 (Psychological level)
✅ Final Target: 0.006448 (Triangle measured move)
🔹 Risk Management:
Use a Risk-to-Reward ratio (RRR) of at least 1:2 for an optimal trade setup.
Never risk more than 2% of total capital per trade.
⚠️ Market Outlook & Key Watchpoints
📌 Scenario 1: Bearish Continuation (High Probability)
If price retests the broken support and faces rejection, expect further downside.
Target remains at 0.006448.
📌 Scenario 2: Fake Breakdown & Bullish Reversal (Low Probability)
If price closes above 0.006750, it invalidates the bearish setup.
In that case, a bullish move towards 0.006800+ is possible.
📢 Final Thoughts:
The bearish breakout is clear, but waiting for a proper pullback before entry is ideal.
Volume confirmation is crucial to avoid fakeouts.
If support turns into resistance, a high-probability short trade is set up.
🔹 What’s your take on this setup? Will JPY/USD reach its target? Drop your thoughts below! 🚀
#JPYUSD #ForexTrading #TechnicalAnalysis #PriceAction
JPY/USD 4H Chart Analysis – Head & Shoulders BreakdownThis JPY/USD 4-hour chart showcases a Head & Shoulders (H&S) pattern, a well-known bearish reversal pattern signaling a potential downtrend after an extended bullish run. The breakdown of the neckline support and the trendline breakout are key confirmations of a shift in momentum, making this a high-probability trading setup.
📌 1️⃣ Understanding the Head & Shoulders Pattern
The Head & Shoulders pattern is a classic reversal structure that forms after a prolonged uptrend. It consists of three peaks:
Left Shoulder: The first peak forms as buyers push the price higher, followed by a pullback.
Head: The price rallies again, making a higher peak, but sellers start to gain strength, causing another pullback.
Right Shoulder: A lower high is formed as buying pressure weakens, signaling exhaustion of the uptrend.
This pattern is significant because it suggests that bullish momentum is fading and that a potential trend reversal is underway.
📌 2️⃣ Trendline Breakout – Bearish Confirmation
Before the formation of the Head & Shoulders, the market was in a strong uptrend, supported by a rising trendline (dashed black line).
The price respected this trendline multiple times, acting as dynamic support.
However, after the right shoulder formation, the price broke below the trendline, indicating that selling pressure is increasing.
A trendline breakout after a reversal pattern strengthens the bearish case, increasing the likelihood of further downside movement.
📌 3️⃣ Key Resistance & Support Levels
Understanding the key price levels is essential for determining trade entries, stop-loss placements, and target zones.
📍 Resistance Zone (Stop-Loss Area):
0.006776 is the recent high and a key resistance level where sellers previously stepped in.
If the price reclaims this level, the bearish thesis could be invalidated, making it a logical place to set a stop-loss.
This level also aligns with the Head of the pattern, further reinforcing it as a strong supply zone.
📍 Support Level (Neckline Zone):
The neckline (horizontal support zone) was previously holding as support but has now been broken.
If the price pulls back to this area and rejects it, it could serve as a strong entry point for short trades.
A confirmed retest of the neckline would validate the breakdown, increasing the likelihood of a further decline.
📍 Bearish Target (Profit-Taking Zone):
The price is projected to decline toward 0.006457, which is derived by measuring the height of the Head & Shoulders pattern and projecting it downward.
This level also coincides with historical support, making it a strong take-profit area.
If bearish momentum continues, further downside targets may come into play.
📌 4️⃣ Trading Plan – Execution Strategy
This setup provides a clear structure for planning a high-probability short trade.
✅ Entry Strategy:
Option 1 (Aggressive Entry): Enter a short trade immediately after the breakdown of the neckline.
Option 2 (Conservative Entry): Wait for a retest of the broken neckline as resistance before entering a short position.
🚀 Stop-Loss Placement:
Above 0.006776 (recent resistance & Head of the pattern).
Ensures protection from a potential false breakout.
🎯 Take-Profit Strategy:
First target: 0.006457 (measured move of the pattern).
Extended target: Lower psychological support if momentum continues downward.
📌 5️⃣ Market Sentiment & Additional Considerations
While this technical setup suggests a bearish outlook, traders should also consider:
🔸 Fundamental Factors: Economic data releases, interest rate decisions, and geopolitical events can impact market sentiment.
🔸 Volume Confirmation: A high-volume breakout strengthens the bearish bias, whereas weak volume may indicate a potential fake-out.
🔸 RSI & Momentum Indicators: Checking if the RSI is in overbought territory or showing bearish divergence can provide further confidence in the setup.
🔸 Psychological Levels: Traders should watch for price reactions near key round numbers, as these often act as support/resistance.
📌 6️⃣ Conclusion – Why This Setup is High Probability
This JPY/USD 4H chart presents a well-defined Head & Shoulders pattern, a classic reversal setup that indicates a shift from bullish to bearish momentum. The trendline breakout and neckline breach reinforce the bearish bias, making this a high-probability short trade opportunity.
💡 Key Takeaways:
✅ A confirmed trendline break + H&S pattern indicates a bearish reversal.
✅ Watch for a neckline retest as a potential short entry.
✅ Bearish target: 0.006457 with stop-loss above 0.006776.
✅ Consider fundamental factors & market sentiment for additional confirmation.
🔽 Overall Bias: Bearish 📉
#JPYUSD #ForexTrading #HeadAndShoulders #PriceAction #TradingSetup #TrendReversal

JPY/USD Head & Shoulders Breakdown – Full Professional Analysis1. Introduction to the Chart Pattern
The JPY/USD chart on the 1-hour (H1) timeframe displays a well-defined Head & Shoulders (H&S) pattern, which is a well-known bearish reversal pattern in technical analysis. This pattern signals the potential end of the previous uptrend and the beginning of a downward move.
A Head & Shoulders pattern consists of three main components:
Left Shoulder: The price rallies to a peak, then retraces.
Head: The price rises higher than the left shoulder, marking the highest point before declining.
Right Shoulder: A lower peak compared to the head, indicating weakening bullish strength.
Neckline: The horizontal support level that, once broken, confirms the bearish trend.
2. Key Levels & Market Structure
🔹 Resistance Level (Supply Zone)
The blue box at the top represents the resistance area, where price action was repeatedly rejected.
This indicates strong selling pressure at this level, preventing further bullish momentum.
🔹 Support Level (Neckline)
The horizontal blue line acts as the support level or neckline of the H&S pattern.
Price has tested this area multiple times, confirming it as a crucial level for trend continuation or reversal.
🔹 Trend Line (Dynamic Support)
The black dashed trend line represents the previous uptrend, which provided support before being violated.
The break of this trend line suggests a weakening bullish structure and increased chances of a bearish move.
3. Breakdown of the Head & Shoulders Pattern
Initial Uptrend:
The market was in a strong uptrend before forming the Head & Shoulders pattern.
Buyers pushed the price higher, making higher highs and higher lows.
Formation of Left Shoulder:
Price reached a peak and then retraced, forming the left shoulder as sellers entered the market.
Formation of the Head:
A strong rally followed, breaking the left shoulder’s peak and reaching a new high, forming the head.
However, buyers started losing momentum, leading to another retracement.
Formation of Right Shoulder:
The price made another attempt to move upward but failed to surpass the head’s high, forming the right shoulder.
This signaled a reduction in bullish strength and potential trend exhaustion.
Neckline Breakdown (Bearish Confirmation):
The price dropped below the neckline (support level), confirming a bearish reversal.
This is the official entry signal for traders looking for a short setup.
4. Expected Market Behavior & Trading Setup
📉 Bearish Confirmation Steps:
Neckline Retest: The price might retest the broken neckline before continuing downward.
Bearish Candlestick Patterns: Look for rejection signals like bearish engulfing or shooting star formations.
Volume Increase on Breakdown: Strong selling pressure confirms the trend continuation.
🎯 Potential Take Profit Levels:
1️⃣ Target 1 (TP1): 0.006492 – This is a short-term support level, where the price might pause before further decline.
2️⃣ Target 2 (TP2): 0.006430 – A stronger support zone, where sellers may take profits.
🚨 Stop Loss Placement:
A stop-loss should be placed above the right shoulder to protect against false breakouts.
This ensures a favorable risk-to-reward ratio.
5. Risk Management & Market Conditions
✅ Entry Strategy: Wait for a retest of the neckline for a higher probability short trade.
✅ Risk-to-Reward Ratio: Ideally, aim for 1:2 or 1:3 to ensure profitability.
✅ Market Catalysts: Be cautious of fundamental news events, as they can cause unexpected volatility.
6. Conclusion: Bearish Outlook for JPY/USD
🔸 The Head & Shoulders pattern breakdown suggests a strong bearish trend reversal.
🔸 If the neckline holds as resistance, a short trade offers a high-probability setup.
🔸 Price may reach TP1 first, then potentially extend to TP2 if selling pressure persists.
📢 Final Verdict: Bearish trend confirmed; watch for short opportunities on retest.
📊 TradingView Tags:
#JPYUSD #HeadAndShoulders #ForexTrading #TechnicalAnalysis #BearishBreakout #ShortTrade

JPY/USD Technical Analysis - Head & Shoulder Chart Bearish Move1️⃣ Chart Type & Timeframe:
Market: Japanese Yen (JPY) / U.S. Dollar (USD)
Timeframe: 1-hour chart (H1)
Platform: TradingView
This is an intraday chart used by traders to identify short-term price action and trend reversals.
2️⃣ Identifying the Key Chart Pattern – Head & Shoulders
The dominant pattern on this chart is the Head & Shoulders (H&S), a well-known bearish reversal signal that forms after an uptrend. Let’s break it down:
A. Formation of the Pattern
Left Shoulder: The price forms a peak, then retraces down to a support level.
Head: A higher peak is formed, followed by another decline, indicating buyers are losing control.
Right Shoulder: The price attempts another rise but fails to reach the previous high, showing bearish momentum is increasing.
B. Neckline & Trendline Support
The neckline acts as a key support level. A break below it confirms the bearish move.
The trendline, which has been supporting price action for a while, is also at risk of breaking.
3️⃣ Key Support & Resistance Levels
Resistance Level (0.006750 - 0.006819):
This is the previous high area where sellers are active. A stop-loss is placed above this level.
Support Level (0.006567 - 0.006468):
Key demand zones where buyers may step in. These are the take profit (TP) levels.
4️⃣ Price Action & Expected Movement
📉 Bearish Outlook – A potential breakdown from the neckline and trendline would confirm further downside.
If price breaks the trendline, a pullback to retest resistance is expected before dropping further.
Take Profit (TP) 1: 0.006567 – Minor support, possible bounce.
Take Profit (TP) 2: 0.006468 – Stronger support, deeper correction possible.
🚨 Stop Loss: Above 0.006819, just beyond the right shoulder and all-time high (ATH).
5️⃣ Trading Strategy & Execution
💡 Entry Strategy:
Sell Breakout Entry: Short the market when the neckline/trendline is broken with strong volume.
Retest Confirmation: Wait for a pullback to the broken trendline and enter when price rejects it.
📌 Risk Management:
Risk-to-Reward Ratio: 1:2 or higher for an optimal setup.
Use trailing stop-loss to secure profits if TP1 is hit.
6️⃣ Market Psychology & Smart Money Behavior
The Head & Shoulders pattern reflects buyer exhaustion and increased seller strength.
Smart money often enters after the breakdown when weak hands get stopped out.
Conclusion: Trade with Confidence!
This chart presents a high-probability bearish trading opportunity based on a textbook Head & Shoulders formation, support/resistance dynamics, and trendline analysis. A disciplined approach with risk management will ensure better execution.
📉 Final Verdict: Bearish Breakdown Expected – Sell the Retest!
🔥 Tags for TradingView Idea:
#JPYUSD #ForexTrading #HeadAndShoulders #TechnicalAnalysis #BearishReversal #SmartMoney #PriceAction #RiskManagement #TradingSetup #TrendlineBreak

Short I just opened three short positions.
I waited for the price to come back to the fair value gap area that was created a few days ago (blue rectangular box in the chart).
Please look at my previous publication on JPYUSD short positions. It explains the reasons for short entry. It is linked to this one.
Entry: 149.40
S/L: 150.183
Target 1: 148.272
Target 2: 147.547
Target 3: 146.707

JPY/USD - Bearish Breakdown from Ascending Channel
📉 Market Structure:
The pair has been trending upwards inside a well-defined ascending channel. However, price is now testing the lower boundary of the channel, indicating a potential breakdown. A confirmed break below this support could trigger a bearish move.
🔍Key Levels:
Support Zone: 0.0068122 (Channel Support)
Current Price: 0.0067279
First Target: 0.0065703
Second Target: 0.0064390
📊 Trade Idea:
A confirmed break below the channel support could signal further downside.
If price rejects from this level and starts falling, a short opportunity may be considered targeting 0.0065703 and then 0.0064390.
Traders may look for bearish confirmation before entering short positions.
🚨Confirmation & Risk Management:
Bearish Confirmation: A strong break below 0.0068122 with volume.
Invalidation: A strong bounce from support and a move back inside the channel.
Risk Management: Stop-loss can be placed above 0.0068122 to protect against false breakouts.
This setup suggests a potential trend reversal if price fails to hold the channel support. Traders should watch for confirmation before executing trades.

USDJPY R2🔍 Technical Analysis of USD/JPY
📌 Overall Trend:
After a downward correction, the price has reached the 154.250 support zone.
A positive reaction at this level suggests a potential upward move.
A price gap is visible in the 156.000 - 156.400 range, which may lead to a price increase to fill the gap.
📈 Buy Trade Signal (Long Position)
🔹 Entry Conditions:
If the price holds the 154.250 - 154.400 support zone and bullish reversal candlesticks appear, a long trade is recommended.
The ideal entry range is 154.600 - 154.860.
🔹 Stop Loss (SL):
Below 154.250
🔹 Take Profit (TP):
First target: 155.860
Second target: 156.110
Third target: 156.400 (if the bullish momentum continues)
🔹 Risk Management:
If the price stabilizes below 154.250, reconsider the trade.
Breaking above 156.110 increases the likelihood of further bullish movement to fill the price gap.
✅ Final Conclusion:
If the price finds support at 154.250 - 154.400, a buy trade is favorable.
A breakout above 156.110 could lead to a further target of 156.400.
📌 Ensure confirmation through price action and candlestick patterns before entering the trade.

Usdjpy ahead to 147.65Jpyusd ahead to 147.65, by my math, at least, maybe a little down more to make a divergence to go up again, but this is all about day ind3x, about dollar power, be careful, with and without the election day, I'm just selling and do nothing (seeing what happens) until election day
Have a good trading, everyone.

USD/JPY: Yen Strengthens Amid Policy ExpectationsThe Japanese Yen gains support from anticipated BoJ policy shifts, fostering a safer environment and limiting USD/JPY within lower USD demand. Investor focus on US economic data before FOMC minutes remains crucial.
Technically, breaching the 200-day SMA signals a USD/JPY downtrend. Daily chart indicators suggest potential further losses. Any upward movement could prompt selling near 142.00, leading to short-term profit-taking around 142.40 and targeting the 200-day SMA at 143.00.
Support lies at 141.00, guarding against declines toward recent lows near 140.25 and the psychological level of 140.00. A firm break below 141.00 may accelerate a decline towards 139.35, aiming for levels near 139.00, 138.75, and 138.00 (the July 28th low).

USD/JPY Approaches 141.30, Extending Two-Day Decline USD/JPY continues its downward trend for the second consecutive session, trading below the 141.30 level during the Asian hours on Thursday. Improved trade data from Japan in November has exerted pressure on the currency pair. However, less optimistic remarks from Bank of Japan Governor Kazuo Ueda may weigh on the Japanese Yen.
From a technical standpoint, the spot price indicates potential recovery below the 142.00 level and appears to have broken the two-day decline. This suggests that breaking below the 200-day Simple Moving Average (SMA) is crucial support for bearish traders. Furthermore, oscillators on the daily chart remain deeply in negative territory, indicating limited resistance for USD/JPY on the downside. Any subsequent upward movement may still be viewed as a selling opportunity and is likely to be capped around the 142.75 level (200-day SMA). This implies that further buying activity leading to a move beyond the 143.00 level could trigger short-covering actions, allowing the bullish camp to reclaim the 144.00 milestone.
On the flip side, weakness below the Asian session's lowest levels around the 141.90-141.85 region would reaffirm the short-term trend and make USD/JPY susceptible to retesting below the 141.00 level, or the multi-month lows touched last week. Subsequent declines could potentially pull the spot price towards the intermediate support at 140.45 on the way to the psychological level of 140.00.

Japanese Yen Weakens on Soft Inflation, BoJ Policy UncertaintyThe Japanese Yen (JPY) faced a decline after softer domestic consumer inflation data, raising uncertainties about the Bank of Japan's (BoJ) potential policy tightening. BoJ's October meeting minutes revealed a consensus to maintain the accommodative policy, contributing to JPY weakness. The USD/JPY pair saw a modest recovery from weekly lows, supported by the USD's modest strength.
Japan's core CPI remains at 2% for the 20th consecutive month, and optimism about future wage growth suggests a potential shift in BoJ's stance. However, the market anticipates a more positive U.S. Federal Reserve (Fed) policy easing in 2024, influenced by the U.S. Q3 GDP report. Investors are now watching the U.S. Core PCE Price Index for further guidance on USD/JPY short-term direction. Despite this, the fundamental outlook leans towards JPY strength, indicating a downside bias for the currency pair.

Japanese Yen Retreats on Soft Inflation, USD StrengthensFrom a technical standpoint, spot prices indicate a potential rebound below the 142.00 level, seemingly breaking the two-day downtrend. This suggests that the overnight break back below the 200-day Simple Moving Average (SMA) is crucial support for bearish traders. Furthermore, oscillators on the daily chart remain firmly in negative territory, indicating minimal resistance for the USD/JPY pair on the downside. Therefore, any subsequent upward move may still be considered a selling opportunity and remains capped near the 142.75 level (200-day SMA). This implies that further buying activity, leading to a move beyond the 143.00 mark, could trigger short-covering actions and allow the bullish camp to reclaim the round figure of 144.00 in the short term.
On the flip side, weakness below the intraday low around the 141.90-141.85 region would reaffirm the short-term trend, making the USD/JPY pair vulnerable to a retest of the sub-141.00 level or the multi-month lows touched last week. The subsequent decline could potentially drive spot prices towards intermediate support at 140.45 on the way to the psychological milestone of 140.00.

"USD/JPY: Japanese Yen Halts Decline, Eyes US CPI Data"The Japanese Yen regained positive momentum in the Asian trading session on Tuesday. USD/JPY partially eroded some of the strong recovery seen in the past two days. Investors are awaiting the US Consumer Price Index (CPI) for fresh impetus ahead of the FOMC meeting on Wednesday.
From a technical standpoint, USD/JPY showed a certain degree of recovery last week at the crucial 200-day Simple Moving Average (SMA). The subsequent move exceeded the 23.6% Fibonacci retracement of the recent decline from the vicinity of 152.00, or the YTD high, supporting bullish sentiments. However, the sharp rise during the day halted near the 200-hour SMA, now closing around the 146.50 level. This area will now play a crucial pivot point, and clearing it would allow the price to test the 50% Fibonacci level, around 146.80, and reclaim the 147.00 milestone.
Meanwhile, oscillators on the daily chart are deep in positive territory, supporting the potential for some upward action at higher levels. This suggests that the resistance at the 100-hour SMA, around 145.85, may now act to defend the downside just ahead of the psychological level of 145.00. Further selling pressure could push USD/JPY back towards the intermediate support zone of 144.55-144.50 on the way to the 144.00 mark. A convincing break below this level would be considered a strong bearish catalyst, paving the way for deeper losses.
On the other hand, the Japanese Yen (JPY) extends its downward trend for the second consecutive day, pushing the USD/JPY pair towards the 146.00 level during the European trading session on Monday. A report on Friday suggested that comments from Bank of Japan (BoJ) Governor Kazuo Ueda last week were misunderstood, and the central bank will maintain the status quo until positive wage inflation begins. This comes alongside weaker-than-expected GDP reports from Japan, indicating the domestic economy remains fragile and expectations of imminent rate hikes may be inflated.
Conversely, the US Dollar (USD) attracts some renewed buying interest after betting on an early Federal Reserve (Fed) policy easing was scaled back, proving to be another supportive factor for the USD/JPY exchange rate. Friday's closely watched US employment figures showed a rapid growth pace in November, with the unemployment rate dropping to 3.7%. This indicates signs of underlying strength in the labor market and suggests that current market pricing for a rate cut in March 2024 may be premature.
The recent sharp upward move seen around the USD/JPY pair in the past hour may be attributed to some technical buying based on sustained strength beyond the 100-hour Simple Moving Average (SMA). This suggests that concerns about a deeper global economic downturn and geopolitical risks may limit losses for the safe-haven JPY and restrict any further upside moves for the currency. Traders may also limit strong bets ahead of this week's significant event/data risks - US Consumer Price Index on Tuesday and the crucial FOMC policy decision on Wednesday."

USD/JPY Weakens on Fed Rate Cut Speculation and BoJ PivotThe Japanese Yen has surrendered recent gains against the US Dollar amidst speculation of a Fed rate cut in March and a shift in the Bank of Japan's (BoJ) policies. Despite a day-end recovery, USD/JPY experiences one of its worst trading days in over a year, dropping below 142.00 and closing just above 144.00.
Despite the intraday recovery, USD/JPY had one of its worst trading days in over a year, slipping below 140.00 in November last year. Throughout Thursday's trading session, USD/JPY transitioned from a slight decrease to a drop below the 200-day Simple Moving Average, requiring significant progress for a recovery towards the 147.00 handle. The 50-day SMA is currently positioned higher than the price action on Thursday, pushing towards the 114.90 region.
Expectations of a Fed rate cut weigh on the US Dollar
There is growing speculation that the Federal Reserve has concluded its rate hikes and will commence a rate cut in March, putting pressure on the US Dollar. In contrast, the Bank of Japan is expected to move away from extremely loose monetary policy in the coming months. This, coupled with risk aversion sentiment, offsets the safe-haven appeal of the Japanese Yen.
USD/JPY witnessed a more than 4% decline on Thursday, quickly dropping below 142.00 before larger markets staged a modest recovery, pulling the Japanese Yen (JPY) back into a reasonable price range. USD/JPY closed Thursday down by around 2%, while the Yen entered Friday's market session in the green for the week.
The Yen saw a broader market recovery following unconventional comments from Bank of Japan Governor Kazuo Ueda, unexpectedly hinting at the eventual end of BoJ's negative interest rate policy, possibly in the early part of next year.

"JPY Surges to Three-Month High Against USD"The Japanese Yen extended its robust upward momentum against the US Dollar on Friday and kicked off the new week with a positive sign, pulling the USD/JPY pair to a nearly three-week low around the 146.25-146.20 range during the Asian trading session. The US Dollar is attempting to recover from its lowest point in two and a half months at 146.65, supported by a slight rebound in US Treasury yields, which is exerting pressure on the Japanese Yen.
On Thursday, New York Fed President John Williams suggested that interest rates could reach their highest point, supporting this perspective. In this context, the analysis of Fed Chairman Powell's conference later today will be closely scrutinized to evaluate the central bank's next steps.
On the other hand, growing expectations that the Bank of Japan may move away from its extremely accommodative monetary policy by 2024 are providing some support for the JPY.
From a broader perspective, this currency pair maintains a downward trend from its mid-November high near 152.00, with a resistance level at 148.75 likely to limit the upward movement before the late November peak at 149.75. Support levels are identified at 147.77 and 146.65.

Japanese Yen's Caution Amid USD/JPY Trends and US PCE DataThe Japanese Yen continues to exhibit relative strength amid hawkish expectations from the Bank of Japan (BoJ). Bets on a series of Fed interest rate cuts in 2024 are dampening the USD and weighing on USD/JPY. Bearish speculators are becoming cautious, eagerly awaiting the release of the US Personal Consumption Expenditures (PCE) Index data later this Thursday for fresh market impetus.
From a technical perspective, USD/JPY has shown potential for a recovery below the 100-day Simple Moving Average (SMA), signaling caution for trend-following traders. This indicates that daily chart oscillators are deeply entrenched in negative territory but still far from oversold levels. Conversely, this suggests that the path of least resistance for spot prices remains downward, and any meaningful recovery attempts could be viewed as selling opportunities.
Meanwhile, Wednesday saw the USD/JPY touch multi-month lows around the 146.65 region, seemingly defending immediate weakness. Below this level, USD/JPY could swiftly push the downside momentum towards the psychological 146.00 mark. On the flip side, the 147.30-147.35 region may act as an immediate barrier ahead of the high overnight volatility, around the 147.90 area and the 148.00 mark. Any further upward movement may attract new sellers and remains constrained near the strong horizontal support-turned-resistance level at 148.30.
In summary, caution prevails in the face of the Japanese Yen's bullish trend, with the focus shifting to the US PCE data for potential market catalysts. Technical indicators suggest a bearish bias for USD/JPY, with key support and resistance levels influencing the near-term trajectory.

USD/JPY Hits Six-Week Low Near 148.50, Faces Key SupportThe USD/JPY pair remains under selling pressure for the fourth consecutive day, reaching its lowest point since October 4 during the Asian trading session on Tuesday. However, the spot price has slightly rebounded in the past few hours and is trading around the 148.00 level.
USD/JPY continues to trade near its lowest level in six weeks, extending losses to around 148.90 in the early European trading session on Monday. The key level of 148.50 emerges as immediate support, aligning with the Fibonacci retracement level of 23.6% at 148.49. The 14-day Relative Strength Index (RSI) below 50 signals a bearish sentiment, potentially inspiring bearish moves towards the support zone around 146.50, followed by the Fibonacci retracement level of 38.2% at 146.37.
Moreover, the Moving Average Convergence Divergence (MACD) line is positioned above the centerline, showing divergence below the signal line, often indicating a downward price trend. This configuration suggests that the short-term moving average (MACD line) is moving further away from the long-term moving average (signal line) in a downward direction.
On the flip side, the psychological level at 150.00 may act as a significant barrier, corresponding with the 9-day Exponential Moving Average (EMA) at 150.34. A breakthrough above this level could support a USD/JPY rebound towards last week's high at 151.90.
