Bullish Harami - FSRA Bullish Harami has formed on JSE:FSR which is a bottom reversal signal. It has triggered our long position and we have a target at around the 64.40 level. There is however, a gap that needs to be closed at around the 61 level. Be aware of this, as it may close the gap and come down instead of continuing upward.
Jse

BAW LONGKEY LEVEL BREAK ABOVE 100 could go higher.
Level of support around 90 this could play out nicely.

Choose your loss buy or sell We are currently in a very difficult trading environment for the JSE ALSI 40 (and the stocks in the index) and I believe world wide (with most markets).
This sideways movement has been going since July 2022...
The world is in a rut with major issues like high inflation, ongoing interest hikes, currency collapses, US dollar strength, UK economic collapse, East wars and COVID recovery.
Our hands are unfortunately tied, how long this will last and what the damage will be (drawdown wise). But we will control it with lowering our losses from 2% to 1.5%. This will all be guided through a process until we overcome it...
But it's part and parcel with trading and it's something that is very common on a yearly basis...
HOWEVER! This is crucial to understand as a trader.
Since the derivative markets, the algorithm of movement (between buying and selling) has changed drastically.
From the markets moving in strong trends (70% of the time) from 1940 - 2007 where a monkey could have thrown a dart and profited from any Blue Chip stock for 20 years.
To now we are seeing the markets trend around (20% of the time, if that) from 2007 -2022.
We have no choice but to make the stop loss and take profits prices tighter and to hold for less period of time.
This will be a patience game but will be worth it in the end.
Only those strong enough to stick around and act accordingly with their correct risk management will reap the rewards.
What are your thoughts?

Tigerbrands next run up to ATHLarge Tripple Bottom
There are also two Cup and Handles formed in the recent past.
Now that price has broken above both Brim levels it's looking bullish.
RSI> 50 and above the downtrend line.
Target R219.05
CONCERNS
Liquidity is low and it causes spikes in prices.
Such a large formation, can sizzle out the price move and it can continue sideways for the next few months.
We have our 7 week time stop loss so let's go.

Richemont Short Formed W Pattern - Upside to comeShort formed W Formation
This is where the Right rounding bottom is higher and makes higher lows than left rounding bottom.
The RSI is above 50 and has broken its downtrend.
Target R205.60 to begin with...
Do you agree?

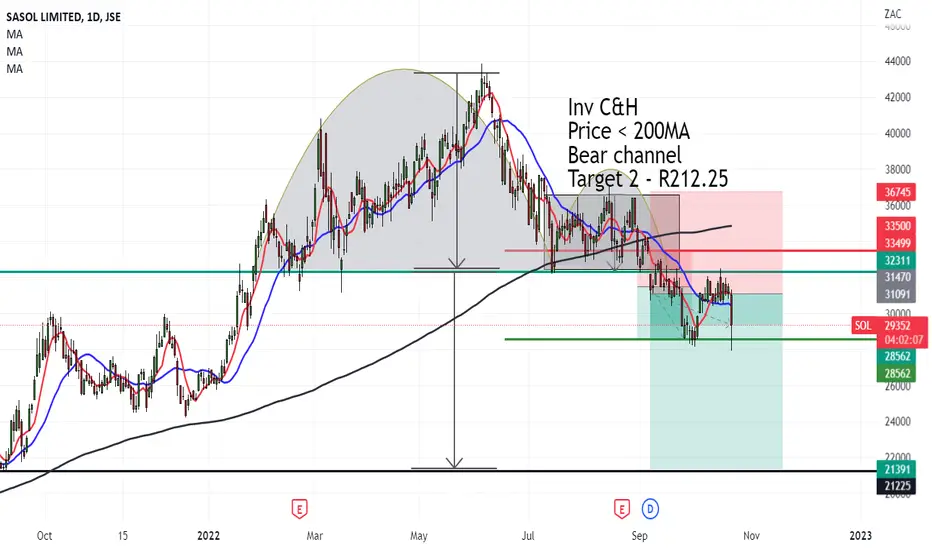
Sasol tanking to R212Inv C&H formed a while ago.
We went short when the Rectangle Pattern broke down and banked a profit.
But now that the price is staying in the downchannel, tells us there is more downside to come.
EXTRAS:
Price < 200MA
Bear channel
Target 2 - R212.25
$STXRES Satrix Resources. Testing channel support (again)This channel is holding up pretty well with the top and the bottom of the channel being tested multiple times.
Best case scenario is support holds up once again and and we test the top of the channel
Worst case is this ends up being a bear flag, support breaks to the downside and we test support levels lower down (blue lines)
If you go long, impliment a stop loss. This is a bear market after all.

Dischem not feeling well - chart wise INV C&H or Descending triangle
RSI <50
Wait for the brim level break
Bearish bias
CONCERNS: The liquidity is low and high volatility which can cause the market to gap 10% on any given day. These are risky assets to trade.

Combined Motors showing upside but BAD liquidity Terrible liquidity of a stock.
The bias is bullish with higher lows and a Cup and Handle in the process...
We still need to price to break above the brim level, before we confirm the upside.
RSI is below 50 - which is not great but considering the high volatile low liquid nature of the stock, we can only expect it to move like this.
I remain optimistic and bullish with this...

Redefine prediction analysis bullish Potential Inv H&S
Price touching 200MA
RSI>50 and downtrend
Target R4.83
Bullish and awaiting a potential buy signal...

Mr Price shaping up nicely for a longMR Price is potentially forming a W Formation.
THe RSI is making higher lows and has broken the downtrend - Bullish momentum.
The target could be R240...
CONCERNS:
The downtrend is still evident with a downtrend line dominating and negative Moving Averages.
If the price turns up things will look brighter.

MONDI Strong W FormationMARKET: Mondi ( MNP )
TYPE: Long (buy)
ENTRY: R288.42
STOP LOSS: R264.28
TAKE PROFIT: R324.76
REASON: W Formation
Breakout of medium downtrend
Moving average 7>21 - Bullish
Medium probability trade

AB Inbev - Potential LongJSE:ANH is showing signs of a potential long position based off of our momentum strategy. That means the stochastic has crossed up, the MACD has crossed up and the 3 and 15 EMA's have crossed in an upwards direction.

City Lodge crashing down to R2,29Rising Wedge broken down
Inv C&H broken down
From the previous major fall, it seems like buyers and volume of demand is just not weighing up.
I can see this stock crashing down to the next target R2.29
What do you think?

Jubilee to run up in the near futureBullish Falling wedge
Right now Jubilee is still in a range (Falling Wedge)
The sign that it'll break up is based on the previous uptrend. Price has been coming down but on a very low range and it doesn't seem quite convicing.
I want to say if the price breaks up we could see a target of R4.23
CONCERN
If the price breaks down, we could also see a target of R1.18
The analysis is neutral right now, but I'm leaning more to the long (bullish) side.

PAN AFRICA Neutral analysis but hoping upSymmetrical Triangle
Equal chance of a breakout.
Break up - Target R6.04
Break down - target - R1.00
NEUTRAL ANALYSIS
I do have hope for Pan Africa as it's one of the rare companies that deal with innovative technology for gold extraction. Also with inflation kicking in, this will pick up the price of gold which could help gold companies who are exporters.
I want to guess the break will be up, but we can only know when it happens.

Glencore buying the hedgeCHALLENGE TRADE IDEA:
MARKET: Glencore (GLN)
TAKE PROFIT: R120.00
REASON: Bullish Diamond formation with rising lows on RSI.
What are your thoughts?

AFRIMAT falling on the floor Afrimat has formed another unusual and rare breakout pattern - Reverse Inv Cup and Handle.
This is where the handle is on the left and the cup is on the right...
The fact that the price has broken below the brim level and the RSI is making lower highs and is below 50, means there is further downside to come.
Looks like R22.00 is on the cards for the stock.

Naspers retested and now coming down CHALLENGE TRADE IDEA:
MARKET: Naspers (NPN)
TAKE PROFIT: R1516.90
REASON: Bearish Symmetrical Triangle and lower highs on RSI
What are your thoughts?

MC Mining heading back down MC Mining tested the highs > R7.40 and selling pressure and supply kicked in strongly.
It looks like the price is heading back to R1.25.
Sorry for the investors who are long, I'm just basing it on Technical analysis...
And I hope I'm wrong.

ABSA Broken below Symmetrical Triangle BearishCHALLENGE TRADE IDEA:
TAKE PROFIT: R161.91
REASON: Bearish Symmetrical Triangle, Price has tested the resistance and has failed. With inflation coming out today, my cards are on higher inflation which will lead to higher interest rates and a fall in banks and other markets.
What are your thoughts?

Bullish Engulfing on ExxaroA bullish engulfing candle pattern has formed on JSE:EXX . This is a bottom reversal signal, so we could see a move up to around the R22 level.

BTI - long triggeredA long position has been triggered on JSE:BTI based off of the turning of the MACD and the stochastic as well as the crossing of the 2 EMAs.
