Oh no Mr Market not this shenanigan again! We've started off the year of 2024 the same way we started in November 2022.
In a sideways range with a high of 75,000 and a low of 63,000.
This is very disappointing and tough for position and swing traders who mainly focus on the JSE stocks.
What can we do this year to help ride up and down the range? I can give some ideas but it's up to your trading personality and risk profile how to go about it.
Some ideas are.
1. Lower your risk and reward price expectations.
2. Look into intraday trading the JSE ALSI 40
3. Make use of the trailing stop loss more
4. Risk less per trade when the market is really just volatile
5. Diversify into other markets and bite the bullets
So, analysis wise I guess the JSE will want to go back to 75,000. Any trader can see a rectangle and guess the range movement for the year.
What are your thoughts?
What we really need is a breakthrough and a breakout.
Jsealsi40

JSE ALSI Target set to 80,000!As expected, the JSE ALSI consolidated a handle and the price broke up and out of the brim level.
This aligned with the upside of the Santa Claus Rally along with the resource rally.
We also have the January Effect that will continue to push the price up.
We have an aggressive entry on the longer time frame, and others will wait for a pull back to the brim before buying up.
So the target remains at 80,000.

Tough year for JSE ALSI Positions TradersIt's been a very tough year for swing traders.
Go long the market drops. Go short the market rallies.
Don't do anything and you save from the burn.
But in the bigger scheme of things, it looks like we are in an accumulation phase.
The accumulation phase is a period in which smart money (informed and experienced traders or institutional investors) is believed to be accumulating a particular asset while it is still relatively undervalued.
This phase occurs before a notable uptrend or bullish move in the market.
Key characteristics of the accumulation phase include:
Sideways Movement:
Prices move within a trading range, often forming a base or a consolidation pattern.
The range represents a period of equilibrium between buying and selling forces.
You can see the JSE ALSI has been in a tight range this entire year.
Decreasing Volume:
Volume tends to decline during the accumulation phase, indicating a decrease in overall market activity.
Lower volume signals that the asset is not attracting significant attention from the broader market.
There have not been huge orders on the JSE ALSI like other years. It could be because there are LESS investors buying shares and more going into derivatives and margin trading.
Or because they are worried about the state of the economy with load shedding, foreign direct investments pulling out, the country being rated down or people fleeing the country.
Smart Money Accumulation:
Informed traders or institutional investors quietly accumulate the asset during this phase.
Their accumulation is not typically evident in the overall market activity due to the relatively low volume.
Now with December, we could see investors piling into trades from their bonuses, offsetting taxes, preparing for the next year or with optimism with the festive season.
Transition to Markup Phase:
After a sufficient accumulation, there is an expectation that the asset's price will break out of the trading range.
This breakout marks the end of the accumulation phase and the beginning of the markup phase, characterized by a sustained uptrend.
So, my hopes and bets are UP.
I think once we break out above the range, we could see the JSE ALSI rally a good 10 -20%.
But geez, we need strong catalysts to kick in.
Even if it's international markets helping us run up with Dual LIsted companies or America's leading influence.
WHat are your thoughts? You think we'll get our long waited for rally?
Traders and investors who stay in the game will reap the rewards.
Patience is a traders virtue.
Impatience is the reason why traders quit. They don't FAIL - THEY QUIT.
Until then trade well...
T

DRD Gold Laggard but ready to shoot up - R24.65W Formation is forming on DRD Gold.
It's been a slow process, considering how many gold stocks have been outperforming the index itself.
But we are seeing signs that it's nearly DRD Gold time to shine...
The price is close to the neckline which needs to breakout. We also need to see a confirmed close and strong move above the 200MA.
The target remains at R24.65
ABOUT THE COMPANY
1. Company Overview:
DRD Gold Limited is a South African gold mining company.
DRDGold Limited, also known as Durban Roodepoort Deep Limited, is a mid-tier, unhedged gold producer and a world leader in surface gold tailings retreatment.
The company was established in 1895 in South Africa, making it one of the oldest continuously operating mining companies in South Africa.
2. Operations:
DRD Gold's primary operations are centered around gold recovery from surface tailings.
The primary business of DRDGold is the reclamation and processing of residual gold from old mine dumps.
Their largest operation, Ergo Mining Proprietary Limited (Ergo), has a vast footprint on the western and eastern sides of Johannesburg, a region marked by many years of gold mining.
This area is known for having some of the most substantial gold deposits in the world.
3. Focus on Tailings:
The company is known for its expertise in the retreatment of gold-bearing surface tailings.
4. Location:
The company's operations are likely to be situated in the Witwatersrand Basin in South Africa, a region historically rich in gold deposits.

JSE ALSI Rally on track to 76,185 with Interest Rate out the wayCup and Handle and Triple Bottom has formed on ALSI over the past two months.
Sentiment has been turning bullish with international factors.
On the one hand, America has paused interest rate hikes which is leading to a global rally.
Four main reasons why a drop in Interest rates causes a market rally namely:
1. Cheaper borrowing for companies
2. Higher company profits and less cost for repaying debts
3. Better Investment Returns for investors exiting from their low interest bearing assets
4. More spending by consumers
On the other hand South Africa's Interest Rate:
The South African Reserve Bank kept the repo rate at 8.25% ... this means the prime lending rate of commercial banks also remains unchanged at 11.75%.
So we are enjoying the rally and we are slowly weeding out of the shorts as the market is trying to choose an optimistic direction.
It's been a very tough environment and those who followed strict money management rules, suffered less. But whent the market does rally or at least choose a solid direction, we will be in it for the medium to long run.
Remember “MARKETS TAKE MONEY FROM THE IMPATIENT RISKY TRADERS AND GIVES IT TO THE
PATIENT RISK AVERSE TRADERS”
Other signs are also showing upside to come:
7>21 - Bullish
Price<200MA - test
My first very positive target and might be over stretched is 76,185.
What do you think?

JSE ALSI 40 playing catchup with with AmericasNasdaq and Dow Jones have been leading the pack with the indices.
And now it looks like the JSE ALSI 40 is about to catch up.
It's broken above the downtrend since 1 August 2023 and is showing upside to come.
During the process, it's formed an Inverse Head and Shoulders. The right shoulder is not the most attractive with the neckline, but it's the overall bullish price action that is leading it.
Also we see a short term uptrend with the 7>21MA.
However, the big test will be the price testing the 200MA.
The RSI is also showing upside momentum.
If all goes well we could see the first target at 78,847.
It's important to hedge the positions accordingly and remember anything can happen.
Hence the risk should be smaller than usual.

JSE ALSI has chosen a direction - DOWN M Formation has been forming since January 2023.
We had a break up, test and it failed.
THe market has continued to make lower highs showing the sellers and supply have domninated the market.
It's important to hedge shorts during these times and ride the markets down.
Other indicators show downside:
7=21
Price<200
RSI<50
Target 56,483

Most difficult trading environment since 2011I've been trading since 2003.
And if you're a position (swing trader , medium term) trader, you'll know there comes a time where the markets flow in a difficult range...
There are two types of markets when it comes to strategies.
Favourable and Unfavourable.
Right now, I don't mean to speak for everyone else, but I believe the markets are in an unfavourable territory for medium term traders.
Initially, I was blaming the JSE ALSI 40 (South African) index.
I blamed the Load Shedding (cutting of electricity)
Incompetency of the government providing sufficient water and services
I blamed us being downgraded to grey (which has pushed out Foreign direct investments).
I blamed the low liquidity and volume and the blame game kept going on...
But then I realised something even more problematic.
This horrible market environment has not only been for the JSE ALSI 40... It's been for the ASX (Australia), CAC40 (France), DAX (Germany) and even UK 100 (FTSE 100)...
And I'm sure there are a lot more stock markets that have had this tight and ongoing range...
So, what market environment are we in at the moment.
It's not going up so it's not the Mark-up phase
It's not going down so it's not the Mark-down phase
We can either call it Accumulation or Distribution, but it's been moving in a sideways range for obver a year.
So clearly we are in a larger market environment, which is known as the capitulation stage.
The volumes are low worldwide, the prices are erratic and volatile.
Many traders and investors are holding tight onto their money and not even dabbling into these markets at the moment.
How long will this last?
Well in 2011, it lasted two years. And right now, we are not seeing any strong signs of change yet...
So what do we do?
Well I don't have the holy grail nor some incredible points. But I can share what I'm doing during these timultuous times...
1. I've reduced my risk to 0.5% to 1% per trade (Instead of 2%).
2. I'm always hedging with Longs and Shorts
3. I'm trading other markets (Forex, Indices and intraday trades).
4. The drawdown isn't bad so I haven't halted trading
5. I've come to terms that this is the new normal for the next year or too.
Expect disppointment and you'll never be disappointed. You learn a thing from Marvel Movies now and then...
What are you doing and can you relate to these difficult trading conditions right now?
What are your thoughts on the matter?

JSE ALSI fools us again - New target up to 74,748?Once again the imfamous Mr Market JSE has fooled us again...
After the 1 year twilight zone of going no where, the price broke below and entered into a BEAR MARKET...
However, it lasted literally 7 days before jumping right back into the range...
It's not only broken above the downtrend line, the price is testing the support, which could form potentially a right shoulder...
If this plays out, it will break above the neckline and will continue up to 74,748.
I am heavily invested in longs and shorts. And the balance of finding what works in the market is a challenge but at least, we are not losing a lot of funds....
It's crucial to preserve and protect what you have during uncertainty and not to focus on making money but looking after what you have by means of diversification and hedging...
This can last as long as it needs to. I'm bullish on the JSE right now.

RAUBEX still undecided but seems to want to rally to R40.10Rectangle pattern formed on Raubes.
The price still hasn't broken up or down. But the signs are more bullish despite the negative sentiment with the JSE ALSI...
However, it is a waiting game until there is a solid breakout to the upside.
Other indicators show up momentum...
7>21>200
RSI>50
Target R40.10

JSE ALSI 40 has one hurdle to break before downsideJSE ALSI 40 is currently testing its November 2022 Support (which was resistance).
The price will need to break below to get traction to the downside.
It can take a few days and for bulls and bears to fight this one.
But we'll see. If it breaks down there is a decent target 59,369/
My bias is indeed down, but there does need a strong catalyst to break this.

JSE ALSI 40 chosen a direction? - DOWN! Bearish Symmetrical Triangle has been in the making since 17 November 2022...
However, the last few months, the JSE has just not been able to break above it's most recent declination resistance.
Instead, it's for the first time, broken below the formation - showing the bears are really starting to win.
How long will it last we don't know. But it looks like the JSE ALSI 40 has chosen a direction and it's down.
Other indicators confirm.
200>21>7 - Bearish
RSI<50 - Bounce on resistance
Target 59,428

JSE ALSI follows Friday's action and makes a breakout and fakeouJSE ALSI 40 - Update
We've seen the ALSI 40 form a restriction range between 70,122 and 67601.
It broke above the downtrend on Friday, just to come back down and form a fakeout following Americas downside on Friday night.
As most Premium know. Monday is a choppy day with no definitive chosen trend and so we'll let it choose a direction first before making any decisions.
It's these times where it's good to be hedged with longs and shorts during this timulteous time. I'll let you know...

JSE ALSI 40 showing leading signs of downside to 60839M Formation has formed on the JSE ALSI 40.
While the SP500, Dow Jones and Nasdaq have been going up this year, it strangely looks like the JSE ALSI 40 has broken it's correlation.
Not only has America NOT been leading the JSE, it seems like the problems (economically and politically and socially) are showing signs for the country.
Now, either we get another fakeout and the market moves back up and goes "Tricked you again" as it's done this entire year.
Or this is the break down and start of major downside to come for the rest of the month.
Other indicators are showing downside momentum.
21>7
Price<200
RSI<50
Target will be 60,839.
What do you think? Will we get a bounce up or a crash from here?

JSE ALSI 40 testing support before further upside to 75,000?The JSE ALSI 40 is retesting the support from the breakout from the broadening formation...
We need this level to hold to continue the upside.
America got downgraded from AAA to AA+. This might cause turblence with the upside to come.
We'll have to let the panic settle and for the bulls to continue fighting for the upside support.
I'll let you know.

JSE to hopefully break above the Vuvuzela formation T to 75,000This week I remain an optimist that we will see a higher low with the JSE.
And it will soon (not sure when) break up and out of the long extended Vuvuzela formation.
Once it does my first short term target will be to 75,000.
Every year it seems the JSE is testing traders more and more.
Some fundamental news: Someone asked about what happens with the Interest Rates staying put last week in South Africa?
Here are my thoughts...
In the short term it's normally a bullish sign as it will stimulate economic and GDP growth. It's cheaper for businesses to borrow money.
On the other side the interest rates are still very high and in the medium to long term, this will discourage spending and will encourage savings as there is a better ROI keeping money in the bank...
As traders, we react on the short term and hopefully with the interest rates on hold, it will push up buying and demand.
Then we can get our rally we've anticipated for the last 7 months.
I'm starting to feel like Clive Roffey, where you see the impending upside, but there are just no confirmation catalysts to boost it.

Vuvuzela Pattern for the JSE ALSI 40 target to blow up to 75000 Well, well, well, we've identified the tumultuous and monotonous pattern on the chart finally.
It's known as a Broadening Triangle or what I call a Vuvuzela Formation.
The price diverges instead of converges in a triangle pattern...
Now this can be a continuation or a reversal pattern. It all depends on the breakout.
Looking at the D&S and liquidity it looks like the JSE really wants to break above the formation and head to new highs of the year.
75,000 is a decent first target...
Also with Smart Money Concepts we can see there is a Sell Side Liquidity Order Block showing how Smart Money is sweeping selling and buying into it, hence there isn't a major push down in price just yet...
I'm bullish with this Vuvuzela. Now we need the JSE to blow up.

JSE ALSI 40 Vuvuzela Formation - could break up!Hi guys, this could be a concern.
JSE ALSI 40 has been forming a broadening pattern (Vuvuzela) since 12 April 2023.
Now with these patterns, they can break any direction...
If we make a higher low, the chance of the price breaking up is higher. Then we can expect the price to finally break up and out and head to 75,000 as the first target.
As this is Monday, it will set the bar to where the market will be heading soon. We need to hold onto our hats as this can go south just as quickly as it went up last week.
What do you think up or down this week?

Where is this damn JSE going - I hope UP! - Here's why. Your guess is as good as mine.
One day we are up another is down.
One week is up, one month is sideways.
This is NOT conducive for trending markets.
This is NOT conducive for breakout traders.
This is not conducive for momentum traders.
So we need to wait for a breakout to have a better idea on where it wants to go.
Right now I'm long 8 stocks and short 6 stocks on the JSE.
So yes, hedging is crucial during these times.
Also, one needs to hedge with Forex, indices maybe even international markets.
It's the only way to have more control of our portfolios and to diversify markets better.
So which way is it going. No matter what, I always prefer the market to move up.
I prefer for the optimistic approach where companies are doing well, South Africa is doing well and investors are doing well.
Even though I could be stopped with all shorts, I honestly don't care. I care about the wellbeing of the country and the JSE.
I don't normally rant with analyses, but this is a clear example of where we as traders, have no idea where the market is likely to head.

The JSE ALSI 40 - Boy who cried BULL again! Target 80.384The JSE ALSI 40 has been moving in this large somewhat frustrating Symmetrical Triangle since December 2022.
I've been bullish with the index and have expected it to break above the apex by now. But the triangle just keeps on moving in its consolidation sideways range.
Thing is, the up signs are showing. This market wants to fly up and the rest of the international markets are holding it down.
But now with the breakout above the Falling Wedge with the S&P 500 and Nasdaq, maybe we can get our push up finally.
Other indicators confirm upside to come
Price>200 - Bullish - 7 needs to cross above 21 thought
RSI>50 and higher lows are being formed.
Target 1 is now moved to a higher 80,384.
Can we get our breakout now. Us breakout traders have been patient enough...

Where to NEXT with the JSE ALSI 40? I hope UP!Do you want the JSE ALSI 40 to fall where we profit from all the shorts.
Do we want the JSE ALSI 40 to rise, where we can profit from the longs.
I'll tell you what I want.
I always want the JSE ALSI 40 to rally.
I don't mind being stopped out on shorts.
I don't care about the shorts anyway.
And the reason is because I am optimistic with South Africa.
I want the companies to do well and I want to celebrate their success rather than downfall.
So, no matter what the situation is I always want the JSE ALSI to rally.
Take a look at the chart now...
We see a change in the pattern. Since the last higher low.
We have extended the Symmetrical Triangle.
So in a way, it's within the formation and the price is likely to head up...
On the other hand, if it breaks below it'll be a reversal pattern and the price will likely continue down.
Let's hope for the prior analysis as I'm an optimist.

JSE ALSI 40 M Formation - Breaking down We have a ton of different signals with the JSE ALSI 40.
This is where trading can get a bit tricky and frustrating. But it's for this reason, one needs to learn how to hedge positions.
And by hedge I mean, hold equal number of shorts and longs.
So we can see, there is an M Formation in the process.
The price has broken down and has broken below the Symmetrical Triangle. It is early days as the breach has been only a day, so we will need to see.
However, there are mixed signals all around.
7>21>200 - Bullish but turning
RSI<50 - Bearish by nature
Smart Money Concepts.
There are 2 Sell Side Liquidity Order Blocks.
Either Smart money could buy big time around its current price which will cause a fakeout and the price will go up.
OR Smart Money could skip this order block and buy into the next SSL OB at 67,000.
The bias is bearish as things stand, but do to the mixed signals - This is cautionary.
Stay strong and hedge!

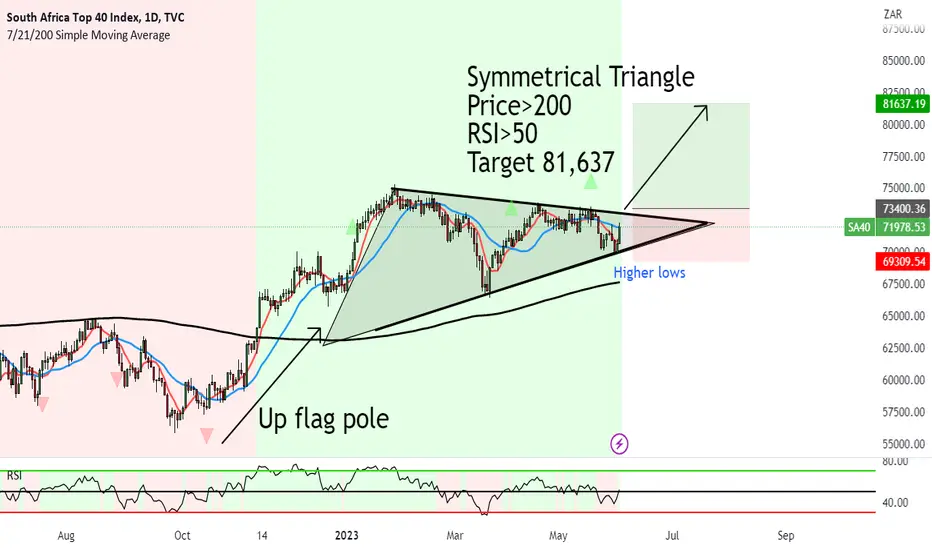
JSE ALSI 40 Symmetrical Triangle wait for break up to 81,637Symmetrical Triangle seems to be forming on the JSE ALSI 40.
This is where price constricts into a triangle that is not facing up or down.
We now need the price to break above the Apex, which will send the price higher.
The beauty about Symmetrical Triangles, is that they are generally continuation patterns to the prior trend.
With the up flag pole before the triangle confirmed, means we will expect a break up.
Price>200
RSI>50
Target 81,637