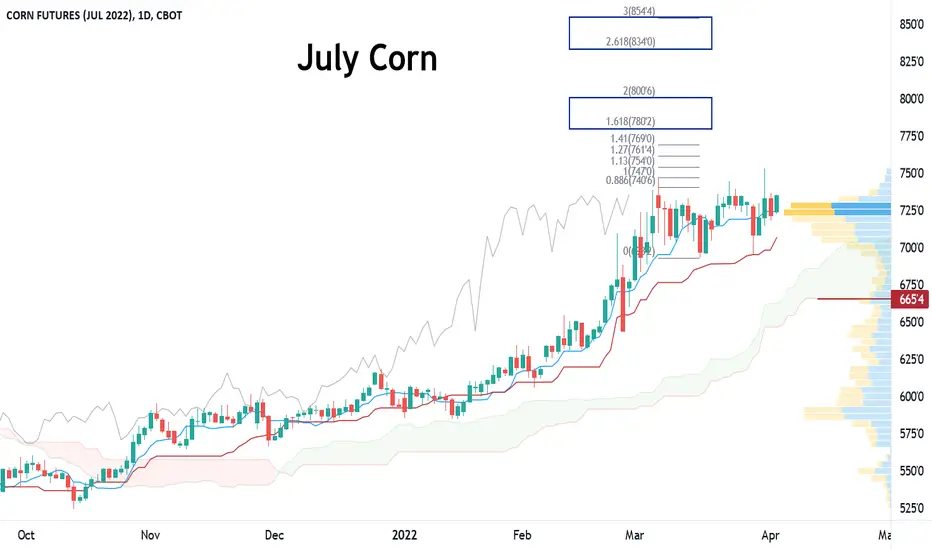
Corn - July22 DailyPrice action mostly in a consolidation or sideways channel between 6.93 and 7.47. Most volume by price in the 7.20-7.30 area. Accumulation ahead of a breakout above, or distribution ahead of a break down below???
Support below at 6.65 with risk identified in the 5.85 to 6.15 area. Using the current high to low retracements, the next primary target above is the 162% retracement at 7.80, that would nearly match the May contrtact’s high at 7.82. Above July corn looks to 8.00, 8.34, and 8.54….
July
Technical analysis of bitcoin chartsIn my opinion, as I explained in the previous post, this bitcoin chart chart will continue until almost the end of July, and we will have to wait and see what happens next.
I think there are two events ahead of Bitcoin in late July
$ 25,000 Bitcoin Or $ 45,000 Bitcoin

Tesla breakout in mid august?If tesla is in a triangle and breaksout in mid August between 10-12 (note that last years stocksplit announcement was in 11 August.) then I would say Tesla would rapidly go up until the beginning of September and then drop again just like last year. That would mean my projection of $1400+ would be reached in 2 weeks which Tesla is know for having done before. Tesla follows the wyckoff pattern and has done a massive accumulation for many months now and will cause an even greater markup to distribute the bought shares by smart money at the top. Elon musk said that the company would perhaps have their company meeting in late July or early August which means that something could be decided then which could spark a move up.
This is not Financial advice only speculations.
Please comment any thoughts


long profit trade onlyAger ye support leta hai to call buy kare or ager support cross krta hai to PUT buy kre ye 100% perfect time hai ek acha trade lene ka,...thanks


because every time i m 100% correct only buy put watch if i m wrong than i will pay your loss...thanks

BTC starts rallying 14/5 and hits 88-92k second half of JulyBTC starts rallying 14/5 and hits 88-92k second half of July

AUDUSD Long IdeaOverall Bullish on daily TF, smaller TF are starting to align. If price falls during London session, I will monitor PA to determine entry.

USDJPY outlookUSDJPY seems to be consolidating, with bigger retracements. Will continue to monitor PA to confirm reversal.


CRUDE OIL JULY FUTURE LONG..Hi,
Crude oil July future predict for buy,
Clear parallel channel moving..
Buy LONG
Stop loss 2587
1st Target 3700
2nd target 4150..
MY PREDICT ONLY..
TAKE YOUR OWN DECISION..

Mid Term $13200 Recovery Prediction (Local All-time-high)Just wanted to share another more mid range idea after the recent fall in BTC price.
It seems as though everyone is focusing on the dramatic short term time range and losing sight of the mid / long term. Zooming out I think we still have plenty of upwards momentum and I'm not convinced of the incoming bear market / alt season arguments.
If the price can close in or around $13200 (or at least floats in this range) over the next couple of days I expect the bull run to resume.

BA July 355/370 bull debit vertical spreadThis technically-driven call debit spread on Boeing entails buying a 355 call and selling the 370 call, both with standard july expiry. The cost of taking this position is a debit of 6.35, making the break even 361.33. This is slightly below the long term support levels, and the resistance of the upper boundary of the horizontal channel, which will become a support after it is penetrated. The lows from March 22nd and April 10th were both roughly 362. Once this was penetrated the stock has traded in a horizontal range. This support around 362 has been tested a couple times; this makes it stronger when it is finally broken through. Also, the 50 day simple moving average is at 365, and the 200 simple moving average is at 363, further strengthening this area of support. The maximum profit for this trade is reached at the strike of the written call, 370, and is the difference between the strikes minus the debit (15-6.35= 865/contract). This trade is 18.91 deltas positive per contract.

Selling 160/170 Strangle VisaThere is a solid long-term support at 156 on Visa. This is buttressed by the .236 Fib retracement near 155 as well. The 155/156 area is strong support in case of a bearish move. Also, the recent up-days have had lower volume than the recent down-days, indicating stronger bearish sentiment. The stock is also trading near its ATH (all time high). Today's candlestick's upper wick penetrated the bollinger bands, indicating Visa is due for mean reversion. We are selling the July 160/170 srangle for credit and are thus slightly delta negative.

LTC isn't all for BULL till July! Scary!!Altcoin Fans have a lot of hope on LTC, however it doesn't look like it wants to pick up a fight!
Still one of the good options!

#bitcoin MEMEY sidewayz (Bart & Marge) - JUL AUG 2018 - XBT BTC Dear shibes this is about to go up I told u
> much buy <
..WAT WOW WAIT?? .dogecoin.org !!
- <3 $DOGE is peace, DOGE is life -
/ DOGE / BTC / LTC


26th July 2018 - BTC / XBT - Next Wave UpSerious Bitcoin move incoming, yellow curve is my old correction curve being still ok with the last BTC moves.

Make or Break for Bitcoin in week of 16th July 2018 [BTFD]Looking at four hour chart on Bitcoin/USD we see over the weekend it good bounced from around the 0.618% fib level...
The new Cycle of Power Indicator is showing a change from bearish to bullish conditions and the RSI coming into the overbought levels - this is shown by the change of colour of the line to grey
We also have a Death Cross on a 55/100MA that has just formed
So very mixed signals for bitcoin starting this week, if the 0.618% fib level holds and some buying momentum takes us up over 6800 during the week, then we may see some gains and be good for longs, firstly 6400 need to be broken and established as a floor support and solid buying action as the week starts and then going up to 6600 and above....
IF the 0.618% fib level breaks (currently around 6180 area) then most likely we will be back in power with the Bears and price will come down to touch just below $6,000, even going as low as 5800 area, now if buy support is strong and this does play out we will examine the market after we see the moves that start the week
weekday markets open 10pm GMT +1, so get used to checking the price and movement once the institutions are back on the board and moving pieces around, expect a few squeezes along the way
i'm calling neutral for this chart but im kinda leaning towards the bearish scenario, the psyche levels of 6300 and 6200 are pretty important, so keep eyes peeled on these levels of support and watch for opposite from 6600 & 6800

USDJPY Analysis 16 Jul 18I see UJ is bullish
It likes flag pattern, and TP is at least 100% Fibo , it is the same price around resistant line.
On Friday, it is retrace, so i will watch for buy set up.
