Jupiter & The Exponential Moving Averages · Volume BreakoutFirst I looked at a pair and it was struggling to move past certain long-term EMAs. Then I opened up Jupiter, JUPUSDT, and I can see it moving forward... This is a bullish development.
Just today a multiplicity of bullish signals came together. JUPUSDT broke above its May 2025 high. Hitting the highest price since March, almost 5 months ago.
After a higher low 22-June, JUPUSDT rallied and continued to gain strength. After 9-July, it started to break, one by one, all the moving averages on this chart. These levels were working as resistance.
First EMA55 was conquered after eleven days struggling below. Then EMA89 was conquered one day after, the blue dotted line on the char. Four days later the action moved above EMA144 followed by MA200 and EMA233 yesterday; today, JUPUSDT is trading above all those major levels, with the highest price in five months.
This is as good as it gets and it reveals the intensification of a newly developing bullish wave. This wave will transform into an uptrend and this uptrend will lead to a major bull-run. The bull-run will go hiiiiigh reaching a new all-time high, the end of the bullish cycle; the entire process can take anywhere between 4-6 months or 8-12 months or more. It really depends on the overall market condition, Bitcoin and how active is the project developers team. This can all work together to produce something great.
Volume is starting to rise now. This means that it is still very early in this game.
We are just entering the bullish zone. After a major high is confirm, we can see very strong exponential growth.
While at first it takes months for prices to grow 2-3 levels up, when the wave is advanced we can see several levels increase in a matter of weeks and then it keeps on intensifying until the market goes crazy and that's when you see euphoria and greed. It is still early, but it doesn't hurt to be prepared.
Keep a calm and sane mind, you will need it to maximize profits and close as many as possible successful trades.
Namaste.
JUPUSDT
JUP / USDTBINANCE:JUPUSDT
### **📊 Chart Overview – JUPUSDT (4H):**
* **Current Price:** \$0.5415
* **Recent Action:** Price dropped sharply from \$0.668 and is now testing a **key support zone around \$0.54 – \$0.55**.
* **Key Supports:**
* **\$0.545 – \$0.54 (current zone).**
* **\$0.504 – \$0.50 (next support).**
* **\$0.466 (major support).**
* **Resistance Levels:** \$0.60 and \$0.668.
---
### **🔍 Technical Breakdown:**
1. **Trendline Resistance:**
* A descending red trendline is currently capping upside movement.
* Price needs to **break and close above \$0.57 – \$0.60** for bullish momentum.
2. **Bullish Scenario:**
* If \$0.54 holds as strong support, we could see a **bounce towards \$0.60 – \$0.65**.
3. **Bearish Scenario:**
* A breakdown below **\$0.54** might push the price down to **\$0.50** or even **\$0.466**.
---
### **📌 Summary:**
JUP is at a **critical support**. The next 1–2 candles on the 4H chart will decide if it bounces or dips toward the \$0.50 level.
---
⚠️ **Disclaimer:**
*This analysis is for informational and educational purposes only. It is not financial advice. Always do your own research (DYOR) and manage risk appropriately.*

JUPUSDT: Patience Before the FeastThere are moments in the market when you can feel something building beneath the surface. For BINANCE:JUPUSDT , that feeling of something "cooking" is becoming difficult to ignore, and for good reason.
Let's look at the simple truths on the chart. First, listen to the sound. The volume is picking up, not with a frantic roar, but with a steady, deliberate rhythm. This is often the sound of patient hands accumulating positions.
Second, feel the heat. The price action is coiling, building pressure in a tightening range. This consolidation, this "cooking," is often the quiet preparation before a significant move.
Given these signs, the logic to attempt a long position is sound. But a wise trader doesn't just rush into the kitchen; they wait for the meal to be served.
The blue box on the chart represents our area of interest. It is a zone of calculated support, a logical place to consider entering a long position. We do not chase the price. We let the price come to our predefined zone.
The plan is one of patience. See if the market offers an entry in the blue box. Know your point of invalidation before you risk a single dollar.
The feast may be coming, but entry is reserved for the disciplined.
Disclaimer: This analysis is for informational purposes only and is not financial advice. Trading involves significant risk. Always conduct your own research.
📌I keep my charts clean and simple because I believe clarity leads to better decisions.
📌My approach is built on years of experience and a solid track record. I don’t claim to know it all but I’m confident in my ability to spot high-probability setups.
📌If you would like to learn how to use the heatmap, cumulative volume delta and volume footprint techniques that I use below to determine very accurate demand regions, you can send me a private message. I help anyone who wants it completely free of charge.
🔑I have a long list of my proven technique below:
🎯 ZENUSDT.P: Patience & Profitability | %230 Reaction from the Sniper Entry
🐶 DOGEUSDT.P: Next Move
🎨 RENDERUSDT.P: Opportunity of the Month
💎 ETHUSDT.P: Where to Retrace
🟢 BNBUSDT.P: Potential Surge
📊 BTC Dominance: Reaction Zone
🌊 WAVESUSDT.P: Demand Zone Potential
🟣 UNIUSDT.P: Long-Term Trade
🔵 XRPUSDT.P: Entry Zones
🔗 LINKUSDT.P: Follow The River
📈 BTCUSDT.P: Two Key Demand Zones
🟩 POLUSDT: Bullish Momentum
🌟 PENDLEUSDT.P: Where Opportunity Meets Precision
🔥 BTCUSDT.P: Liquidation of Highly Leveraged Longs
🌊 SOLUSDT.P: SOL's Dip - Your Opportunity
🐸 1000PEPEUSDT.P: Prime Bounce Zone Unlocked
🚀 ETHUSDT.P: Set to Explode - Don't Miss This Game Changer
🤖 IQUSDT: Smart Plan
⚡️ PONDUSDT: A Trade Not Taken Is Better Than a Losing One
💼 STMXUSDT: 2 Buying Areas
🐢 TURBOUSDT: Buy Zones and Buyer Presence
🌍 ICPUSDT.P: Massive Upside Potential | Check the Trade Update For Seeing Results
🟠 IDEXUSDT: Spot Buy Area | %26 Profit if You Trade with MSB
📌 USUALUSDT: Buyers Are Active + %70 Profit in Total
🌟 FORTHUSDT: Sniper Entry +%26 Reaction
🐳 QKCUSDT: Sniper Entry +%57 Reaction
📊 BTC.D: Retest of Key Area Highly Likely
📊 XNOUSDT %80 Reaction with a Simple Blue Box!
📊 BELUSDT Amazing %120 Reaction!
📊 Simple Red Box, Extraordinary Results
📊 TIAUSDT | Still No Buyers—Maintaining a Bearish Outlook
📊 OGNUSDT | One of Today’s Highest Volume Gainers – +32.44%
📊 TRXUSDT - I Do My Thing Again
📊 FLOKIUSDT - +%100 From Blue Box!
📊 SFP/USDT - Perfect Entry %80 Profit!
📊 AAVEUSDT - WE DID IT AGAIN!
I stopped adding to the list because it's kinda tiring to add 5-10 charts in every move but you can check my profile and see that it goes on..

$JUP - Long Trade IdeaBINANCE:JUPUSDT | 1D
Entry: .53 to .50
Stoploss: .477 (prev low)
Initial target .57–.60, if we get a strong rejection here, take full profit and look to re-enter on a retest around .47–.45
TPs:
.57-.60
.67-.72
.82-.90
JUP/USDT – Massive Breakout Brewing? Falling Wedge Reversal🧠 Detailed Technical Analysis:
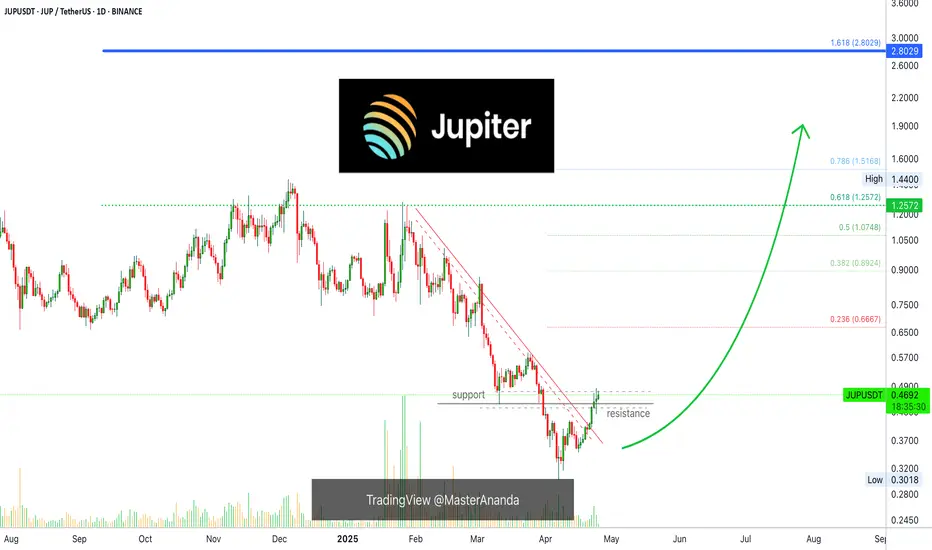
Jupiter (JUP) is currently forming a classic bullish reversal pattern – the Falling Wedge – after months of consistent downward pressure. Since December 2024, JUP has been trending inside a narrowing range of lower highs and lower lows, and it's now approaching a potential breakout zone.
📊 Pattern in Focus: Falling Wedge – A Powerful Bullish Reversal Setup
The Falling Wedge consists of a converging downtrend with declining volatility.
This pattern typically signals a loss of bearish momentum and often precedes a sharp upside breakout.
If confirmed, a breakout can lead to a strong bullish impulse wave with significant gains.
🔍 Key Levels to Watch:
✅ Major Support Zones:
$0.3018 – Historical low and critical defense level
$0.4453 – $0.4883 – Current consolidation base
🚀 Key Resistance Targets (Post-Breakout):
$0.6089 – First resistance after breakout
$0.7213 – Mid-level resistance
$0.8075 – Key breakout zone before bullish expansion
$1.1158 – $1.3701 – Primary medium-term targets
$1.4400 – All-time high and psychological resistance
🔼 Bullish Scenario (High Probability Setup):
If JUP breaks above the falling wedge resistance and clears $0.4883:
✅ A bullish rally could target $0.6089, followed by $0.7213 and $0.8075
✅ If strong momentum follows, JUP might extend gains towards $1.1158 – $1.3701
✅ Watch for breakout confirmation with high volume and potential retest of the breakout zone
🔽 Bearish Scenario (Risk to Consider):
If price gets rejected and breaks below $0.4453:
❌ Downside may resume toward $0.3600 or even retest $0.3018
❌ This could either lead to a prolonged downtrend or form a double bottom base for a future reversal
💡 Conclusion & Strategy:
JUP is at a critical technical juncture. The Falling Wedge formation is one of the most reliable bullish reversal signals.
This setup offers a great risk-reward opportunity for traders watching for a confirmed breakout.
📌 Breakout = Golden Opportunity
📌 Breakdown = Be Cautious & Reassess
Aggressive traders may look to accumulate near $0.44–$0.48 with tight stop-losses.
Conservative traders should wait for a breakout + retest for confirmation before entering.
#JUP #JUPUSDT #CryptoBreakout #FallingWedge #TechnicalAnalysis #AltcoinSetup #CryptoChart #BullishSetup#AltcoinWatch #SwingTradeSetup #CryptoStrategy

JUP Main trend. Channel. Wedge. Double bottom. 06 07 2025Logarithm. Time frame 3 days. Decline from the maximum -84% (this is not enough), but given the capitalization of 59th place, if the market is positive in the near future, then it is quite possible to reverse this cryptocurrency through a double bottom.
All long-term consolidation above with high volatility is the distribution of ladies and gentlemen. Also study the vesting of this cryptocurrency. There are less than half of the tokens on the market, and there are also pauses for 1 year, which is good.
Jupiter (JUP) is a key player in the decentralized finance (DeFi) space, especially in the Solana blockchain.
Main trend is downward. Descending channel.
Secondary trend is downward. Descending wedge.
Local trend is sideways. Potential double bottom in case of a breakout.
The price will move in the corridors of this descending channel from the dynamic lines of its support/resistance. Remember this and use it in your trading strategy, observing money management.
Local breakout zone
Understand where the zones are cheap, and where, on the contrary, the zones are expensive. If you work (tear out movements, there should be short-term or conditionally medium-term transactions, with very mundane goals) conditionally in expensive zones, then limit losses. Do not let yourself be fooled by news noise and the opinions of the majority.

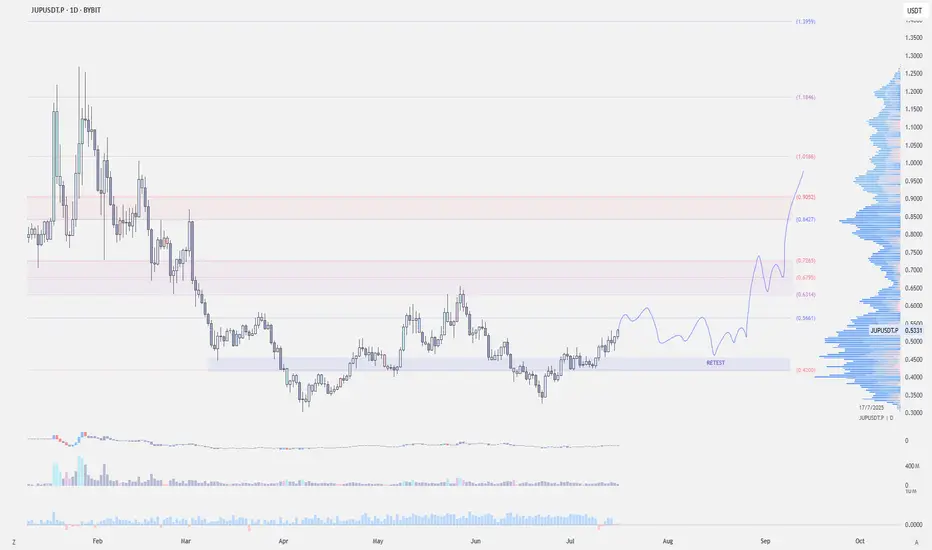
JUPUSDT Retests Breakout Zone: Rally Ahead?JUPUSDT has broken its downtrend and is now in a retest phase, which could lead to a continuation of the bullish move. If the support area holds, there’s potential for upward momentum to resume. Traders are watching this zone closely as a possible entry point, with bullish structure still intact and room for further gains if momentum continues.

#JUP/USDT#JUP
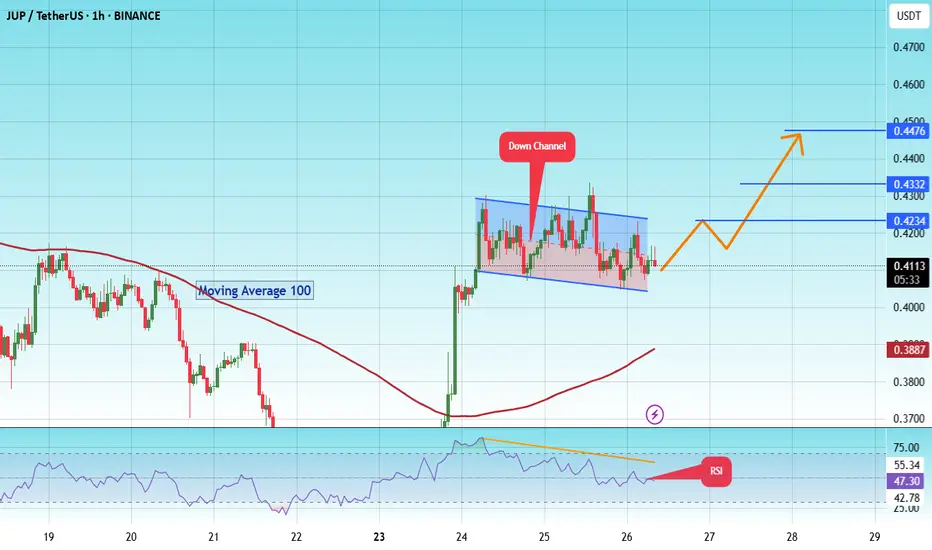
The price is moving within a descending channel on the 1-hour frame and is expected to break and continue upward.
We have a trend to stabilize above the 100 moving average once again.
We have a downtrend on the RSI indicator, which supports the upward move by breaking it upward.
We have a support area at the lower limit of the channel at 0.4065, acting as strong support from which the price can rebound.
Entry price: 0.4113
First target: 0.4234
Second target: 0.4332
Third target: 0.4477
JUPUSDT Forming Falling WedgeJUPUSDT is showing strong bullish potential as it forms a classic falling wedge pattern—a technical setup often preceding significant upward price movement. This pattern, defined by a series of lower highs and lower lows converging into a narrowing channel, reflects declining bearish momentum. With price approaching the wedge's apex and volume remaining healthy, a breakout to the upside appears imminent. This setup has historically delivered solid results in crypto markets, especially when supported by strong volume and growing investor interest.
From a price action perspective, the falling wedge pattern for JUPUSDT suggests a reversal is likely on the horizon. A confirmed breakout above the descending resistance trendline could see JUPUSDT rally by 80% to 90%+, aligning with historical projections based on the pattern's depth. The coin has already begun to gain traction in the market, with increased order book activity and stronger community sentiment visible across multiple platforms.
The project behind JUPUSDT is also attracting attention from both retail and institutional investors. This interest often translates into stronger support zones and more sustainable rallies. Coupled with technical indicators like RSI divergence and rising accumulation volume, JUPUSDT seems well-positioned for a breakout that could deliver substantial returns in the short to medium term.
Traders should closely monitor resistance breakout levels and wait for confirmation via volume surges or bullish candlestick structures. JUPUSDT’s combination of pattern strength, volume profile, and market engagement makes it a compelling pick among altcoins poised for recovery and rally.
✅ Show your support by hitting the like button and
✅ Leaving a comment below! (What is You opinion about this Coin)
Your feedback and engagement keep me inspired to share more insightful market analysis with you!
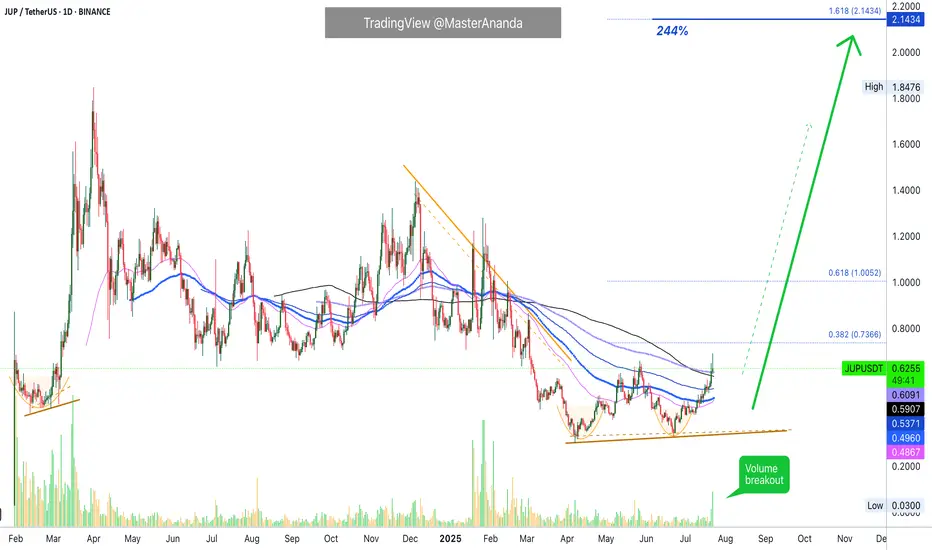
Jupiter, Mapping A 430% Bullish WaveJupiter is set to grow really strong, we agree correct?
When we agree right from the start, I can skip the technical analysis and move straight to the target. Because everybody knows JUPUSDT is set to grow really strong in the coming months.
Back in early 2024 a market bottom led to growth. A 325% bullish wave developed within 49 days. The bulk of the action happened within 33 days. We can say +100% profits every ten days, sounds good. Looks great.
We know for a fact that this pair can grow more than 300% in a single month. What if the bullish phase is stronger now, longer now... How much growth would be possible if JUPUSDT grows straight up for 3 months? What about six months?
Here I have an easy target at $2.14 with 430% profits potential. This is mid-term, within 3 months.
My ideas and believe project think see much more happening in 2025 than what I am showing on this chart. But this is the start. This is an easy 430% wave. It can start now, soon, within days but once it starts going it will keep on going non-stop until the end. Sorry, no wait; one stop before the final bull run, but the whole process can take more than six months.
Are you ready?
How are you going to maximize profits if you are one of those trading this coin?
What's your plan?
Will you buy and wait for everything to be up in order to sell? Meaning, just securing lower prices now and "let the market take care of the rest"?
Or, are you going to set up your sell orders on target, selling portions at each resistance level as prices grow?
Are you going to buy with leverage? Are you ready to lose everything if the market shakes? Are you going with 2-3X or 10-20X? I would always recommend the lower end because it is better to earn a sure 200% than lose everything looking for an uncertain 10,000%.
What you do is up to you. But here you have this chart; you know what is coming, you have the blessing of knowing ahead of time so you can plan based on your own trading style and goals.
It can be big or it can be small but we are all going to win if we approach the market with the right mindset, and if we keep risk to a minimum. Some people like high risk though and that's ok too. There is something for each and every one of us.
Jupiter will end up going much higher than what is shown on the chart.
Namaste.

Jupiter JUP price analysisThe price of OKX:JUPUSDT did not live up to the “multifaceted promises” of marketers and disappointed us...
So we will get rid of #Jup from our portfolio in the designated area.
May all the gods, headed by Zeus, help #Jupiter rises from its knees and cross the $0.80 mark at least for a while
There is nothing more to add, with such dynamics, it will be very difficult to "scrape up" #JUP to at least $1...
_____________________
Did you like our analysis? Leave a comment, like, and follow to get more

JUP/USDT: Classic Inverse Head & Shoulders Breakout!🚀 JUP Inverse Head and Shoulder Breakout – 80% Potential Incoming?! 👀🔥
Hey Traders! If you're all about high-conviction plays and real alpha, smash that 👍 and tap Follow for more setups that actually deliver! 💹💯
JUP is breaking out of a textbook Inverse Head and Shoulders pattern on the 12H timeframe — signaling a strong bullish reversal after a long downtrend.
🟢 Pattern: Inverse H&S
📊 Breakout Confirmation: Neckline flipped into support
🎯 Target Zone: $1.05+
🛡️ Invalidation: Close below $0.534
Momentum is shifting, and bulls seem to be back in charge. If this pattern plays out fully, we’re looking at a potential 70%+ move from current levels.
Let the chart speak. Keep this one on your radar!

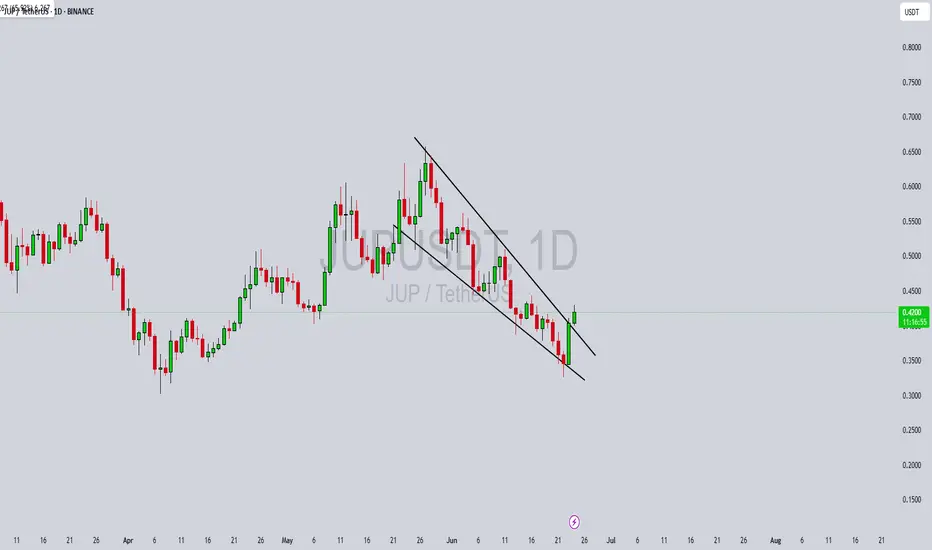
JUPUSDT 1D AnalysisJUP ~ 1D Analysis
#JUP Buy gradually after successfully breaking through this resistance line with a short-term target of at least 10%+ from here.

JUP Looks Bullish (4H)From the point where we placed the green arrow on the chart, it appears that the bullish phase of JUP has started in a swing structure.
This phase is a diagonal (Diametric), and it currently seems that wave G is forming. This wave is a bullish wave.
As long as the green box is maintained, the price can move toward the red box.
The closing of a daily candle below the invalidation level will invalidate this analysis.
invalidation level: 0.4322
For risk management, please don't forget stop loss and capital management
Comment if you have any questions
Thank You

JUPITER CONSOLIDATION - When Breakout?LSE:JUP has been seen to range within the box on the 1hr timeframe chart since Friday 9th May and it’s still within the box. What do you expect - upward or downward breakout?
Please support this idea with a LIKE👍 if you find it useful🥳
Happy Trading💰🥳🤗

JUP Technical Analysis – Daily TimeframeJUP Technical Analysis – Daily Timeframe
Currently, JUP is in a corrective phase. To confirm a trend reversal, the price needs to break above the key resistance at $0.60 with strong momentum.
🔸 There is a possibility of a move toward this level and even a false breakout, but for a safer entry, a valid breakout with strong volume is preferred.
If the price fails to break this resistance, a pullback toward lower support levels may occur:
The first support lies around $0.47 on the 4-hour timeframe.
In a more bearish scenario, the price might drop to the daily support at $0.40, which is roughly 25% below the current level.
🔄 However, a bullish reaction from these support zones could potentially reignite the upward trend.
📝 This analysis will be updated as the chart develops. Stay tuned.

JUP Predicts The Future: Crypto Bull Market Certainty Level 100%Jupiter has been rising for 10 days straight. This hasn't happen since October 2024. The bullish bias has been revealed. This is a type of bullish consolidation. The action is back above the 11-March low. Yesterday's session wicked below, closed above. Bullish, bullish, bullish all across.
Jupiter is preparing for a nice jump.
Good evening my fellow Cryptocurrency special-genius trader, it gets better everyday.
What if... Right!
Do you agree? Ok!
The support/resistance dynamic is back in full view.
The continued growth is a very much strong revealing signal should be paid attention to. It works.
Signals like these are simple signals but can reveal everything, it works really good trust me.
Ten days straight moving up. There is a red candle in-between the rise but this does not nullify in any way the rise. It works. Trust me.
It is actually quite entertaining when you see the results.
Making the prediction is nothing, it is great when you see it work.
So these are the signals, simple signals and yet it works.
Watch! Jupiter (JUPUSDT) is set to grow. Deduction/conclusion arrived at based on the chart. 100% the chart even predicts political events. It has been proven many time now in the recent weeks. See this...
Major events will develop that will propel the market up. Political events, why? The charts are bullish and pointing up to massive growth. If any event is needed, the market creates it so soon these events will be public and the market grows.
The market grows because it is set to grow. It has already been decided it is already true. It only needs to show in the prices and charts.
It is like you apply for a job and you get it but you have to wait 3 months before your entry date. It is a done-deal, it is a secured deal it cannot be cancelled but you aren't still working but you know for certain. Something like this but with a higher level of certainty.
Say you have a family member 99 years old with terminal cancer and ready to go. The news are in, the data is in and everybody knows but the person is still alive. It is a done deal, it hasn't happened but will happen. Something like this. Things can be certain and yet not materialized. These things happen.
It can happen that it has been decided, it is known for a fact and sure the market will grow. Yet, it hasn't happened but this doesn't mean that it is questionable, some things can't be changed.
It can't be avoided and nobody wants to avoid it. It is the other way around, most of the majority want it to happen and it will happen. No other scenario is possible that's how the world works.
Tomorrow, it is day. Later, the night. Repeat over and over, nothing can avoid this reality from happening. Times change, it is the same.
One day it is the banks, the next day it is Crypto.
Namaste.
JUP Long Spot Trade Setup – Oversold and Approaching Key SupportJUP is showing strong signs of oversold conditions and is now approaching a major support zone ($0.22 – $0.30). This area offers a favorable risk-to-reward opportunity for a bounce if buyers step in.
📌 Trade Setup:
Entry Zone: $0.22 – $0.30
Take Profit Targets:
🥇 $0.4050
🥈 $0.4467
Stop Loss: Just below $0.20


JUPUSDT 2DJUP ~ 2D Analysis
#JUP Buy gradually from here with a short -term target of at least 15%+. This is a very good support to start buying again.

JUPUSDT: Weekly Outlook & Key Levels for JupiterHey everyone! 🌟
Let’s take a look at this weekly cryptocurrency price chart together. Here's what stands out:
We’re looking at two possible scenarios:
Primary Scenario: The price might bounce back from the first support level, marked with a solid yellow arrow.
Secondary Scenario: If it doesn’t, the next potential rebound is from the lower support level, shown with a dashed yellow arrow.
Keep an eye on the numbers highlighted—$0.4310 and $0.3798. These are key price levels that could guide future movements. It’s also essential to monitor liquidity, candlestick patterns, and trading volumes. A strong confirmation, like a favorable candlestick formation and sufficient volume, could signal a rebound.
However, if the price dips below these critical levels, it might shift the perspective. Staying vigilant is key.
Always remember, this is just an observation. Do your own research, stay informed, and keep learning. The journey in the crypto world is as much about growth as it is about numbers! 📚📈✨

JUP in Danger: Are We in for a Crash?JUP has been on a four-day downtrend, and it's starting to show its bearish side. The token has lost its yearly open, which was a major support level. Let’s break down the key support and resistance to see what the chart is telling us.
Support & Resistance
Resistance:
Yearly Open & Monthly Level: JUP has dropped below the yearly open at $0.8169 and the monthly level at $0.7427
Support:
Long-Term Range & Liquidity: JUP has been trading within a range for over 300 days, with a significant amount of liquidity below the low at $0.6328 from 5 July 2024.
POC: The volume profile shows the POC sitting at around $0.5, marking an attractive entry point for a long position.
Fibonacci Confluence: The 0.786 Fibonacci retracement level falls just below the key low at $0.431 (a level last seen on 12 February 2024), offering a great long trade setup.
Long Trade Opportunity:
Alarms are set, let's see if JUP drops to these key support levels. If it does, we could have a solid long setup on our hands.

Univers Of Signals | JUPLet's quickly review JUP, one of the DeFi coins, which is currently ranked 51st on CoinMarketCap with a market cap of $1.75 billion.
🔍 In the 4-hour timeframe, we are observing a very large range box from 0.6312 to 1.2542, where JUP is currently at the bottom of its box.
✨ There is also a descending channel that has been accompanying the price from the top of the box, with several touches to both the bottom and top of the box, and now it has approached the bottom of the box again.
📉 If the area of 0.6312 is breached, you can enter a short position targeting 0.5588. Entry of the RSI into the oversell zone would provide a suitable confirmation for this move.
📈 For a long position, wait until the channel is broken upwards, and in this case, with the breakout of the trigger at 0.8365, you can enter a long position.
