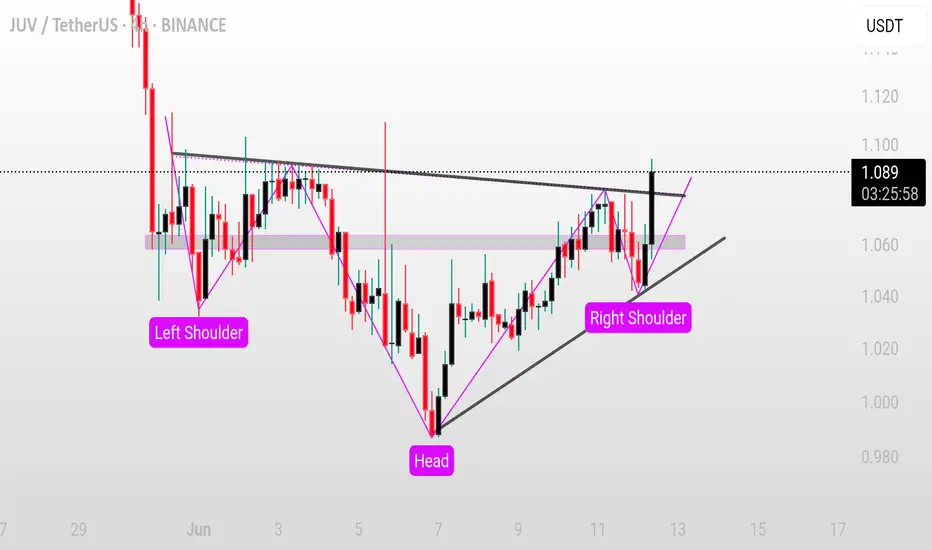
JUV/USDT (4H) – Inverse Head and Shoulders Breakout Setup
JUV/USDT (4H) – Inverse Head and Shoulders Breakout Setup
Pattern: Inverse Head and Shoulders 👕
Timeframe: 4-Hour ⏱️
Pair: JUV/USDT 💱
Published: June 12, 2025 📅
---
Technical Overview:
JUV/USDT is developing a textbook inverse head and shoulders pattern, signaling a possible trend reversal. The left shoulder formed near 1.040, the head reached down to 0.980, and the right shoulder is forming again around 1.040. A descending neckline is being tested near 1.080. A confirmed breakout could open room for upside continuation 📈.
---
Potential Trade Setup:
Bullish Scenario ✅
Entry: On a confirmed 4H candle close above 1.080 with strong volume
Targets:
* First target at 1.140 🎯
* Second target at 1.180 🎯
Stop-loss: Below the right shoulder at 1.030 🛑
Bearish Scenario ❌
Invalidation: Failure to break the neckline followed by rejection at or below 1.080
Confirmation: Breakdown below the rising trendline supporting the right shoulder
Targets:
* First target at 1.000 📉
* Second target at 0.980 📉
Stop-loss (if shorting): Above neckline at 1.085 🛑
---
Risk Management ⚠️
A false breakout or rejection from the neckline without volume confirmation could trap early bulls. If the price breaks below the right shoulder and trendline, bearish momentum may resume. Always wait for confirmation and use protective stops 📊.
---
Conclusion:
JUV is testing a major technical pattern. A confirmed breakout can lead to strong gains, while failure may push the price back toward recent lows. Let the structure complete and act only on confirmed moves 🔍⏳.
Juvusdtlong
JUV/USDT Trading IdeaJUV/USDT Trading Idea
JUV/USDT is consolidating near a key resistance level, hinting at a potential breakout. The price has been forming a structure that suggests increasing momentum, which could lead to a strong move in the coming days.
Key points:
- JUV/USDT is trading close to a resistance zone that has been tested multiple times. A breakout could signal a bullish trend.
- Monitor the trading volume closely; an increase during the breakout will confirm strong market interest.
- Use momentum indicators like RSI to check for overbought or oversold conditions.
Trading tips:
- Wait for a confirmed 4H or daily candle close above the resistance level before entering a trade.
- A retest of the breakout level as support provides a safer entry with reduced risk.
- Always manage your trades with appropriate stop-loss and position sizing to minimize risk.
This is an educational analysis, not financial advice. Always conduct your own research before making trading decisions.

#JUV/USDT#JUV
The price is moving in a descending channel on a 1-day frame upwards and is expected to continue
We have a trend to stabilize above the moving average 100 again
We have an upward trend on the RSI indicator that supports the rise by breaking it upwards
We have a support area at the lower limit of the channel at a price of 1.45
Entry price 1.70
First target 1.94
Second target 2.14
Third target 2.43

JUV/USDT - Juventus Fan Token: Resistance_Breakout◳◱ A Resistance Breakout has been identified on the $JUV / CRYPTOCAP:USDT chart. The price has broken above a key resistance level, indicating a potential bullish trend. The next resistance key levels are located at 3.001 | 3.354 | 3.968, and the major support zones can be found at 2.387 | 2.126 | 1.512. Consider entering at the current price zone of 2.641 and targeting higher levels.
◰◲ General info :
▣ Name: Juventus Fan Token
▣ Rank: 652
▣ Exchanges: Binance, Huobipro, Gateio, Poloniex, Hitbtc
▣ Category/Sector: N/A
▣ Overview: Juventus Fan Token project overview is currently unavailable. I'll try to update this in the upcoming analysis.
◰◲ Technical Metrics :
▣ Mrkt Price: 2.641 ₮
▣ 24HVol: 1,287,130.039 ₮
▣ 24H Chng: -0.076%
▣ 7-Days Chng: 1.69%
▣ 1-Month Chng: -23.50%
▣ 3-Months Chng: -13.48%
◲◰ Pivot Points - Levels :
◥ Resistance: 3.001 | 3.354 | 3.968
◢ Support: 2.387 | 2.126 | 1.512
◱◳ Indicators recommendation :
▣ Oscillators: BUY
▣ Moving Averages: STRONG_BUY
◰◲ Technical Indicators Summary : BUY
◲◰ Sharpe Ratios :
▣ Last 30D: -5.15
▣ Last 90D: -0.04
▣ Last 1-Y: 0.14
▣ Last 3-Y: 0.02
◲◰ Volatility :
▣ Last 30D: 0.75
▣ Last 90D: 1.34
▣ Last 1-Y: 1.03
▣ Last 3-Y: 1.21
◳◰ Market Sentiment Index :
▣ News sentiment score is N/A
▣ Twitter sentiment score is N/A
▣ Reddit sentiment score is N/A
▣ In-depth JUVUSDT technical analysis on Tradingview TA page
▣ What do you think of this analysis? Share your insights and let's discuss in the comments below. Your like, follow and support would be greatly appreciated!
◲ Disclaimer
Please note that the information and publications provided are for informational purposes only and should not be construed as financial, investment, trading, or any other type of advice or recommendation. We encourage you to conduct your own research and consult with a qualified professional before making any financial decisions. The use of the information provided is solely at your own risk.
▣ Welcome to the home of charting big: TradingView
Benefit from a ton of financial analysis features, instruments and data. Have a look around, and if you do choose to go with an upgraded plan, you'll get up to $30.
Discover it here - affiliate link -

#JUV/USDT: Bollinger Band breakout🔸 Hey traders, we've identified a Bollinger Band breakout on the $JUV / $USDT chart. The price has moved outside of the upper Bollinger Band, which can indicate a potential bullish trend. The next resistance key levels are at 3.06 | 3.19 | 3.42 and the major support zones are respectively at 2.83 | 2.73 | 2.5. We may consider buying at the current price zone 3.4 and targetting higher levels.
📊 Technical Metrics Index Summary:
⎿ Current price ⌁ 3.4 ₮
⎿ 24h Change: 🚀 7.595%
⎿ 24h Volume: 1,475,496.451 ₮
⎿ Oscillators: BUY
⎿ Moving Averages: STRONG_BUY
Welcome to the home of charting big: TradingView
Benefit from a ton of financial analysis features, instruments and data. Have a look around, and if you do choose to go with an upgraded plan, you'll get up to $30.
Discover it here

Juventus Fan Token (JUV) Formed bullish Gartley upto 37% pumpHi dear friends, hope you are well and welcome to the new trade setup of Juventus Fan Token (JUV) with US Dollar pair.
In the previous bearish Gartley pattern of JUV the priceline went very close to hit the target zone but moved away with a slight difference:
Now on a daily time frame, JUV has formed a bullish Gartley pattern.
Note: Above idea is for educational purpose only. It is advised to diversify and strictly follow the stop loss, and don't get stuck with trade

JUVUSDT Ascending Triangle - Bullish After Breakout & RetestJUVUSDT Ascending Triangle - Bullish After Breakout & Retest
NOTE: DO YOUR OWN ANALYSIS. DO PROPER RISK AND MONEY MANAGEMENT. SPOT TRADING ONLY.
Open Trade IF & ONLY IF the setup is validated!
If the market break above and the retest completed, then buy above 11.6.
See the Targets and stop loss in the chart.
