KDA showing a very impressive investment opportunityHi Everyone;
today we have one of the best risk to reward Investment opportunity
it is more than 1880 times the risk and the chart is look very promising.
I expect breaking the previous bear market key point will clear the way to the final target
Kadenaforecast

Kadena (KDA) almost formed bullish Gartley for upto 14% pumpHi dear friends, hope you are well and welcome to the new trade setup of Kadena (KDA) with US Dollar pair.
Recently we caught more than 25% pump of KDA as below:
Now on a 4-hr frame, KDA has formed a bullish Gartley move for the next price reversal.
Note: Above idea is for educational purpose only. It is advised to diversify and strictly follow the stop loss, and don't get stuck with trade.

KDA BTC 1d long term TA - End of 2022KDA long term support (orange horizontal) hit again on BTC pair.
White horizontal = upcoming resistances
Green horizontal = all time low support


Kadena- One of my follower asked me to repost about Kadena, so i do.
- Eveything is in chart, no price comment.
- Just Buy KDA at your convenience.
- i bought KDA around 0.5$ and sold around 15$ (+2900 %). i had a small bag on it, so i decided it was enough gains.😌.
- Kadena Pushed finally to 28$.
A bit about Kadena :
- Kadena's blockchain enables enterprises across industries to efficiently transact and share data in a decentralized manner.
- Kadena's technology aims to solve the challenges with current generation blockchains issues such as speed, scalability, and security.
- Prior to founding Kadena in 2016, Stuart Popejoy and Will Martino led "JP Morgan's Blockchain" Center for Excellence.
- First post about Kadena (March 2021) :
- Second post (October 2021) :
- So now when some peoples post comments on my charts with words like "MoonBoy" or "Fool" . i just nerd myself 🤓.
- i am here to help for free (no signals group, no patreons, no vip, nothing, zero )
- i am just happy if i can make some peoples win.
- i give my time and my reward is just hope, if i can change some families life, i am winner!
- This is my manner to be thankful to TheKing from the time i started to believe in the White Paper.
- Don't forget cryptos are speculative assets and still young for now, but it could be the future.
- many projects will fail and die and some will success and moon, so you need to be smart and diversify your invests.
Every Man is the Architect of his own Fortune.
Happy Tr4Ding !

KDA/USDT - ACCUMULATION IS OVERKDA KADENA TIME TO MAKE A RUN!
ATH will get touched and will go well over once people discover this gem!
I hold a bag I AM NOT BIASED AT ALL hahahaihaiiiahohoho

Kadena (KDA) formed bullish Cypher for upto 54% pumpHi dear friends, hope you are well and welcome to the new trade setup of Kadena ( KDA ) with US Dollar pair.
Previously we had a nice trade of KDA:
Now on a daily time frame, KDA has formed a bullish Cypher pattern. There is also a hidden bullish divergence on the chart, as the priceline is forming higher low and RSI is setting lower lows.
Note: Above idea is for educational purpose only. It is advised to diversify and strictly follow the stop loss, and don't get stuck with trade.

KDA / BTC - THE KING OF LAYER 1KDA / BTC Kadena is going to be a top 10 cryptocurrency withing the next 2 years.
HODL and Chill.

Kadenaa (KDA) formed bullish Gartley for upto 9% moveHi dear friends, hope you are well and welcome to the new trade setup of Kadenaa ( KDA ) with Bitcoin pair.
Previously we had a nice trade of KDA:
Now on a 4-hr time frame, KDA has formed a bullish Gartley pattern:
Note: Above idea is for educational purpose only. It is advised to diversify and strictly follow the stop loss, and don't get stuck with trade

SOLANA KILLER! FUTURE PRICE PREDICTION!I think kadena is next solana ($SOL). Beautiful project with perfect chart , i expect at least 25$ from $KDA in the next rally.

💥Kadena is approaching target at $5.50Please support this idea with a LIKE👍 if you find it useful🥳
Not a financial advice🙅🏼♂️
With respect to my previous forecast on kadena. I said it’s either we see a rise to $8.10 or a fall to $5.50.
Kadena obeyed the bears and broke out of the lower trendline. Since my last call, price has fallen by 11% from $6.79 to $6.0756.
As seen here, kadena is still falling to the target price at $5.50.
What do you think?
Share your opinion in the comment section✍️
You can also demand for analysis of your preferred coin
Follow me stay updated about this coin and more helpful projects like this🎁
Happy Trading💰🥳🤗

Kadena : An overview of the bigger Timeframe... Kadena has been inside a huge falling wedge from its Alltime high. Asper Technicals, Falling wedge is a bearish reversal pattern.
Currently, We can see a falling wedge in the lower timeframe too. Breakout can lead to the Scenarios that i have marked using the Arrows.
Also if we break out of the major falling wedge, I expect a deadcat bounce. Also, It is always good to buy this gem using Dollar-Cost averaging at these very severely undervalued Prices.

💥Kadena is moving as planned🤓Please support this idea with a LIKE👍 if you find it useful🥳
Not a financial advice🙅🏼♂️
This is the kadena daily timeframe chart. Price broke out from both the falling wedge and an ascending triangle.
Price is retesting the breakout price. If price reverse at $6.60, then this pattern will be valid.
What do you think?
Share your opinion in the comment section✍️
Follow me stay updated about this coin and more helpful projects like this🎁
Happy Trading💰🥳🤗

NEW UPDATE 4H $KADENA $KDAAre you ready to fly?
Let's go Kadena !?
Reaching the moon is closer to us than the jugular vein !?
Hail to Kadena Hail to JP Morgan Hail to the patient guards of Kadena

KDA possible playAfter its rise from October to the end of Novembre we've seen a more than steady decline in the price of the Kadena.
As we're approaching the $6.5 level we're reaching a crucial level of support. If we fail to hold this then I only see further downside.
On the upside we could see an easy 2X if we hold the support.
Wait for confirmation and then this could be a nice point of entry.
Would you take this entry?

KDA/USDT 15m timeframeaccording to an Elliot wave;
- KDA could have a leg up to the first target area (orange arrow) which is between the 0.5 & 0.618 fib levels of the Elliot wave A length
- or KDA could retrace to the black line which is the 1.618 fib level of the wave A and then bounce up
- also there is a bullish TK cross
- 2nd target area is the top of the ichimoku cloud which would be valid if there was multiple candle closes in the cloud

KDA/USDT 15m timeframe- double bottom
- could range for a few hours then break out towards the top of the ichimoku cloud
- there is a bearish TK cross & a large gap between the conversion line and base line, but these 2 bearish indications could be invalid and cancel out due to the drop that has already happened.
- i believe KDA should recover in the next few hours

KDA/USDT 3hr timeframe- bullish TK cross
- target for breakout is the top of the ichimoki cloud as there has been multiple candle closes in the cloud
- above EMA 9,21 & 50
- above MA 9,21 & 50
- there is a double top though, which could force KDA down slightly

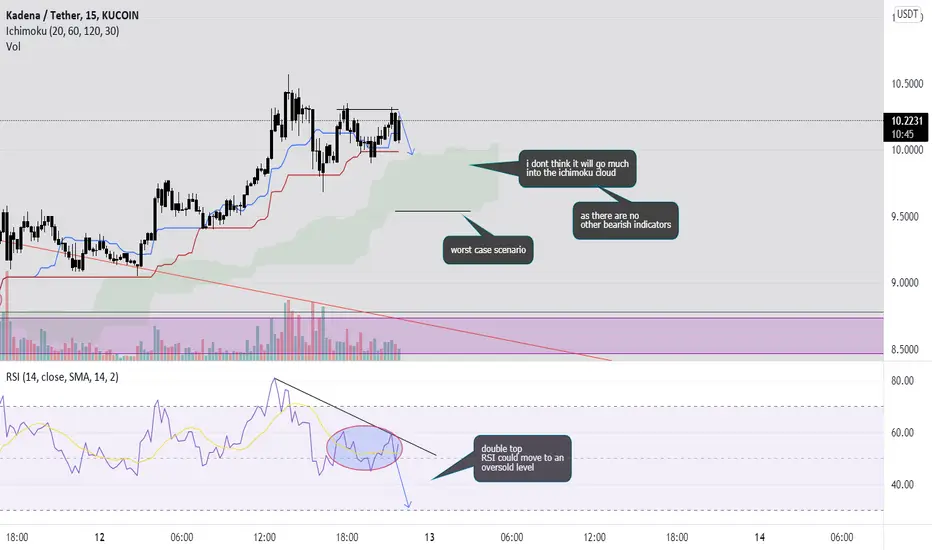
KDA/USDT 15m timeframe- double top on the 15m chart
- i dont think KDA will drop that much as there are no other bearish indicators
- worst case scenario is KDA drops to the bottom of the ichimoku cloud
- double top on the RSI, could move to an oversold level (below 30) which would be bullish
KDA/USDT on a 4hr chart- trendline broken as predicted yesterday
- bullish TK cross as predicted yesterday
- target for breakout is the top of the ichimoku cloud

KDA/USDT 15m timeframe- about to be a bullish TK cross
- bullish RSI
- volume coming into KDA
- can we break the trendline?

KDA/USDT on a 4hr chart- double bottom
- bullish RSI
- hopefully can break the trendline
- however there is a large gap between the conversion line and base line which indicates a retracement

Kadena BUY SETUP Hi everyone if you like the idea or setup please give it a like and a follow
Here’s a requested analysis on Kadena
Seems to be a a good entry level at the time, market pulled back to our Fibonacci magic level of 0.61 completing its pullback, market hasn’t gone too far from the price since then and most times when markets move sideways it only means its accumulating and getting orders in and getting ready to move.
As always, Be patient, but don’t time the markets
