EURJPY Is history repeating itselfIn the previous downhill price consolidated for about an week where 50% fib was a strong support with monthly pivot point just below it.
Now the price is in a downhill again and sure enough, price is consolidating in the same area and 50% fib is acting as a support.
Looking for the break below 50% level (closing 4h candle).
Possible flag pattern also, but it doesn't really matter, since that's the way I'm expecting it to go anyways.
Red lines are median lines from 2 different pitchforks and as can see in this chart, price has been drawn to those lines. Consolidation is also happening around the (slightly) upward median line.
Magenta line is parallel from (slightly) downward pitchfork, just for reference.
TP1: around 61.8% fib level
TP2: around 113 -> 78.6% fib and downward median line coincide and monthly S1 pivot right below them
Kamoflaaz

USDCAD Long-term viewPrice has been in a tight channel since June.
Looking for a break from the channel, meanwhile trading the channel rejects and bounces.
After the break from the yellow channel, looking at the pitchfork channel for reject/support and from where break could be a significant signal of change in the price action.
Looking back how this uptrend has gone it looks like it could stay in this channel for a long long time.
Break might happen next week, next year, or maybe year after that.
Lot's of places to keep an eye on when the price breaks the channel(s).
Long time supports and Fib levels in general and Pivots on shorter time frames.
Another interesting thing to note is that the price and 100SMA (dotted line) have been parallel since the drop.
Doesn't the pattern look like a flag...

USDCHF Pitchfork+Parallel resisted twice in daily4h candle closed nicely on upside. Subtle bullish PVT. Resisted the lines. Daily candle almost at open.
Looks like a good place to long, although, might still test the lines.
SL below lowest previous test.
Let's see how it goes.
Disclaimer: these analyses of mine are extremely flimsy.

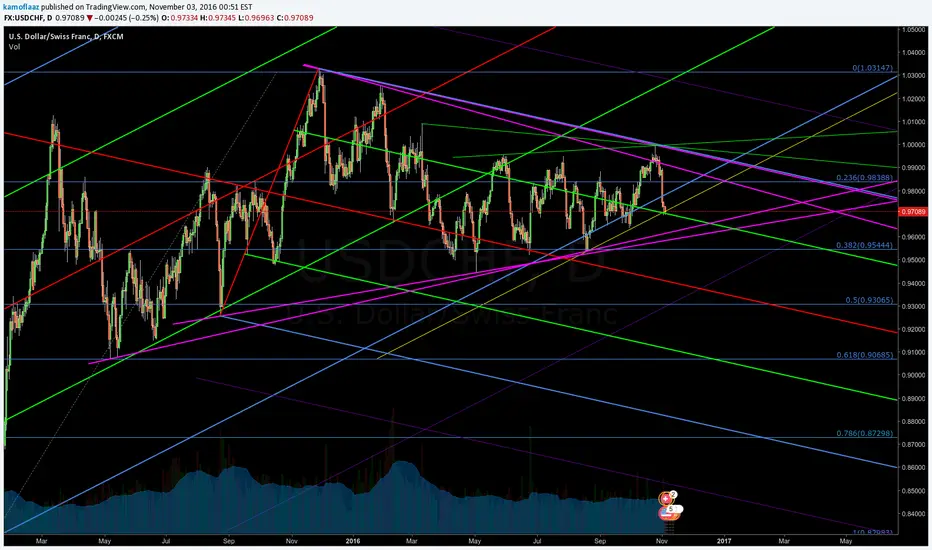
USDCHF Long-term view (into the jungle)This pair is in very interesting place.
Break through the trendlines is inevitable, just a small matter of 'when'.
If I had to guess, I'd say the eventual long-term break will be to downside, but we'll see how it goes.
In the meanwhile, there's some serious profit to be made, and make I shall.
Right at this moment:
(inclined to short, but I'll wait for the confirmation)
Short-term long opportunity if bounces from upward parallel line (credit: @Fxprotrader) which coincides with downward line.
If starts to move up, looking to take profit at 0.9830 and trailing to 0.9930 and looking for a spot to short if doesn't break above lines.
Short-term short opportunity if breaks below.
If breaks below, looking to take profit around 0.9600, trailing the stop in the case it might keep going down, and if bounces from the lines long it back up to 0.9900 area.