Kaspa Bullish · The Wait is Over · Ready to GrowWe have a very interesting situation here with the Kaspa chart, KASUSDT. There is no going back. Once the bottom is in, you know the next logical step is a change of trend. It can take some time before the low settles; the low is process not a one-day event. But here it settled already and this is all we need to know that the bullish bias is fully confirmed. You can now enter KASUSDT with lev while resting easy.
Good evening my fellow Cryptocurrency trader, I hope you are having a wonderful day.
The first low happened 10-March and then a lower and final low 7-April, also a technical double-bottom. Here Kaspa produces a small reaction and grows 150%. Notice that growing 150% in 30 days is small in the Crypto-world. If you were trading conventional markets, you would have to wait 10 years to get 70% growth.
Anyway, the initial bullish reaction to confirm the end of the correction goes into retrace and 16-June (the week), 22-June specifically, the market produces a higher low. This is the final retrace before maximum growth. I mean, there will be retraces and corrections in the future but the wave that is about to start now will not be 150%, it can be much bigger and last a lot longer, this is the 2025 bull market bullish phase. It will be a major wave.
This is just a friendly reminder to let you know, you can go all-in.
Thanks a lot for your continued support.
You will be happy with the results.
Namaste.
Kas

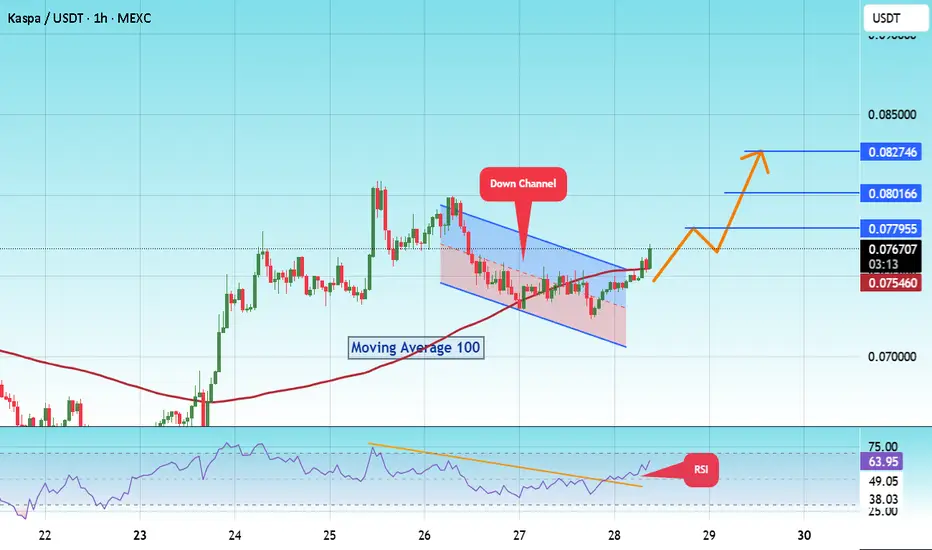
$KASUSDT Breaks Trendline #KAS
The price is moving within a descending channel on the 1-hour frame and is expected to break and continue upward.
We have a trend to stabilize above the 100 moving average once again.
We have a downtrend on the RSI indicator that supports the upward break.
We have a support area at the lower limit of the channel at 0.071500, acting as strong support from which the price can rebound.
Entry price: 0.075917
First target: 0.077955
Second target: 0.080166
Third target: 0.082746
To manage risk, don't forget stop loss and capital management.
When you reach the first target, save some profits and then change the stop order to an entry order.
For inquiries, please comment.
Thank you.
KAS IS TESTING RED RESISTANCE ZONE🚨 KAS Testing Red Resistance – Waiting for Breakout 📈
KAS is currently testing the red resistance zone.
If breakout is confirmed, the first target could be the green line level! 📊

KAS-USDT (Bybit spot), 4-hour candles TA+Trade plan1. Market context & chart structure
Asset / venue / timeframe: KAS-USDT (Bybit spot), 4-hour candles, data to 12 Jun 2025 06:45 UTC (see image).
Primary pattern in play: Price has compressed into a contracting (symmetrical) triangle that began after the 28 May low. The apex is only ~1–2 candles away, so a decisive break is statistically imminent.
Preceding structure:
17-day descending channel → capitulation into a falling-wedge reversal (27–28 May).
Two-legged double-bottom (“Bottom 2”) at 0.075–0.078 USDT.
Sideways rectangle 29 May-7 Jun, now morphing into the present triangle.
Key horizontal levels (4 h closes): 0.0930 (upper triangle rail / neckline) · 0.0891 (local supply) · 0.0797 (strong demand / wedge base) · 0.0620 (monthly support)
Volume picture: Realised volume has been drying up since 31 May, a classic pre-breakout contraction. A spike on the break will confirm direction.
2. Indicator read-out
Market Cipher B - Green momentum wave printing, money-flow bars just turned positive Mildly bullish, Early bull divergence vs 28 May
RSI(14) - 46 and curling up - Neutral-to-bullish Hidden bullish divergence vs price higher-lows
Stoch RSI 26/24 and crossing up from oversold Bullish Momentum reset complete
ArTy Money-Flow Index +3.5 and rising Bullish Positive inflow after five sessions of outflow
Collectively the oscillators favour an upside resolution, provided volume confirms.
3. Scenario probability matrix
Scenario Trigger & confirmation
Option 1 – Uptrend continuation
4 h close ≥ 0.0925 USDT with volume ≥ 2× 20-period average
Measured-move 0.107 → 0.118;
extended fib 1.618 ≈ 0.125–0.128
Est. probability: 60 %
Option 2 – Downtrend resumption
4 h close ≤ 0.079 USDT with similar volume spike 0.072 (range EQ) → 0.067–0.062 structural support
Est. probability: 40 %
Weighting derives from: oscillator bias, shrinking supply above 0.092 (order-book heat-map), but tempered by external models calling for a short-term dip toward 0.067 USDT
4. Trading plan
Component Long (Option 1) Short (Option 2)
Entry Buy stop 0.0926 USDT Sell stop 0.0789 USDT
Initial stop-loss 0.0838 USDT 0.0870 USDT (back inside triangle)
Primary target-1 0.1050 (≈1R) 0.0725 (≈1R)
Secondary target-2 0.1180 (≈2.5R) 0.0670 (≈2.5R)
Position size Risk ≤ 1 % of account per trade (adjust contracts accordingly)
5. Additional catalysts & risk factors
Macro-beta: BTC dominance and broad market risk-on / risk-off could swamp pattern-based setups; monitor DXY and SPX correlations.
Protocol news: Kaspa’s DAG-based roadmap upgrades and potential exchange listings remain upside catalysts. Conversely, lack of progress or regulatory headlines could accelerate a downside break.
kaspa.org
Weekend liquidity gaps: KAS often shows slippage outside US trading hours; consider reducing size or using wide stops if breakout occurs late Friday–Sunday.
6. To sum up
Bias: I lean 60 % toward Option 1 (bullish breakout) provided we get a 4 h close above 0.092 with volume confirmation. Otherwise, a flush to the 0.07 area (Option 2) is the alternative. Trade the break, not the prediction, and keep risk tight.

TradeCityPro | KAS Ranges Near Top with Bullish Momentum Rising👋 Welcome to TradeCity Pro!
In this analysis, I want to review the coin KAS for you. It’s one of the Layer One projects, and its token currently ranks 40 on CoinMarketCap with a market cap of 2.35 billion dollars.
⏳ 4-Hour Timeframe
On the four hour timeframe, the price is moving inside a range box between the levels of 0.082767 (which I’ve also marked as a zone) and 0.091126, and is currently near the top of the box.
✔️ Considering that other coins and market indexes like Bitcoin and Total2 are showing bullish confirmations, the activation of this coin’s long trigger could initiate a strong upward move.
📊 The volume increase shown on the chart is another reason why the probability of breaking the top of the box has gone up.
📈 For a long position, we can enter with the trigger at 0.091126. If the breakout candle comes with strong volume, we’ll have volume confirmation as well, and momentum confirmation will come from RSI breaking above 62.96.
✨ Given the confirmations, the likelihood of this trigger activating seems high, and we can target a move to 0.102417 or even 0.126033.
🛒 For a spot buy of this coin, it’s better to wait for a break above 0.126033. We can open a futures position at the 0.091126 trigger aiming for 0.126033, and once the price reaches 0.126033, we can use the profits from the futures trade to enter the spot market.
🔽 As for bearish movement and a short trigger, the first sign would be rejection from the 0.091126 area. The main trend reversal trigger will be the breakdown of the support zone.
📝 Final Thoughts
This analysis reflects our opinions and is not financial advice.
Share your thoughts in the comments, and don’t forget to share this analysis with your friends! ❤️

Kaspa reversal here is necessary. CHOCH incoming?KAS is slowly building a structure. This support here is very necessary, without it, a continued downtrend would stress liquidity levels below. Momentum and trend oscillators seem to have a bit more negativity left to make the price fall more; however, as the price reaches closer to invalidation, RR improves.
Full TA: Link in the BIO

TECHNICAL ANALYSIS – KASPA/USDT (Daily Chart) + TRADE PLANTECHNICAL ANALYSIS – KASPA/USDT (Daily Chart)
Chart Pattern & Price Action:
Descending Channel (Falling Wedge): KASPA has been trading within a falling wedge pattern, typically a bullish reversal setup.
Breakout Zone Approaching: Price is currently testing the upper resistance of the wedge (~$0.086–$0.088). A breakout from this level may indicate trend reversal.
Key Resistance Zone:
$0.105 – $0.127: Significant supply area (marked in red). Previously rejected, it is the next target if price breaks out upward.
Support Zone:
$0.073 – $0.082: Demand zone. Coincides with the Bollinger Band lower range and historical support.
Indicators Overview:
Bollinger Bands:
Price is trading at or near the middle band, showing a neutral-to-slightly bearish bias.
A breakout above the upper band (~$0.0895) could trigger bullish momentum.
MACD (VMC Cipher_B_Divergences):
Strong bearish momentum continues, but we can observe potential bullish divergence forming.
Green dot signal at the bottom may indicate a possible local bottom.
RSI (Relative Strength Index):
Currently at 37.06, near oversold territory.
Could signal a bounce if RSI climbs above 40 and confirms strength.
Money Flow Index (Art’ Money Flow):
MFI is deep in negative; however, these levels often precede trend reversals.
Watch for a crossover into positive territory as confirmation.
Stochastic RSI:
Bullish crossover around 14.53 / 15.67 in the oversold zone.
Early sign of potential short-term bounce.
TRADING PLAN
Entry Points:
Zone Type Price Range Reason
Buy Spot 1 Conservative $0.073 – $0.082 Strong historical support & bottom of wedge
Buy Spot 2 Aggressive ~$0.086 – $0.089 Breakout of descending wedge
Buy Spot 3 Momentum Break above $0.105 Bullish confirmation + breakout of major resistance
Take Profit Zones:
TP Level Price Notes
TP1 $0.105 First resistance / psychological level
TP2 $0.127 Strong resistance – expect rejection here
TP3 $0.15–0.16 Major extension target if strong momentum
Stop-Loss Strategy:
Strategy Type Placement
Conservative Below $0.073
Aggressive Below $0.080
Risk Management:
Use position sizing relative to account size (e.g., 1–3% risk per trade).
Adjust stop-loss dynamically if entering at breakout.
Combine with on-chain metrics or volume spikes for higher conviction.
SCENARIOS:
🔼 Bullish Scenario (Blue Up Arrow):
Breakout above wedge → retest → rally toward $0.105+
Break $0.105 confirms macro uptrend continuation
🔽 Bearish Scenario (Blue Down Arrow):
Rejection at wedge top → breakdown of $0.082 → revisit $0.073 support
Below $0.073 would invalidate short-term bullish structure

Technical Analysis – KASPA/USDT (1D) + spot trade planTechnical Analysis – KASPA/USDT (1D)
Trend Structure & Price Action
KASPA experienced a strong bullish rally (highlighted in orange) starting in mid-April, followed by a descending channel (bullish flag) correction (highlighted in green).
Currently, the price is approaching major support zones, indicating a potential reversal opportunity.
Support & Buy Zones (Marked)
Buy Spot 1: ~$0.062–$0.067 → Key historical support, potential bottom range.
Buy Spot 2: ~$0.070–$0.075 → Moderate support, former resistance turned support.
Buy Spot 3: ~$0.078–$0.081 → Current local demand zone and trendline interaction.
These zones represent incremental buying opportunities during correction.
Indicator Analysis
Market Cipher / Divergence Indicators
Multiple bullish divergence signals are forming (green dots), suggesting buyer interest is growing.
Momentum is in deep negative territory and may be bottoming.
RSI (14)
RSI is at 32.95, which is approaching oversold territory (below 30), signaling a potential reversal.
Money Flow Index (MFI)
MFI is at 19, which is also considered oversold, showing capital is leaving but likely nearing exhaustion.
Stochastic RSI
Stochastic RSI is below 10 (6.22) and starting to cross, indicating a strong potential bullish reversal in the short term.
Trading Plan – KASPA/USDT (Spot Strategy)
Entry Strategy (DCA)
Buy Spot Entry Range Allocation Reason
Spot 1 $0.062 – $0.067 50% Major long-term support, deep oversold zone
Spot 2 $0.070 – $0.075 30% Mid-range support, confirmation zone
Spot 3 $0.078 – $0.081 20% Early entry for aggressive traders
Risk Management
Stop Loss (optional): Below $0.060 (break of long-term structure)
Average Entry (if all 3 zones are filled): ~$0.071 (estimated)
Capital Allocation: Use max 3–5% of total capital per setup for risk control.
Profit Targets
Target Level Price Rationale
TP1 $0.092 – $0.095 Top of descending channel
TP2 $0.105 Previous swing high (April peak)
TP3 $0.120 Breakout and continuation target
KASPA is currently in a healthy correction within a bullish continuation pattern (falling channel). The confluence of oversold indicators (RSI, MFI, Stoch RSI), support zones, and bullish divergence suggests a favorable buying opportunity for swing or position traders. If the price respects these zones, a bounce toward the prior high or breakout levels is likely.

KASPA CUP AND HANDLE (TA+TRADE PLAN)Cup and Handle pattern clearly formed with rounded bottom and emerging handle.
This is a strong bullish continuation pattern suggesting a potential breakout once the handle completes.
The neckline resistance is approximately at $0.12, and a breakout above this could trigger a strong upward move.
Support & Resistance Zones (S/R)
Current Price: $0.10895
Major Resistance Levels:
$0.12 (neckline)
$0.14
$0.16
$0.19 (pattern target)
Major Support Levels:
$0.10
$0.085
$0.065
Volume Analysis
Volume increased during the formation of the right side of the cup – a bullish signal.
Volume has decreased slightly during handle formation, which is expected.
Indicators
RSI (14): 52.89 – Neutral zone. Not overbought or oversold. Room for upward movement.
Stochastic (14, 3, 1): 27.76 – Close to oversold; potential bullish crossover incoming.
Money Flow Index (MFI): 62 – Healthy inflow of money, not overbought yet.
Wave Momentum/Cipher B: Shows bullish divergences and momentum building from recent lows.
Price Target (Pattern Projection)
Cup depth: ~$0.12 - $0.06 = $0.06
Breakout target: $0.12 + $0.06 = $0.18–0.19 zone
📈 Trading Plan – KASPA/USDT
Strategy: Cup and Handle Breakout
Entry
Aggressive Entry: Buy near current price ($0.108–$0.11) if expecting early breakout.
Conservative Entry: Buy on confirmed breakout above $0.12 with strong volume (daily close).
Stop-Loss
Place SL below handle low, approx. $0.096–$0.098 (depending on risk tolerance).
Alternative: wider SL below $0.085 support if aiming for longer-term hold.
Take Profit Levels
TP1: $0.14
TP2: $0.16
TP3: $0.19 (pattern target)
Use laddered take-profits for partial exits at each level.
Risk Management
Risk per trade: 1–2% of capital
Use position sizing calculator to adjust size based on SL distance
🔄 Re-entry Plan
If breakout fails, monitor $0.085–0.095 zone for support and potential re-entry on double-bottom or bull flag.
⚠️ Bearish Scenario
Breakdown below $0.085 invalidates cup and handle.
Next support at $0.065.
Reassess structure and macro sentiment.

KAS (Kaspa) – Long Swing Setup from Key SupportKAS is retracing into a key support zone around $0.108, which has previously acted as a springboard for bullish reversals. This level aligns with a potential higher low structure on the daily chart, and offers a favorable risk/reward setup for a swing long.
🔹 Entry Zone:
$0.108
🎯 Take Profit Targets:
🥇 $0.13 – $0.154
🥈 $0.175 – $0.19
🛑 Stop Loss:
Just below $0.097 (breakdown below support invalidates setup)

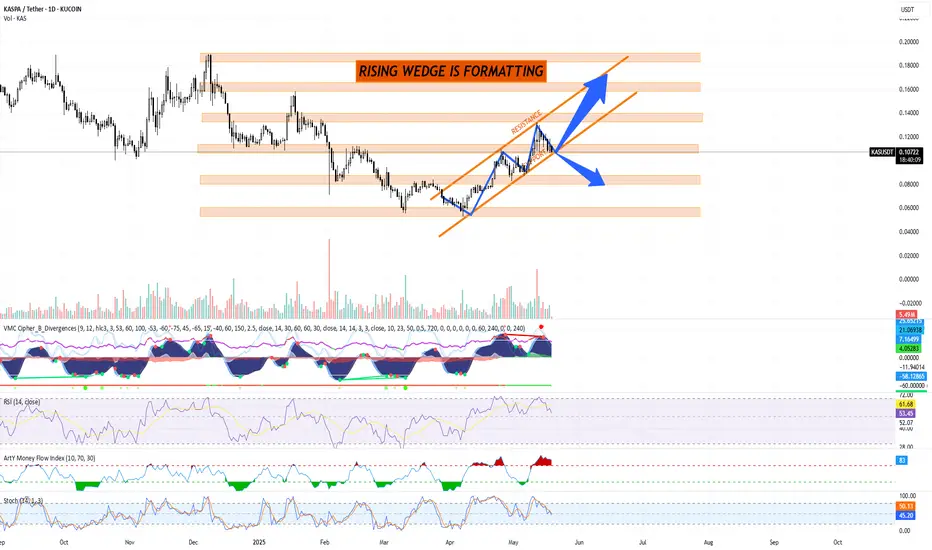
KASPA (KASUSDT) Technical Analysis, 1D Chart KUCOIN + trade planKASPA (KASUSDT) Technical Analysis — 1D Chart by Blaž Fabjan
Date: May 19, 2025
Exchange: KUCOIN
Pair: KAS/USDT
Chart Pattern: Rising Wedge (Bearish Reversal Signal)
A rising wedge is currently forming — characterized by converging trendlines sloping upward.
Support and Resistance levels are clearly outlined in the orange zones.
This pattern often signals a potential breakdown, but an upward breakout is possible with strong momentum.
Key Technical Indicators
1. Volume
Recent volume surge on uptrend suggests buying interest, but declining volume into the wedge tip hints at a possible exhaustion.
2. VMC Cipher B Divergences
Signs of bearish divergence forming; red dots and momentum wave flattening may signal weakening bullish strength.
3. RSI (14)
RSI at 53.27: In neutral territory. Slight bearish divergence observed from recent peaks. Watch for a move below 50 as a confirmation of bearish pressure.
4. Money Flow Index (MFI)
MFI at 83 (overbought zone): Indicates that buying pressure may soon fade, increasing the probability of a correction.
5. Stochastic RSI (14, 3, 3)
Stochastic RSI near 44–49 and crossing downward: Signaling a potential short-term correction.
Key Support & Resistance Zones
🟧 Resistance Levels:
$0.12 – $0.14 (current wedge resistance zone)
$0.16 – $0.18 (next target on bullish breakout)
$0.20+ (major resistance if trend continues)
🟧 Support Levels:
$0.10 (critical support)
$0.08 – $0.09 (wedge breakdown target)
$0.065 – $0.07 (strong demand zone)
Trading Plan for KASPA (KAS/USDT)
Bullish Scenario (Breakout Upwards)
Entry: Above $0.115 with strong volume confirmation
Targets:
TP1: $0.14
TP2: $0.165
TP3: $0.20
Stop-Loss: Below $0.10 (to invalidate wedge structure)
Bearish Scenario (Breakdown)
Entry: Below $0.10 (support break)
Targets:
TP1: $0.085
TP2: $0.072
TP3: $0.065
Stop-Loss: Above $0.11
Neutral/Range Strategy
If KAS trades between $0.10–$0.115 with low volume:
Avoid entry.
Wait for breakout or breakdown confirmation.
Risk Management
Risk/Reward Ratio: Minimum 2:1
Capital Allocation: Max 2–3% of portfolio per trade
Use limit orders to control entry points, especially due to high volatility in crypto markets.
The rising wedge pattern is often a precursor to downside in crypto.
However, macro bullish news, network upgrades, or volume surges may invalidate the bearish setup.
Traders should remain flexible and monitor volume, RSI, and support zones for any signs of reversal.
Nacho the Kat Bullish Falling Wedge Pattern Signals PotentialChart Overview
The chart shows a falling wedge pattern forming on a 4-hour timeframe for "Nacho the Kat" (NACHO/USD). This is a bullish pattern often indicating a potential price breakout to the upside, particularly after a period of consolidation within the wedge.
Price Action Analysis
Current Price: The price is approaching a potential breakout point, with the trend following the pattern outlined in the chart.
Falling Wedge:
The pattern suggests the price has been consolidating within lower highs and higher lows, creating a narrowing range. Historically, the breakout from a falling wedge tends to be upward, especially when volume and momentum indicators align with the trend.
Volume and Momentum Indicators
VMC (Volume Momentum Cipher): Shows divergence (highlighted by green and red dots). The momentum is slowing but still supports the possibility of an upward move once the price breaks above the resistance level.
RSI (Relative Strength Index): RSI is at 55.03, indicating neutral market conditions. There is room for upward momentum before reaching overbought conditions, which further supports the possibility of an upside breakout.
ArtY Money Flow Index: It is currently above 40, showing positive money flow, indicating that buying pressure is still relatively strong.
Stochastic Oscillator: The Stochastic is at 47.29, which is within a neutral range. However, it could suggest potential upward movement, especially if the oscillator crosses above 50.
Support and Resistance Levels
Support: The support level is represented by the strong low section of the falling wedge. A breakdown below this level could invalidate the pattern.
Resistance: The resistance lies at the upper edge of the falling wedge. Once the price breaks this level, it could indicate the start of a bullish move.
Trading Plan
Entry Point:
Wait for a confirmed breakout above the upper resistance of the wedge. A break above this level will provide a clearer confirmation of upward movement.
Consider entering the position at or above 0.0000057 USD.
Stop-Loss:
Place the stop-loss below the lower trendline of the wedge to limit potential losses in case the breakout fails. A reasonable stop-loss could be around 0.0000045 USD.
Take-Profit Targets:
Short-Term Target: After a breakout, aim for a conservative target around the next resistance at 0.0000065 USD.
Long-Term Target: If momentum continues to build, the next potential resistance levels may be around 0.0000075 USD.
Risk Management:
As with any trade, ensure to use proper risk management by not risking more than 1-2% of your total capital per trade.
Keep an eye on the volume and momentum indicators. If they show signs of weakening before the breakout, consider reducing position size or waiting for more confirmation.
Final Thoughts
The falling wedge pattern suggests that "Nacho the Kat" cryptocurrency may be preparing for a bullish breakout, but it's essential to monitor price action carefully. A strong breakout with increasing volume will likely signal further gains, while a failure to break the wedge resistance could lead to further consolidation or downside risks.

Kaspa on Its Path to Glory (TA + Trading Plan) + UPDATETechnical Analysis for KASPA (KAS)
Current Price: 0.11268 USD
Timeframe: 4-Hour Chart
Indicators and Key Observations:
Price Action: Kaspa is currently in an ascending triangle pattern, with price action approaching the resistance line, which has been tested multiple times without a clear break. This pattern indicates the possibility of a breakout if the price moves above the resistance line.
Support Zone: The support level has been consistent, forming a base near 0.1070 USD. This is a crucial area where buying interest has been observed.
Resistance Line: The price is approaching the resistance at around 0.1130 USD. A breakout above this level could signal bullish continuation towards higher targets (potentially 0.1900 USD as indicated by the chart’s blue arrow).
Technical Indicators:
VWC Cipher B Divergences: The indicator shows bullish signals, suggesting that price might continue to rise, especially if it successfully breaks the resistance line.
RSI (Relative Strength Index): The RSI is sitting at around 52.96, indicating that the asset is neither overbought nor oversold. This gives space for potential bullish momentum.
MFI (Money Flow Index): The MFI is relatively neutral, indicating that there is no immediate imbalance between buying and selling pressure.
Stochastic Oscillator: The oscillator shows a potential bullish crossover, with the signal line moving towards the overbought zone.
Trading Plan for KASPA (KAS)
Entry Strategy:
Long Entry: Consider entering a long position once the price breaks and closes above the resistance line around 0.1130 USD. Look for confirmation through a strong green candle to ensure momentum continuation.
Target: The primary target for this trade is 0.18 USD, as indicated by the blue arrow in the chart. A second target can be placed near the psychological level of 0.20 USD, depending on market conditions and price action.
Stop-Loss Strategy:
Place the stop-loss slightly below the support zone, ideally around 0.1060-0.1070 USD, to protect against a false breakout. The stop-loss should be adjusted as the price moves in your favor to lock in profits.
Risk-Reward Ratio:
The risk-reward ratio for this trade is favorable, as the potential upside (0.18-0.20 USD) significantly outweighs the downside risk (stop-loss below 0.1070 USD). A risk-reward ratio of 2:1 or higher is ideal for entering the trade.
Volume Confirmation:
Ensure that the breakout above resistance is accompanied by an increase in volume. Low-volume breakouts can lead to false signals, so confirming the move with higher-than-average volume is crucial for a successful trade.
Risk Management:
As always, never risk more than 2% of your trading account on any single trade. Use proper position sizing and adjust your stop-loss accordingly to maintain a controlled risk profile.
Recent News - Crescendo Upgrade 🚀
Today, Kaspa has rolled out its Crescendo upgrade, which boosts the network speed to 10 blocks per second. This is a major leap in scalability, enhancing transaction speed and efficiency. The upgrade is expected to drive greater adoption and increase investor interest, potentially providing additional support for the upward momentum in the KAS market.
Kaspa (KAS) is showing signs of bullish momentum, with key technical indicators pointing to a potential breakout above resistance. The recent Crescendo upgrade adds further optimism for the coin's future prospects, making this an exciting trade to consider. Be sure to monitor price action closely and implement strict risk management strategies for optimal results.

Kaspa Update, Including Targets (PP: 344% & 496%)If you are a Kaspa trader, holder or lover, let me start by saying that the chart looks great. It looks awesome to say the least.
Looking at the red dashed line on the chart, we can see that KASUSDT produced a perfect bottom and is now on the bullish zone.
Looking at the blue line, both the horizontal line and EMA21, we can see this week is breaking above a strong resistance level, the lows matching 4-November and 29-April from 2024. This weekly candle is also full green and trades at the highest price since February.
Ok, now that the basics are in, let me take some time for a greeting...
Good afternoon my fellow Cryptocurrency trader, how are you feeling in this wonderful day?
Now that EMA21 weekly is being conquered as resistance, bullish growth is about to be fully confirmed.
The signals are in. The Altcoins are bullish and this we already know long ago. Bitcoin is trading safely and strongly above 100K and once Bitcoin becomes strong, the Altcoins follow; Kaspa is set to grow.
We have several targets on the chart. The certainty level for a bullish wave is high, 100%. First target is easy and should be ignored, 0.148 and 0.174, these are too easy so we aim higher.
New ATH is set at the 1.618 Fib. extension sitting at 0.303. This is a good target but still easy. The next target is 0.458 and that's a target where we should consider taking some profits but, it can go higher and it is very likely to go much higher.
Thanks a lot for your continued support.
I hope that you enjoy the content.
Namaste.

KAS – Long Spot Trade Setup (Structural Recovery in Play)KAS is beginning to show early signs of reversal, reclaiming the 20-day SMA after forming a double bottom near the $0.087 zone. This signals a potential shift in momentum and offers a favorable risk-reward opportunity.
🔹 Entry Zone:
$0.087 – $0.094
🎯 Take Profit Targets:
🥇 $0.108 – $0.120
🥈 $0.133 – $0.154
🛑 Stop Loss:
Just below $0.080

KASPA Structure Analysis – Downtrend BreakoutAfter retesting the $0.05 demand zone (previous resistance dating back to August 2023), BITGET:KASUSDT reclaimed the 50-day EMA (yellow) and tested the 200-day EMA (orange), before a brief pullback with the 50-day EMA acting as support.
Key Levels
• $0.050-$0.060: Main demand zone
• $0.083: Current support, reinforced by 50-day EMA
• $0.105: Current resistance, reinforced by 200-day EMA
• ~$0.120: HVN and potential resistance
• $0.155-$0.160: HVN, previous S/R and potential resistance
• $0.180-$0.200: Main supply zone
Here's a weekly chart with volume profiles for more context:
Considerations
• The breakout from the recent downtrend, and the break above the 50-day EMA followed by a retest as support, is a good sign for the bulls.
• If the 200-day EMA is successfully reclaimed, it could offer a good shot at retesting the main supply zone in the $0.180-$0.200 area.
• Conversely, a sustained break back below the 50-day EMA could lead to another test of the $0.050-$0.060 main demand zone.
Neutral outlook until a break above 200-day EMA or below 50-day EMA.

Kaspa Bullish Signal Revealed —Focus On The Long-TermKaspa just broke decisively above EMA55 on the daily timeframe, opening up two major targets for this current advance and confirming at least 3 months of growth for this bullish wave and period.
Now, every time a strong resistance level is hit, there is a retrace.
When a strong move happens, there is a pause.
The market never moves up, up, up unless it is in a bull run phase. The market also never moves straight down; the market moves in waves.
So it is natural to see a pause after a strong bullish breakout. After several days of pause, we get additional growth.
Look at the bigger picture, consider this; From the 7-April low to yesterday's high Kaspa is up by 89%. You see? Nice growth and this growth will continue long-term, but long-term.
You can be certain that the market will produce higher highs and higher lows, but this does not remove the possibility of flash crashes and shakeouts, in fact, these type of moves are part of normal market behavior, not the exception but the norm.
When people see strong bullish action they tend to rush, jump and buy-in. They don't buy when prices are low but when the breakout happens out of excitement, an impulse.
What happens is that the market stops and go bland for a few days. This impulse dies out and these people close the trade at lower prices, and then the market resumes growing.
You can do good; you simply wait/hold and it will grow.
You should buy when I publish my charts. If you bought out of excitement, focus on the long-term. FOCUS ON THE LONG-TERM.
Thanks a lot for your continued support.
Namaste.

Kaspa still looking strong... however....KAS has gotten some follow-through since the last update. The price is now hitting local resistance. At this point, we are hoping for a breakout and a confirmation of a higher high. The good news is that momentum is not oversold yet. Short-term bearish responses can be good levels for DCA.
Full TA: Lin in the BIO

Kaspa looking for a bounce!$KASPA looks to have found a local bottom at .05!
I see clear support structure developing between the two price swings in 2023.
A retest of this area with increased volume would confirm this as an area of support!

KAS ANALYSIS (12H)A significant trendline has been broken on the chart, and a bullish iCH formation has also formed. Additionally, a liquidity pool is visible above the chart, which is expected to be swept soon.
The demand zone is our entry area. If the price reaches this zone before touching Supply 2, we can consider entering a position.
A daily candle close below the invalidation level will invalidate this analysis.
Do not enter the position without capital management and stop setting
Comment if you have any questions
thank you

KAS looking for reversal. Trading moment incoming. KAS is bouncing off of horizontal support however a pivot structure is needed to entertain a trend reversal. Momentum and trend oscillators show signs of bullish divergence, however, a choch would provide good confluence.
Full TA: Link in the BIO

Kaspa: Your Altcoin ChoiceI normally hide the numbers. I don't know where nor when I got into this habit but it is something that I've been doing. That is the 0 and 1 for the Fibonacci retracement tool. Here I am leaving it in full view so you can better appreciate but I will try to explain.
Corrections happen, all the time. Corrections are a normal part of the market cycle, market action and price dynamics. When there is a strong rise, this is balanced out/followed by a strong correction. When the rise is a small, corrections can also be very small.
Kaspa went through a massive bullish period. It beat most of the market and it kept on going. For this reason, it had to undergo a strong correction.
A correction within a bullish trend can reach the 0.382 Fib. retracement level easily, sometimes higher. Lower can happen but they tend to be short. When a bullish trend ends, the correction can go lower hitting 0.618 or 0.786. Here, for KASUSDT, we can see support being found exactly at 0.786 Fib.
The current correction is already 75% strong. This is a huge correction by any and all standards and we are not in a bear market year. This is a bull market year. In bear markets, for Cryptocurrencies, corrections can reach 80%, 90% and even 99%. Some pairs can go beyond 100%. Strong pairs like this one wouldn't go beyond 85-90%. Noticing again the pre- bull market situation, this a correction in anticipation of massive growth. Those in the know, sell and take profits because the market will blow up, literally. Boom... UP!
So all is good and Kaspa will recover based on the long-term. Just as the bullish cycle for Kaspa was an extended one, the same can happen in reverse. Prices can drop some more, there can be some shakeouts, stop-loss hunt, but no need to worry at all. In Crypto, what goes down, is sure to recover and grow strong.
We are only about to get started. In 2023 Kaspa corrected for two and a half months, then massive growth. This time, we have a 252 days long correction, more than 8 months, this is enough bearish action to support years of growth. That is, when the correction is over, within weeks or months, the next cycle will last for years.
How about that for hope?
Thanks a lot for your continued support.
Namaste.

KASPA Support Bounce #KASPA price action has been a rollercoaster lately. After a steady decline from its highs, it hit a local low around $0.06 recently. Since then, it’s bounced nicely.
This rebound from key support, paired with growing volume, hints at renewed buyer interest
— could be a sign of strength returning to $KAS!
