KASPA middle term targetsMEXC:KASUSDT
Possible Targets and explanation idea
➡️Since summer 2022 KAS gain over 25000% without corrections
➡️Since listing on MEXC we are only in distribution zones on weekly
➡️Waiting potential small correction and pump to 0.5 extension fib level 0.06
➡️Forming divergency and TD pattern before massive correction after October/November
➡️In accumulation zone to everyone who wanna buy again will be time for accumulation
➡️At 0.06 people who bought at listing price will be in 12000% gains profit.
Hope you enjoyed the content I created, You can support with your likes and comments this idea so more people can watch!
✅Disclaimer: Please be aware of the risks involved in trading. This idea was made for educational purposes only not for financial Investment Purposes.
---
• Look at my ideas about interesting altcoins in the related section down below ↓
• For more ideas please hit "Like" and "Follow"!
Kas

KASUSD Pull-back soon, which will be a buy opportunity.Kaspa (KASUSD) has been on a 5-day bullish run as it first consolidated on the 1D MA50 (blue trend-line) and bottom (Higher Lows trend-line) of the 5-month Channel Up, solidifying it as the Support.
The 1D RSI is extremely overbought above 80.00 and soon that should transcend into a technical pull-back. The current rise resembles that of June, which extended to +105%, then pulled-back near the 0.5 Fibonacci retracement level and the 1D MA50 and started the final and most aggressive leg of +155% to the Channel's new Higher High.
As a result we will look to buy at the end of a potential 1 week pull-back and target 0.16000 (estimated +155%).
-------------------------------------------------------------------------------
** Please LIKE 👍, FOLLOW ✅, SHARE 🙌 and COMMENT ✍ if you enjoy this idea! Also share your ideas and charts in the comments section below! This is best way to keep it relevant, support us, keep the content here free and allow the idea to reach as many people as possible. **
-------------------------------------------------------------------------------
💸💸💸💸💸💸
👇 👇 👇 👇 👇 👇

KAS MIGHT FALL : Bearish Divergence 📉 It's crucial to approach trading with a discerning eye. The KAS token has recently formed a significant rising wedge pattern, a bearish indicator, and to add to the complexity, it's showing signs of a bearish divergence. This double whammy serves as a warning to traders to exercise caution. 📊🚫
The Rising Wedge Pattern:
Rising wedges are typically bearish patterns, suggesting a potential price decrease. However, the crypto world is known for its unpredictability, so it's wise to be cautious. 📉🐻
Bearish Divergence:
Adding to the intrigue is the presence of a bearish divergence, where price forms higher highs while the corresponding oscillator (like RSI) creates lower highs. This phenomenon signals potential weakening in buying momentum. 📈📉
A Word of Caution:
It's crucial for traders to tread carefully when considering positions on KAS:
Risk Management: Employ rigorous risk management strategies, such as stop-loss orders, to safeguard your investments.
Thorough Research: Always conduct thorough research into the fundamentals and recent news related to KAS to make informed decisions.
Patient Entry: Should you consider short positions, exercise patience and wait for a confirmation of the bearish trend. This might involve a retest of the wedge border.
Conclusion:
The cryptocurrency market is known for its unique characteristics, and patterns can be informative, but they don't always guarantee outcomes.
Market dynamics, liquidity, and unpredictable events can influence prices, and traders should remain vigilant and adapt their strategies accordingly.
While the rising wedge and bearish divergence are worth noting, they are not the sole determinants of market movements. Trade wisely, and always be prepared for the unexpected.
Happy trading,
📉
❗️Get my 3 crypto trading indicators for FREE! Link below🔑


KAS | LONG - ABC CorrectionKAS is one of the strongest coins in the bear market at this moment.
We just had our ABC correction and now the MACD-Histogram is showing a bullish divergence.
KAS corrected to the golden ratio on the Fib and order block.
All together, I'm looking for a long trade, keep risk low!

Ascending Triangle on KAS - BULLISHLooks like there's potential for KAS to form an ascending triangle here.
Could fill out the entire shape shown in this chart, or break out sooner than later.
My bias is that it doesn't get filled out completely, but we'll see...

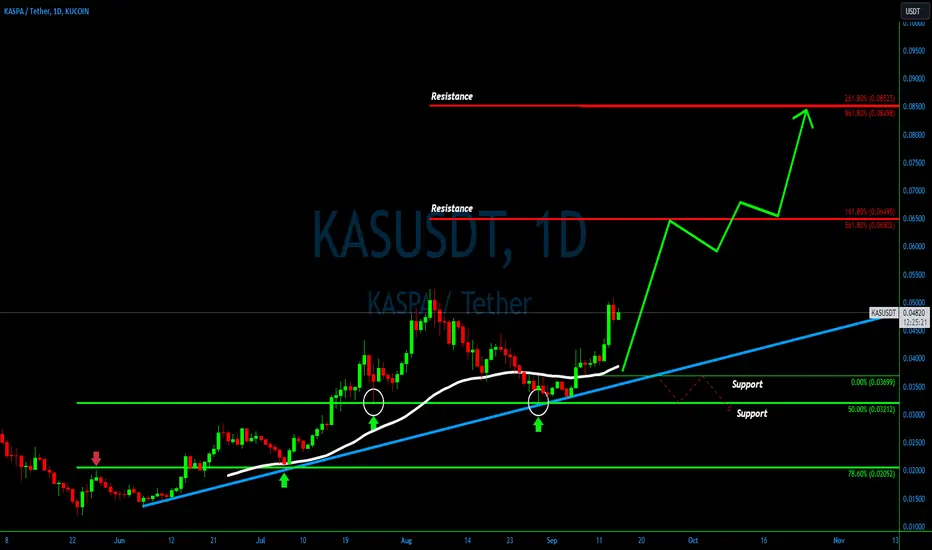
Charting the Path - KASUSDT Uptrend Story💎#KASUSDT has recently delivered an impressive performance, marking an almost 60% price surge since the month's commencement. This upward trajectory initiated following a bounce from the 50% Fibonacci support level at $0.032. Simultaneously, we observed a decisive rejection of the long-term uptrend trendline. These two pivotal events propelled the price upward, breaching the 50 Exponential Moving Average on the daily chart.
💎This price action underscores the credibility of a robust uptrend, significantly enhancing the likelihood of further growth. Consequently, #KASPA is poised to set its sights on one of the double Fibonacci resistance levels, situated at either $0.065 or $0.085.
💎However, prudent traders, or Paradisers as we like to call them, remain vigilant for opportune buying moments amidst the ascent. They avoid chasing the asset at its peak. Simultaneously, it's imperative to prepare for the scenario in which the price breaks below the recent support at $0.036. Such an occurrence would cast doubt on the continuation of the uptrend.
💎In light of these factors, implementing a sound money management strategy alongside clearly defined support and resistance levels is imperative for a well-rounded approach to trading.
KAS/USDT planning downward move? 👀 KASPA Today AnalysisParadisers, gear up for a compelling opportunity with KASUSDT! After experiencing a notable uptick, it now seems to be gearing up for a potential downward shift👀
💎In our previous observations, we noticed that what was once a supply zone has transformed into a demand area. The price disregarded the bearish Order Block and soared, only to face resistance at the 0.050924 level. KAS now hovering around a retest of the demand zone.
💎Interestingly, the price has failed to establish a new higher high, and buying pressure appears to be waning. This suggests that selling pressure could be imminent.
💎The fixed volume profile also indicates significant volume at our target level, where the price of KASPA may face rejection. Additionally, there's a bullish Order Block at this level.
Keep your charts updated and Stay one step ahead of the market 🌟 🌴

#KAS/USDT 4h (ByBit) Broadening wedge on resistanceKaspa is facing 200MA where it already got rejected once, seems likely to retrace down to 50MA support.
⚡️⚡️ #KAS/USDT ⚡️⚡️
Exchanges: ByBit USDT
Signal Type: Regular (Short)
Leverage: Isolated (6.7X)
Amount: 5.0%
Current Price:
0.03945
Entry Targets:
1) 0.04020
Take-Profit Targets:
1) 0.03540
Stop Targets:
1) 0.04260
Published By: @Zblaba
$KAS BYBIT:KASUSDT.P #Kaspa #L1 #PoW kaspa.org
Risk/Reward= 1:2.0
Expected Profit= +80.0%
Possible Loss= -40.0%
Estimated Gaintime= 4-8 days

RSI Divergence on the KAS 3 Day Chart flipped GREENRSI Divergence on the $KAS 3 Day Chart flipped GREEN after bouncing off the bottom
Prior examples led to a big rally (2x - 7x)

Lowest risk entry on KAS - BULLISHKaspa currently finds itself at the bottom of the ascending channel, which has been a consistent support level.
Also near the bull market support band (20/21 week sma/ema), which has also been a support level.
Holding until the top end of the channel would provide nice ROI from an entry from this level if it holds again.
We also have a cup and handle (with a higher handle) that is still playing out.

BULLISH WEEKLY HEIKIN ASHIVery bullish looking chart for Kaspa. Following an ascending channel, bouncing off the 20/21 week SMA/EMA (bull market support band)
Heikin Ashi just turned GREEN on the weekly
Looks to be primed for upside!

KAS vs Early BTC: The Ascending ChannelYou can see here that the ascending channel that $KAS finds itself in is very similar to the early channel that BTC traded in before breaking out to $30.
If Kaspa repeats something similar, as it already is doing, it could lead to an epic move north of $1.00 USD.
KAS also consistently bounces off the 20/21 week SMA/EMA as has always done during a bull rally (green and red lines).
Any touches of those moving averages are strong buys, as far as I'm concerned. I'm not sure we will get a touch again in the near term, as the bottom side of the channel may hold as support.
It seems like we are in a deep value zone right now.
Previous monthly ATH close was around .0324, and that has held so far (not shown here). Also confluent with the bottom of the channel.
Downside is limited IMO. Bullish.

Kaspa vs Early BTC: Ascending Channel Breakout to $1.50+You can see here that the ascending channel that $KAS finds itself in is very similar to the early channel that CRYPTOCAP:BTC traded in before breaking out to $30.
If Kaspa repeats something similar, as it already is doing, it could lead to an epic move north of $1.00 USD.
KAS also consistently bounces off the 20/21 week SMA/EMA as has always done during a bull rally (green and red lines).
Any touches of those moving averages are strong buys, as far as I'm concerned. I'm not sure we will get a touch again in the near term, as the bottom side of the channel may hold as support.
It seems like we are in a deep value zone right now.
Previous monthly ATH close was around .0324, and that has held so far (not shown here). Also confluent with the bottom of the channel.
Downside is limited IMO. Bullish.

$KAS following $ADA and $ETH fractalsChance of $KAS reaching a peak by early 2024 if these fractals continue to play out


KASUSDT at 4h resistance, likely to head downThe price has bounced well from the daily support DS1 which was our target for the last short trade. We did not take any long though it was a good opportunity for going long. However, now price is coming close to 4h resistance 4HR1 area. I think this zone shall resist the price and push it down again towards the daily support zone. Since the price has strength moving upwards, I will keep the size small for this short trade.

KASUSDT likely to head to daily support 0.034-0.035The price bounce from hourly support HS1 and hit the hourly resistance HR1. The price is likely to move further down from here towards daily resistance DS1. This makes a short trade favorable here. The target of this short trade should be the daily support DS1 around 0.034-0.035. There is another large time frame idea of the price heading towards weekly support but thats not presented here as we would like to do multiple trades here and therefore, trading mid time frame levels.

KASUSDT at hourly support, likely to bounce to 0.039636The price has been rejected from weekly resistance and currently trading at hourly support. The price is likely to bounce here towards LTF resistance. Therefore a long trade is favorable here. The target of the trade should be 0.039636.

Kaspa (KAS) – Inverse Head and shoulders. 0.04 USD Is in Sight. * In my previous TV idea, I revealed my notion that Kaspa is forming a Cup and Handle pattern with a target of 0.15 USD (I use a log scale).
* Although this Cup and Handle is not complete yet, Kaspa is forming an Inverse Head and Shoulders which gives me more confidence that this Cup and Handle formation will eventually materialize.
* Of course, this prediction business is highly speculative, but I wanted to share, and you can come to your own conclusions.
NFA.
What do you think? Please share in the comments.
Best Wishes.

KAS Coin (Kaspa) - TA and Price PredictionAnalyzing a coin with a short price history is a challenge. In TA we analyze an asset based on past performance and try to project what this past performance may mean for future performance. A coin without a significant past PA is tricky. However, because of it’s incredible PA recently and because of this asset’s fundamentals I will follow it closely and share setups as I see them.
Support:
• Currently KAS found support at the 0.011991 USD level. It was also oversold on the RSI daily and reacted nicely to it. It is still too early to say if the current downtrend is over.
• If the 0.1191 level doesn’t hold it may find support at the 0.009161 level. Note that price usually tends to go back to unfilled wicks, so it is not out of the question.
Resistance:
• 0.022522 USD. Previous HL.
• 0.033101 USD. Previous LH.
• 0.043301 USD. ATH
Accumulation Range:
IMO, any price between current price and 2 cents is good for long-term accumulation.
Price Prediction:
Kaspa is a young asset. The Kaspa blockchain (DAG) still has a lot of development to make. KAS’s Price history also makes it difficult to extrapolate future price. However, we know that this kind of asset can make an astonishing PA if the stars align.
If we take a fib extension from previous low to high, we can see that KAS’s ATH was between the 1 – 1.272 fib extension. Assuming that the next ATH will be between these fib extensions, our price target is roughly between 12-22 cents. Astonishing as it may appear to be, in crypto everything is possible.
If we copy the fractal of Kadena’s meteoric rise during the previous bull market and apply it to Kaspa, we get a price target much higher, but we need to take it with a grain of salt. We are not in a bull market, yet.
Reservations:
This is a high risk, high reward trade. It can be an extremely profitable trade, but it can also fail miserably.
This is a long-term trade. It may take months or even a year before my price target is achieved.
NFA.
Feedback will be appreciated.
Best wishes to all.

Kaspa $KAS coin Kaspa $KAS coin -
What Is KASPA (KAS)?
Kaspa is a proof-of-work (PoW) cryptocurrency which implements the GHOSTDAG protocol. Unlike traditional blockchains, GHOSTDAG does not orphan blocks created in parallel, rather allows them to coexist and orders them in consensus. The Kaspa blockchain is actually a blockDAG. This generalization of Nakamoto consensus allows for secure operation while maintaining very high block rates (currently one block per second, aiming for 10/sec, dreaming of 100/sec) and minuscule confirmation times dominated by internet latency.
Kaspa on 4hr chart MACD crossed signal line (bullish) and RSI has risen above the 50 mark headed north and is trading above the MA all positives so its likely to make gains

KAS don't miss this one.Hello, everyone
I've noticed KAS sometimes moves inverse to BTC, kind of like LINK did in 2018-2019.
It had a massive run up from February to April, and from then grinded down retracing 70%,
The tech itself is a L1 promising BTC security with SOL scalability.
The chart looks bullish.
Don't fade this one.
GL, stay safe. Stay liquid.
