ETH - Long swing tradeLooking to top up on KAS at 0.11789 with TP level at 0.20 somewhere. This is a long-term swing trade.
Kaspaprice

Technical Analysis of KASPA (KAS/USDT) + TRADE PLANPrice Action and Trend Structure:
Uptrend Formation: The chart shows an uptrend leading into the formation of a descending triangle pattern. The price has seen a significant rise, but the recent price action shows consolidation within a triangular range, indicating a potential for either continuation or reversal.
Descending Triangle: The descending triangle is characterized by lower highs and a horizontal support level. This pattern typically signals a bearish breakout if the support level is broken. However, if the price holds the support and breaks above the resistance, a bullish move could be expected.
Current Price Levels:
Support Level: Around 0.1559 (a crucial level to watch for potential breakdown).
Resistance Level: Around 0.1645 (near the upper trendline of the triangle).
Target Zone: If the price breaks above resistance, the next target could be in the range of 0.19 to 0.22, where higher resistance is likely.
Volume Analysis:
Volume Trend: There is a noticeable increase in volume during the down move, suggesting market participants are hesitant, but not necessarily driving a strong sell-off.
The relatively lower volume during price consolidation could imply that the market is waiting for a breakout, either bullish or bearish.
Momentum Indicators:
RSI (Relative Strength Index): The RSI currently sits at 41.32, which is in the neutral zone. This indicates neither overbought nor oversold conditions, suggesting that the price could break in either direction, depending on the next catalyst.
VMC Cipher B Divergence: The divergence shows a potential weakening in the bearish momentum, which could be a signal that the downtrend might be losing strength. However, the market is still within a consolidation phase, so confirmation from price action is needed.
Stochastic Oscillator: The stochastic indicator is at 29.13, which suggests the asset is nearing an oversold condition, with potential for a rebound or reversal if the price breaks upwards.
Other Indicators:
Art Money Flow: At 40.63, the flow is in the neutral range, with no strong buying or selling pressure. This indicates that the market is in a waiting phase, with traders potentially looking for confirmation of a breakout.
Trading Plan for KASPA (KAS/USDT)
Bullish Scenario (Breakout Above Resistance):
Entry Point: If KASPA breaks above the resistance at 0.1645, look to enter a long position.
Target Price: Aim for a price target around 0.19 to 0.22, where higher resistance exists.
Stop Loss: Set a stop loss around 0.15, just below the key support level to minimize risk in case of a breakdown.
Risk-Reward Ratio: This strategy would offer a favorable risk-reward ratio, especially if the price targets are reached.
Bearish Scenario (Breakdown Below Support):
Entry Point: If the price breaks below the support at 0.1559, consider entering a short position.
Target Price: The target for this move could be 0.14, with the potential for further downside depending on market conditions.
Stop Loss: Place a stop loss just above the broken support (around 0.16) to limit losses in case of a false breakdown.
Risk-Reward Ratio: This strategy also provides a favorable risk-reward if the breakdown sustains.
Trade Confirmation:
Volume Confirmation: Ensure that any breakout or breakdown is accompanied by a significant volume increase, confirming the validity of the move.
Momentum Indicators: Use the RSI, Stochastic, and Money Flow indicators to monitor if the momentum supports the direction of the breakout. For bullish trades, look for an RSI above 50 and the Stochastic moving out of oversold territory.
Long-Term Outlook:
Should the price break the upper resistance and rally above 0.22, the next resistance zone could extend to 0.25 or higher, indicating potential for a longer-term bullish trend.
Conversely, if the breakdown below 0.15 results in sustained selling pressure, watch for deeper corrections or consolidation at lower levels.
Summary:
Watch for a breakout above 0.1645 for potential bullish momentum targeting 0.19-0.22.
Watch for a breakdown below 0.1559 for a bearish move targeting 0.14.
Ensure trade confirmation with volume analysis and momentum indicators.
By following this plan, you can effectively manage risk while taking advantage of KASPA's price action.

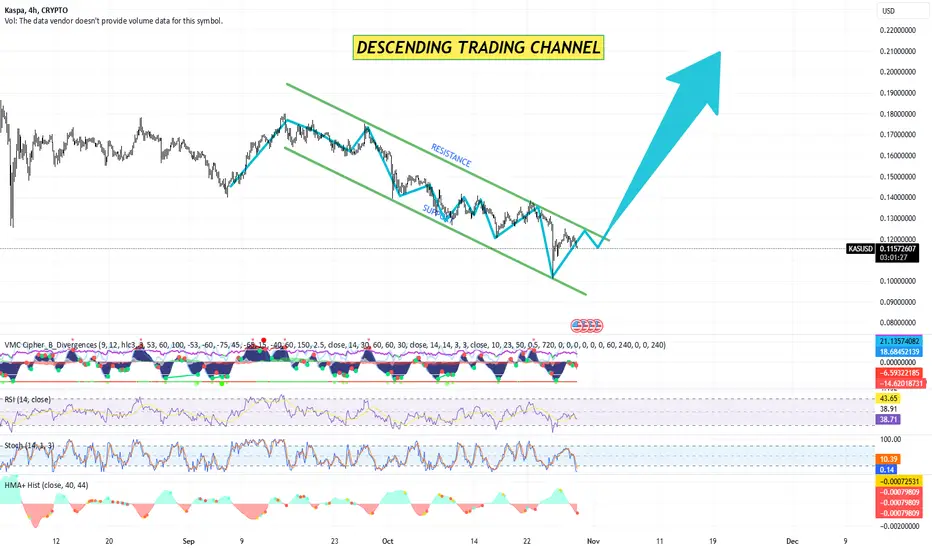
Kaspa – Could this finally be the moment I'm right? TA + TPDescending Trading Channel:
KASPA is currently trading within a well-defined descending channel, with both resistance and support levels guiding its movement.
The price has consistently rebounded from the lower support line while facing rejections near the upper resistance line.
Potential Reversal Signals:
RSI (Relative Strength Index): The RSI is currently around the 39 level, suggesting that KASPA may be entering an oversold zone. This could indicate a potential reversal if the RSI crosses the 40-50 threshold.
Stochastic Oscillator: Showing a reversal from oversold conditions, implying a possible short-term bullish momentum.
VMC Cipher & HMA Histogram: The VMC Cipher indicator and HMA histogram are showing early divergence signals and possible upward momentum, indicating potential price strength if the pattern continues.
Breakout Probability:
If KASPA manages to break above the descending channel’s resistance with sufficient volume, it could signal a bullish breakout.
A breakout above $0.12 with strong momentum could potentially lead to a mid-term upward trend.
Trading Plan
Entry Points:
Aggressive Entry: Enter at the current price around $0.115, anticipating a breakout from the descending channel.
Conservative Entry: Wait for a breakout above $0.12 with a retest and confirmation of support, minimizing the risk of a false breakout.
Stop-Loss Placement:
Place a stop-loss slightly below the current descending support line, around $0.11, to limit potential losses if the price reverses downward.
Profit Targets:
Target 1: $0.14 (near previous highs within the channel).
Target 2: $0.16, aligning with the upper trend lines in a possible new uptrend.
Target 3 (Long-Term): New all-time high (ATH), estimated around $0.22 if momentum sustains.
Time Estimation for New ATH:
Based on previous price cycles and behavior, a bullish breakout from the descending channel could gradually drive the price toward a new ATH in approximately 2-3 months. This timeline considers consolidation phases and typical market momentum seen in KASPA's previous movements.
Risk Management:
Use 1-2% of the portfolio per trade to manage exposure.
Adjust stop-loss and targets as the trade progresses, monitoring for potential corrections or unexpected reversals.
This trading plan and analysis anticipate a bullish breakout based on the current technical setup. However, always monitor for confirmation and adjust for new market conditions.
KASPA trading plan and technical analysis (4h chart frame)Technical Analysis + trade plan by Blaž Fabjan
Pattern: Falling Wedge
The chart shows a clear Falling Wedge pattern, which is typically a bullish reversal signal. This pattern is characterized by a downward sloping resistance and support line that converges. A breakout from this pattern often leads to a price surge.
The breakout is expected as the price is nearing the end of the wedge and has touched the support line multiple times.
Support and Resistance:
Resistance Line: The upper boundary of the wedge acts as a resistance level. A successful breakout would target higher price levels.
Support Line: The lower boundary of the wedge acts as support and has held several times.
Indicators:
RSI (Relative Strength Index): The RSI is around 38.57, indicating that the asset is close to oversold territory. A bounce is likely once the RSI dips further or consolidates.
Stochastic RSI: Currently, the Stochastic RSI is at 30.08 and 37.92. This also indicates a potential reversal from oversold conditions, supporting the bullish outlook.
Volume: The volume has been declining, which is typical before a breakout. Watch for an increase in volume as confirmation of a breakout.
VMC Cipher B: The indicator suggests that the downward pressure is easing. A shift towards green momentum waves could signal the start of the upward trend.
HMA Histogram: This indicator is showing a very slight bullish crossover, reinforcing the potential for a reversal.
Price Action:
Price is currently consolidating just above the support of the wedge. This creates a critical juncture, where the next few candles could determine the breakout direction.
If the price breaks out of the wedge, expect a retest of the former resistance turned support before moving higher.
Trading Plan by Blaž Fabjan:
Entry:
Aggressive Entry: Enter at the current price (~$0.1366) anticipating an imminent breakout from the falling wedge.
Conservative Entry: Wait for a confirmed breakout above the resistance level of the wedge (around $0.145), followed by a successful retest before entering a long position.
Stop Loss:
Set a stop loss slightly below the wedge support, around $0.127 to $0.129, to limit downside risk in case of a false breakout or continued downtrend.
Targets:
First Target (T1): $0.160 - This target aligns with the previous high and key resistance.
Second Target (T2): $0.180 - If the momentum continues, this level could be reached, representing a measured move from the wedge breakout.
Third Target (T3): $0.200 - For more aggressive traders looking to hold longer, this level represents a strong psychological resistance.
Risk Management:
Position sizing should be calculated based on your risk tolerance, but a 2-3% risk per trade is generally recommended. Ensure you are not overexposed.
Use a trailing stop once the price reaches the first target to lock in profits while allowing for further upside.
Confirmation:
Watch for an increase in volume and strong bullish candles breaking through the wedge's resistance line to confirm the breakout.
If the price fails to break out of the wedge or closes below the support, the pattern is invalidated, and short-term bearish action could continue.
Conclusion:
The falling wedge pattern and supporting indicators suggest a potential bullish breakout in the near term. A well-planned entry near the breakout, combined with a proper stop-loss and profit targets, offers a favorable risk-reward ratio for this setup. Be cautious of potential false breakouts and follow through with the technical signals closely.

KASPA TECHNICAL ANALYSIS + TRADE PLAN 2024 BY BLAŽ FABJANTA+TRADE plan by Blaž Fabjan
Descending Triangle Formation:
A clear descending triangle pattern is observed with lower highs (resistance) and a horizontal support around the $0.14 level. This is typically a bearish pattern, but in some cases, it can lead to a breakout to the upside.
The current price is close to the triangle’s apex, indicating a potential breakout soon.
Support and Resistance Levels:
Resistance: The downtrend resistance line is around $0.145 to $0.15. A break above this level would indicate a bullish reversal.
Support: The horizontal support around $0.14 has been tested multiple times. If the price breaks below this, it could trigger a further decline toward the next major support at around $0.13.
Indicators:
Volume Moving Average Convergence Divergence (VMAC): There are visible divergences, suggesting that momentum might be building. The overall indicator seems to support a bullish divergence.
Relative Strength Index (RSI): The RSI is near the oversold region (~35.49). This suggests that selling pressure might be easing, and a reversal could be imminent.
Stochastic Oscillator: The stochastic is near oversold levels, which often precedes a bullish move if it crosses upward.
Hull Moving Average (HMA): The histogram is showing signs of reduced bearish momentum, with green candles suggesting a possible bullish shift.
Trading Strategy
Bullish Scenario (Breakout to the upside):
Entry: Consider entering a long position on a confirmed breakout above $0.145-$0.15 (the resistance line). This would signal the end of the descending triangle and likely lead to upward momentum.
Target 1: $0.17, which would align with the projected move from the triangle breakout.
Target 2: $0.19, a previous high and psychological resistance level.
Stop Loss: Place a stop loss below $0.138 to minimize risk in case of a false breakout or bearish continuation.
Bearish Scenario (Breakout to the downside):
Entry: If price breaks below the $0.14 support level with volume, it could signal a bearish continuation. Short positions could be considered in this case.
Target 1: $0.13, the next major support.
Target 2: $0.12, the next significant psychological support level.
Stop Loss: A stop loss above $0.145 (above the resistance) would minimize risk if the trade reverses.
To sum up:
The current technical picture is at a critical point with a descending triangle suggesting a potential breakout in either direction. The oversold conditions in the RSI and stochastic, along with possible bullish divergence, lean towards a bullish breakout. However, be prepared for a downside if the $0.14 support fails.
Monitoring the volume during the breakout is crucial to confirm the direction and strength of the move.

KASPA USDT 4H CHART TA+price predictionHi! Today I will analyze Kaspa / Usdt chart on 4h timeframe and I will look up what's following in near future - price prediction. TA by Blaž Fabjan
The descending triangle is highlighted, signaling a potential bearish continuation or reversal.
1. Resistance is marked on the chart, suggesting that the price is struggling to break above that level.
2. Support is seen near the base of the triangle. If this support level breaks, a more significant downside is expected.
Indicators:
VMC Cipher Divergences: Suggesting a mix of bullish and bearish divergences. Current momentum appears bearish, as evidenced by the divergences. However, there could be a potential reversal, depending on the market structure.
RSI (Relative Strength Index): Sitting near the lower range (~42.77), which suggests that the asset is not yet oversold, but it's approaching a level that could present a buying opportunity if oversold conditions are met.
Stochastic RSI: It appears oversold (~42.35), indicating that a reversal or upward momentum might be due soon.
Price Action:
The chart shows a potential downward move towards the lower boundary of the triangle, which is marked with an emoji representing the target zone. A bounce from this zone may lead to a bullish breakout, as indicated by the upward arrow.
If the price falls below the triangle, the next support is likely around the $0.1500 level (as per the emoji), with a possible further decline if that level is breached.
Volume:
The volume appears stable, but no significant spikes indicate a strong trend change or momentum yet. Low volume during a potential breakdown would suggest a weaker move, while a volume spike could confirm the breakout/breakdown.
Trading Plan
Short-Term Outlook (Bearish Continuation):
Entry: If the price breaks below the current support at ~$0.1600, short positions could be considered, targeting the next support near $0.1500 or lower.
Stop Loss: Set just above the resistance level, around $0.1700, to minimize risk.
Target: Short-term targets would be $0.1500 (first support), potentially moving lower depending on market conditions.
Bullish Reversal (Medium- to Long-Term Outlook):
Entry: If the price bounces off support (as indicated by the chart), wait for confirmation of a reversal before entering. Look for a close above $0.1700 as a bullish sign.
Stop Loss: Set below the triangle's lower boundary at ~$0.1550.
Target: First target could be around $0.2100, following the chart’s indication of a potential sharp upward movement. Breakouts from descending triangles often lead to significant upward momentum.
Confirmation:
Wait for confirmation of direction either through volume increase or a clear breakout from the triangle. Trade cautiously within the triangle as price movements could be choppy.
In summary, the chart suggests a possible short-term bearish movement towards the $0.1500 level, followed by a potential bullish reversal. Watch for breakout confirmation and act accordingly based on the defined trading plan.

KAS below channel with C&H pattern + ascending triangleKAS is booming in popularity on Twitter/X.
Proof of work token featuring BlockDAG technology.
BLOCKDAG Feature: multiple transactions are added to blockchain in a web-like formation
vs
BLOCKCHAIN: Single transactions added to the chain in a single line.
Cup and Handle Pattern formed and playing out.
Turned into an Ascending Triangle.
Both of these are large bullish formations.
Future Resistances based on Fibonacci Levels: $0.23, $0.30, $0.38
Triangle Invalidation Level: $0.155
Support Levels: $0.14, $0.13, $0.125
Average Volume increasing from last month.

Technical Analysis of KAS/USDT (4-Hour Chart) #kaspa $kas #usdtTechnical Analysis of KAS/USDT (4-Hour Chart) by Blaž Fabjan
The chart displays a falling wedge pattern, which is typically a bullish formation, indicating a high probability of an upward breakout.
Indicators:
VMC Cipher B Divergences: This indicator shows bullish divergences at multiple points, supporting the possibility of an upward breakout.
RSI (14): Currently at 39.82, indicating the market is somewhat oversold and we may expect price growth.
Stochastic Oscillator (14, 1, 3): Values are 34.88 and 36.88, indicating an oversold condition, often a buy signal.
Recommended Entry Points for Trading:
Intra-Day Trading:
Entry: $0.145 (at the current price or upon a slight dip)
Target Price: $0.155 (first resistance level)
Stop Loss: $0.140 (to protect against significant losses)
Swing Trading:
Entry: $0.145 (at the current price or upon a slight dip)
Target Price: $0.165 - $0.170 (potential breakout from the falling wedge)
Stop Loss: $0.135 (to protect against significant losses)
Recommended Exit Points for Trading:
Intra-Day Trading:
Exit Price: $0.155
Alternative Exit Price: $0.150 (if the market shows signs of weakness)
Swing Trading:
First Target Price: $0.165
Second Target Price: $0.170
Exit Price on Reversal: $0.135 (to protect against significant losses)
Summary:
Based on the technical analysis and applied indicators, the current trend for KAS/USDT is positive, with potential for an upward breakout from the falling wedge. Recommended entry points are at the current price of $0.145 with target prices of $0.155 for intra-day trading and $0.165 - $0.170 for swing trading. Closely monitor the market and use stop loss to protect against unexpected downturns.

KASPA Repeating it again?Kaspa coin is performing again the same pattern it played some weeks ago. If this pattern is goin to repeat again, we could see a pump that could lead the price around $0.24 (i have multiple confluence about this target) in the next months. In order to see the pump, the support level at $0.10/$0.09 must hold

Crypto Surge: Navigating Kaspa's Momentum and Fibonacci Signals Keeping a close eye on Kaspa! The recent surge, a whopping 20% in just 7 hours, indicates some serious momentum. Still riding the ATH wave, and the Fibonacci analysis suggests that hitting the -.618 might be the key for the next leg up. The last 7 hours showing an 11.1% rise - exciting times! Additionally, the RSI is now moving above the MA, adding more bullish signals. Let's see if Kaspa continues to ride the upward trend. CryptoInsights KaspaJourney MarketAnalysis

Kaspa vs. Bitcoin: A Tale of Two Crypto TitansKaspa vs. Bitcoin: A Tale of Two Crypto Titans
In the ever-evolving world of cryptocurrency, new contenders emerge to challenge the established giants. Among them stands Kaspa, a rising star boasting innovative technology and a dedicated community. While Bitcoin remains the undisputed king, Kaspa presents a compelling alternative with its unique features and potential.
Technological Divergence:
The most fundamental difference lies in the underlying technology. Bitcoin operates on a traditional blockchain, a linear chain of blocks recording transactions. Kaspa, on the other hand, utilizes a Directed Acyclic Graph (DAG), offering faster transaction speeds and scalability. This DAG structure allows for concurrent transactions, significantly increasing throughput compared to Bitcoin's single block per 10 minutes.
Pros and Cons:
Kaspa:
Pros:
Faster Transactions: Kaspa boasts significantly faster transaction speeds, enabling near-instantaneous confirmation compared to Bitcoin's hour-long wait times.
Scalability: The DAG architecture allows for theoretically unlimited scalability, potentially accommodating millions of transactions per second.
Fair Distribution: No pre-mine or ICO ensures a fair launch with an even playing field for all participants.
Mining Efficiency: Kaspa's mining algorithm is designed to be energy-efficient, offering a more sustainable alternative to Bitcoin.
Cons:
Market Maturity: Kaspa is a young project with a relatively small market cap compared to Bitcoin, making it more susceptible to market fluctuations.
Development Stage: While the technology is innovative, it is still under development, and its long-term viability remains to be seen.
Limited Adoption: Kaspa's acceptance and use cases are still in their infancy, limiting its real-world application compared to Bitcoin.
Bitcoin:
Pros:
First Mover Advantage: Bitcoin enjoys the first-mover advantage and established brand recognition, leading to widespread adoption and high liquidity.
Security and Stability: Bitcoin's network is extremely secure and has proven its resilience over time, making it a trusted store of value.
Large Ecosystem: A vast ecosystem of businesses and services supports Bitcoin, facilitating its use in various aspects of the economy.
Cons:
Scalability Issues: Bitcoin's blockchain technology struggles with scalability, resulting in slow transaction speeds and high fees.
Energy Consumption: Bitcoin mining consumes a significant amount of energy, raising concerns about its environmental impact.
Centralization Concerns: Mining pools control a large portion of the network, potentially leading to centralization and manipulation.
Price Target:
Predicting the future price of any cryptocurrency is a near impossible task. However, considering Kaspa's promising technology, fair launch, and growing community, its price potential is attracting attention. Some analysts suggest it could reach $100-$200 within the next few years, while optimistic projections even mention $500-$1000 in the long run.
Conclusion:
Kaspa and Bitcoin represent two distinct visions for the future of cryptocurrency. While Bitcoin remains the dominant force, Kaspa offers a glimpse into a potentially faster, more scalable, and sustainable future. Ultimately, the choice between them depends on individual investment strategies and risk tolerance. While Bitcoin offers stability and widespread adoption, Kaspa carries the potential for significant growth and innovation. Regardless of individual preferences, it is clear that both projects are shaping the future of cryptocurrency, pushing the boundaries of technology and challenging the established norms.
*Kaspa began trending late in 2023 as it was listed on Binance Futures. Having already seen an increase of 81,654% since the start of price data. Launched on November 7th, 2021, and the first price data comes from June 1st, 2022, where KAS traded hands for $0.0001699, its all-time low. It traded sideways until November 2022, when it saw a 694% increase in price, reaching almost $0.01 per coin.
After starting 2023 trading at $0.005278 per KAS, the price has since risen to a high of $0.154, an increase of 2,818%.
From May to August 2023, in anticipation of Kaspa’s first Halving event, Kaspa saw a rise of 273%.
Kaspa looks to be in a wave 3 heading to 23c up to 49-50c after it made a cup and handle pattern.
This is not financial advice!

KASPA a Technical Marvel Kaspa MEXC:KASUSDT is displaying an beautiful technical chart, showcasing a high degree of respect for key levels.
Your support means the world, so smash that like button to keep the motivation flowing! 💙💛
The current price action forms a compelling Symmetrical Triangle , setting the stage for next move.
Let's jump into the details!
Key Support Levels:
$0.080
$0.093
$0.114
These support levels act as robust foundations, indicating potential bounce-back points in the event of a downturn.
Key Resistance Levels:
$0.143
$0.177
These resistance levels represent significant hurdles that Kaspa must overcome to move in a sustained upward trajectory.
The presence of a Rising Fibonacci Channel adds another layer to the chart's complexity, reflecting a dynamic uptrend environment . This suggests that Kaspa is in a phase of positive momentum, further enhancing its overall bullish outlook.
As the symmetrical triangle tightens its grip, we should closely monitor the breakout direction for potential trading opportunities.
Keep a watchful eye on Kaspa as it navigates through these critical levels, presenting exciting prospects for those attuned to the nuances of this technical masterpiece.

Kaspa - Will the Bulls remain in control?KASPA is trading within a symmetrical triangle at 4H, after a sharp rise.
If it breaks above, the price should continue to go up in the short term, but be aware that it is extremely overbought on higher timeframes.

KASPA middle term targetsMEXC:KASUSDT
Possible Targets and explanation idea
➡️Since summer 2022 KAS gain over 25000% without corrections
➡️Since listing on MEXC we are only in distribution zones on weekly
➡️Waiting potential small correction and pump to 0.5 extension fib level 0.06
➡️Forming divergency and TD pattern before massive correction after October/November
➡️In accumulation zone to everyone who wanna buy again will be time for accumulation
➡️At 0.06 people who bought at listing price will be in 12000% gains profit.
Hope you enjoyed the content I created, You can support with your likes and comments this idea so more people can watch!
✅Disclaimer: Please be aware of the risks involved in trading. This idea was made for educational purposes only not for financial Investment Purposes.
---
• Look at my ideas about interesting altcoins in the related section down below ↓
• For more ideas please hit "Like" and "Follow"!

KASPA ( Bearish flag)As I have updated my last Kaspa chart regarding the warning of potential drop. I'm just gonna Post a new chart. This channel id only for OGs who don't just blindly follow "TV influencers". As you can see there was a major resistance and we got reflected back from there.

Kaspa (KAS) Is Building a BaseTLDR:
• Kaspa has been moving in an upward sloping channel since October 2022.
• Kaspa Dropped below the channel on May 20th and tested the channel trend line as resistance twice.
• Regardless, this is a base building period and upside is still on the table.
Probable Scenario:
• IMO, it is more likely that KAS will find support at the 0.382 Fibonacci retracement, the 0.02 USD leve,l and push back into the trend channel.
Worst case Scenario:
Worst case scenario for KAS is to drop a parallel channel and hit the Range Low at 0.012 USD.

Kaspa (KAS) Bull Market Price Prediction – Revised EditionTLDR:
• This is a bull market prediction.
• I compared KAS with FTM and ADA because the charts have some similarities.
• Take this prediction business with a pinch of salt. I don’t know the future, nobody does.
• However, in bull markets crazy things happen, and if FTM and ADA made it, so can Kaspa. Preface:
• Analyzing a coin with a short price history is a challenge. In TA we analyze an asset based on past performance and try to project what this past performance may mean for future performance. A coin without a significant past PA is tricky. However, because of its incredible PA and this asset’s fundamentals I will follow it closely and share setups as I see them.
• In the previous TV idea, I compared Kaspa’s PA with a fractal of Kadena. Why? Because I wasn’t thinking straight. The only commonality between these two assets is that they are both “Proof of Work.”
• In this revised edition, I tried to compare fractals of cryptocurrencies that have a similar chart structure to Kaspa’s. Two assets that fit the bill are Cardano (ADA) and Fantom (FTM).
• You must understand, at this stage, it is just speculation. I don’t know what the future will bring. I cannot guarantee my performance a month from now, and I sure as hell, cannot guarantee Kaspa's performance in a future bull market.
• However, speculation is all that we can do during the dry season until the rain comes. So, let’s speculate.
Price Prediction:
• Kaspa is a young asset. The Kaspa blockchain (DAG) still has a lot of development to make. KAS’s Price history also makes it difficult to extrapolate future prices. However, we know that this kind of asset can make an astonishing PA if the stars align.
• If we take a fib extension from the previous low to the high, we can see that KAS’s ATH was between the 1 – 1.272 fib extension. Assuming that the next ATH will be between these fib extensions, our price target is roughly 12-22 cents. Considering the Cup and Handle forming on Kaspa’s chart (Linked) this looks reasonable.
KAS Compared to FTM
• Between March 2020 and January 2021, Fantom’s PA looked similar to Kaspa’s current PA.
• An impulsive rise of 3000%.
• A consolidation period in a rounding bottom.
• Followed by another two strong impulsive price movements to the upside.
• Kaspa’s PA looks similar:
• An Impulsive move up of more than 3000%
• Followed by a rounding bottom (in the process).
• If we assume that Kaspa’s continuation will be similar to Fantom’s, in a year from completing the consolidation Kaspa could reach 1.76$.
KAS Compared to ADA:
• Between March 2020 to July 2020, ADA moved in an impulse and had a 770% Price increase.
• Followed by a rounding bottom and another strong move up.
• If we compare ADA’s PA and extrapolate based on ADA’s PA, in eight months, Kaspa’s price could reach 2.65$
Conclusion:
• I hope we are all adults here. We don’t need to take these predictions with a pinch of salt, we need to take it with a shovelful of salt. But I have noticed that most people can easily believe that the worst things could occur to them and cannot imagine that success is also a possibility. KAS is looking good, technically and from a fundamental perspective. When the bull market arrives, reason leaves. Assets can have crazy valuations. Just look at Nvidia. Anyway, whatever will be will be.
• This is a long-term trade. It may take months or even years before my price target is achieved.
NFA.
Feedback will be appreciated.
Best wishes to all.
