KASUSD Channel Down bottom rebound. When to sell again?Kaspa (KASUSD) is trading within a (blue) Channel Down pattern since the July 31 2024 High. The formation only broke for 4 days last December. Last Monday, the price touched the bottom (Lower Lows trend-line) of the Channel Down and today we see the technical rebound reaction in full effect.
The 1D RSI turning oversold (<30.00) is a major part of this. The current Bullish Leg should target at least the 0.618 Fibonacci retracement level at 0.12500, as all 3 previous rebounds within the long-term Channel Down did.
It is very likely to see a rejection there, as it is the top (Lower Highs trend-line) of the diverging (dotted) Channel Down, which was initiated on the December 08 2024 High. We expect the bearish reversal to hit at least 0.07500, potentially at the same time the 1D RSI turns oversold again.
-------------------------------------------------------------------------------
** Please LIKE 👍, FOLLOW ✅, SHARE 🙌 and COMMENT ✍ if you enjoy this idea! Also share your ideas and charts in the comments section below! This is best way to keep it relevant, support us, keep the content here free and allow the idea to reach as many people as possible. **
-------------------------------------------------------------------------------
💸💸💸💸💸💸
👇 👇 👇 👇 👇 👇
Kaspasignals

Technical Analysis of KASPA (KAS/USDT) + TRADE PLANPrice Action and Trend Structure:
Uptrend Formation: The chart shows an uptrend leading into the formation of a descending triangle pattern. The price has seen a significant rise, but the recent price action shows consolidation within a triangular range, indicating a potential for either continuation or reversal.
Descending Triangle: The descending triangle is characterized by lower highs and a horizontal support level. This pattern typically signals a bearish breakout if the support level is broken. However, if the price holds the support and breaks above the resistance, a bullish move could be expected.
Current Price Levels:
Support Level: Around 0.1559 (a crucial level to watch for potential breakdown).
Resistance Level: Around 0.1645 (near the upper trendline of the triangle).
Target Zone: If the price breaks above resistance, the next target could be in the range of 0.19 to 0.22, where higher resistance is likely.
Volume Analysis:
Volume Trend: There is a noticeable increase in volume during the down move, suggesting market participants are hesitant, but not necessarily driving a strong sell-off.
The relatively lower volume during price consolidation could imply that the market is waiting for a breakout, either bullish or bearish.
Momentum Indicators:
RSI (Relative Strength Index): The RSI currently sits at 41.32, which is in the neutral zone. This indicates neither overbought nor oversold conditions, suggesting that the price could break in either direction, depending on the next catalyst.
VMC Cipher B Divergence: The divergence shows a potential weakening in the bearish momentum, which could be a signal that the downtrend might be losing strength. However, the market is still within a consolidation phase, so confirmation from price action is needed.
Stochastic Oscillator: The stochastic indicator is at 29.13, which suggests the asset is nearing an oversold condition, with potential for a rebound or reversal if the price breaks upwards.
Other Indicators:
Art Money Flow: At 40.63, the flow is in the neutral range, with no strong buying or selling pressure. This indicates that the market is in a waiting phase, with traders potentially looking for confirmation of a breakout.
Trading Plan for KASPA (KAS/USDT)
Bullish Scenario (Breakout Above Resistance):
Entry Point: If KASPA breaks above the resistance at 0.1645, look to enter a long position.
Target Price: Aim for a price target around 0.19 to 0.22, where higher resistance exists.
Stop Loss: Set a stop loss around 0.15, just below the key support level to minimize risk in case of a breakdown.
Risk-Reward Ratio: This strategy would offer a favorable risk-reward ratio, especially if the price targets are reached.
Bearish Scenario (Breakdown Below Support):
Entry Point: If the price breaks below the support at 0.1559, consider entering a short position.
Target Price: The target for this move could be 0.14, with the potential for further downside depending on market conditions.
Stop Loss: Place a stop loss just above the broken support (around 0.16) to limit losses in case of a false breakdown.
Risk-Reward Ratio: This strategy also provides a favorable risk-reward if the breakdown sustains.
Trade Confirmation:
Volume Confirmation: Ensure that any breakout or breakdown is accompanied by a significant volume increase, confirming the validity of the move.
Momentum Indicators: Use the RSI, Stochastic, and Money Flow indicators to monitor if the momentum supports the direction of the breakout. For bullish trades, look for an RSI above 50 and the Stochastic moving out of oversold territory.
Long-Term Outlook:
Should the price break the upper resistance and rally above 0.22, the next resistance zone could extend to 0.25 or higher, indicating potential for a longer-term bullish trend.
Conversely, if the breakdown below 0.15 results in sustained selling pressure, watch for deeper corrections or consolidation at lower levels.
Summary:
Watch for a breakout above 0.1645 for potential bullish momentum targeting 0.19-0.22.
Watch for a breakdown below 0.1559 for a bearish move targeting 0.14.
Ensure trade confirmation with volume analysis and momentum indicators.
By following this plan, you can effectively manage risk while taking advantage of KASPA's price action.

KAS LongYup, it's that time again...to take stupid profits from KASPA. Bullish to 0.21 or 0.24 from 0.14 - 0.17. Neutral on fear & Greed, not yet overbought on MACD. Staying in channel well and looking bullish!

KASPA - TRADE PLAN + TECHNICAL ANALYSISTechnical analysis + trading plan for Kaspa (KAS/USD), assuming a bullish continuation pattern as the symmetrical triangle indicates.
Pattern:
The price is forming a bullish symmetrical triangle, generally seen as a continuation pattern in an uptrend.
Current Price:
$0.15529, with the price consolidating within a triangle pattern.
Resistance and Support:
The top line of the triangle represents resistance, while the bottom line is support. The price is expected to break above resistance if the bullish momentum continues.
Indicators:
RSI (Relative Strength Index): RSI is high, around 76.8, indicating overbought conditions. This could mean a temporary pullback before a breakout.
Stochastic Oscillator: It is also in an overbought range, signaling that caution is needed, as the price may consolidate further.
VMC Cipher B Divergence: Suggests bullish divergence with a momentum shift, supportive of a potential breakout.
HMA Histogram: Shows slight bearish momentum, which may indicate a minor pullback before the breakout.
Trading Plan
Entry Strategy:
Breakout Confirmation: Enter a long position if there’s a confirmed breakout above the resistance line of the symmetrical triangle. Confirmation can be a 4-hour candle closing above the triangle with increased volume.
Anticipatory Entry: If you prefer a more aggressive approach, consider entering near the support line of the triangle. This is riskier but allows a lower entry price.
Stop-Loss:
Place a stop-loss below the support line of the triangle, approximately around $0.140. This will minimize losses if the pattern fails and the price breaks downwards.
Take-Profit:
Primary Target: Measure the height of the triangle from its widest point and add it to the breakout point. In this case, the target could be around $0.170 - $0.180 if the breakout occurs.
Partial Profit Levels: Take partial profits at key resistance levels, potentially around $0.165 and $0.175, to lock in gains as the price moves up.
Risk Management:
Set position size according to your risk tolerance. A typical risk is 1-2% of the trading capital on a single trade.
Consider adjusting the stop-loss to breakeven once the price moves halfway to the target.
Monitoring the Trade:
Watch the RSI and Stochastic indicators closely; if they remain overbought and the price struggles to break out, there could be a consolidation or even a reversal.
Look for volume spikes on breakout, as they can confirm the validity of the movement.
Exit Strategy:
Exit if the price fails to break out or if there’s a breakdown below the triangle, which would invalidate the bullish setup.
Consider trailing the stop-loss to secure profits as the price approaches higher resistance levels.

$KAS broke major support and could face a significant drop!CRYPTO:KASUSD has been experiencing steady declines after failing to sustain higher levels over the past few months. It recently broke a critical major support trendline, signaling the potential for further downside.
This breakdown occurred after several attempts to push higher were rejected, especially around the $0.20 range, which had acted as strong resistance in the past.
The break below the trendline, which has held strong for months, signals that selling pressure is intensifying.
We're now closely watching how it reacts within the Supply Zone around $0.1251 - $0.1291. A rejection from here could accelerate the move downward.
Key Levels to Watch:
Short Entry Idea 1: Rejection from $0.1291
Short Entry Idea 2: Rejection from 4H SIBI at $0.1257
TP1: $0.1183
TP2: $0.1079
TP3: $0.0915
Expect further downside if CRYPTOCAP:KAS fails to reclaim these levels soon, as we could see it test Major Demand Zones below.
------------
Disclaimer:
This analysis is for educational and informational purposes only. It is not financial advice, and you should not take it as such. Always conduct your own research and due diligence before making any trading decisions. Markets are highly volatile, and following any chart blindly can lead to significant losses. Trade responsibly and use risk management strategies.

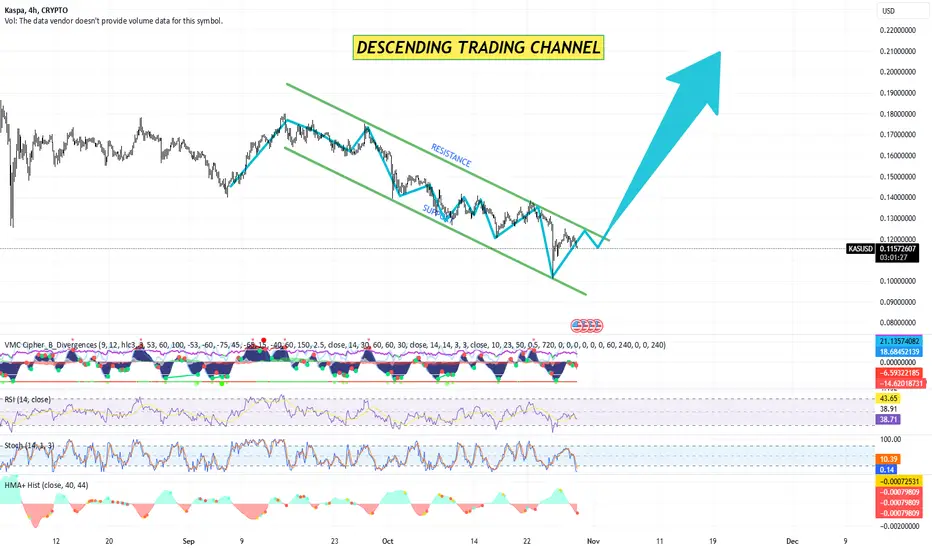
Kaspa – Could this finally be the moment I'm right? TA + TPDescending Trading Channel:
KASPA is currently trading within a well-defined descending channel, with both resistance and support levels guiding its movement.
The price has consistently rebounded from the lower support line while facing rejections near the upper resistance line.
Potential Reversal Signals:
RSI (Relative Strength Index): The RSI is currently around the 39 level, suggesting that KASPA may be entering an oversold zone. This could indicate a potential reversal if the RSI crosses the 40-50 threshold.
Stochastic Oscillator: Showing a reversal from oversold conditions, implying a possible short-term bullish momentum.
VMC Cipher & HMA Histogram: The VMC Cipher indicator and HMA histogram are showing early divergence signals and possible upward momentum, indicating potential price strength if the pattern continues.
Breakout Probability:
If KASPA manages to break above the descending channel’s resistance with sufficient volume, it could signal a bullish breakout.
A breakout above $0.12 with strong momentum could potentially lead to a mid-term upward trend.
Trading Plan
Entry Points:
Aggressive Entry: Enter at the current price around $0.115, anticipating a breakout from the descending channel.
Conservative Entry: Wait for a breakout above $0.12 with a retest and confirmation of support, minimizing the risk of a false breakout.
Stop-Loss Placement:
Place a stop-loss slightly below the current descending support line, around $0.11, to limit potential losses if the price reverses downward.
Profit Targets:
Target 1: $0.14 (near previous highs within the channel).
Target 2: $0.16, aligning with the upper trend lines in a possible new uptrend.
Target 3 (Long-Term): New all-time high (ATH), estimated around $0.22 if momentum sustains.
Time Estimation for New ATH:
Based on previous price cycles and behavior, a bullish breakout from the descending channel could gradually drive the price toward a new ATH in approximately 2-3 months. This timeline considers consolidation phases and typical market momentum seen in KASPA's previous movements.
Risk Management:
Use 1-2% of the portfolio per trade to manage exposure.
Adjust stop-loss and targets as the trade progresses, monitoring for potential corrections or unexpected reversals.
This trading plan and analysis anticipate a bullish breakout based on the current technical setup. However, always monitor for confirmation and adjust for new market conditions.
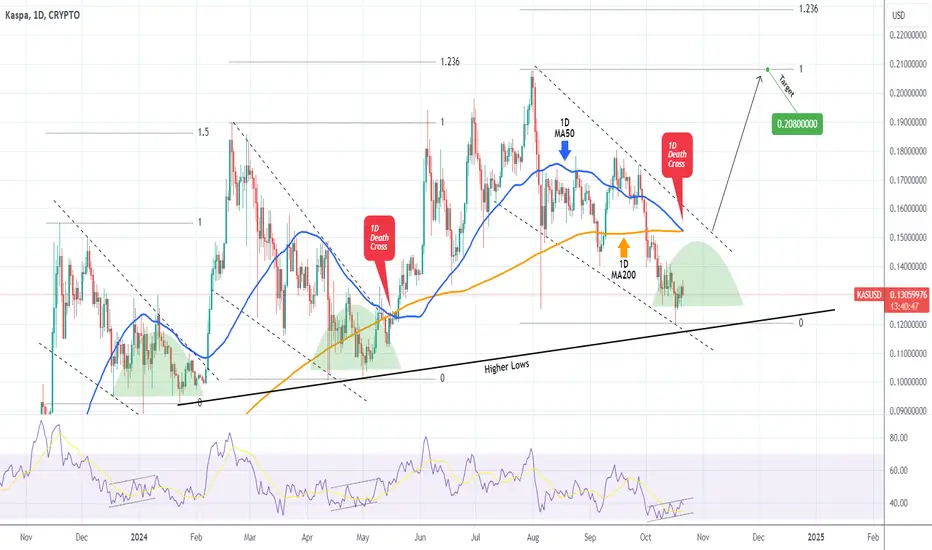
KASUSD Can the 1D Death Cross really save the day???KASPA (KASUSD) has been trading within a Falling Wedge pattern since the July 31 top and is almost on the Higher Lows trend-line that started on the January 23 2024 Low. The key development of the day however, is the formation of the 1D Death Cross, a technically bearish pattern.
Last time it was formed though (May 16), it provided the basis for a strong rally that made a new High. Interestingly enough, the price was also coming off a Falling Wedge at the time that successfully broke above its top. In the meantime the 1D RSI was after a Bullish Divergence, essentially a bottoming process. In fact, it was the same formation of that the Falling Wedge before it (November - December 2023) had, that also broke aggressively above its top.
As a result, we have a potential triple bullish signal and as long as the Higher Lows hold, there are high probabilities of seeing the price break above the Wedge and target at least the previous High at 0.20800.
-------------------------------------------------------------------------------
** Please LIKE 👍, FOLLOW ✅, SHARE 🙌 and COMMENT ✍ if you enjoy this idea! Also share your ideas and charts in the comments section below! This is best way to keep it relevant, support us, keep the content here free and allow the idea to reach as many people as possible. **
-------------------------------------------------------------------------------
💸💸💸💸💸💸
👇 👇 👇 👇 👇 👇
KASPA trading plan and technical analysis (4h chart frame)Technical Analysis + trade plan by Blaž Fabjan
Pattern: Falling Wedge
The chart shows a clear Falling Wedge pattern, which is typically a bullish reversal signal. This pattern is characterized by a downward sloping resistance and support line that converges. A breakout from this pattern often leads to a price surge.
The breakout is expected as the price is nearing the end of the wedge and has touched the support line multiple times.
Support and Resistance:
Resistance Line: The upper boundary of the wedge acts as a resistance level. A successful breakout would target higher price levels.
Support Line: The lower boundary of the wedge acts as support and has held several times.
Indicators:
RSI (Relative Strength Index): The RSI is around 38.57, indicating that the asset is close to oversold territory. A bounce is likely once the RSI dips further or consolidates.
Stochastic RSI: Currently, the Stochastic RSI is at 30.08 and 37.92. This also indicates a potential reversal from oversold conditions, supporting the bullish outlook.
Volume: The volume has been declining, which is typical before a breakout. Watch for an increase in volume as confirmation of a breakout.
VMC Cipher B: The indicator suggests that the downward pressure is easing. A shift towards green momentum waves could signal the start of the upward trend.
HMA Histogram: This indicator is showing a very slight bullish crossover, reinforcing the potential for a reversal.
Price Action:
Price is currently consolidating just above the support of the wedge. This creates a critical juncture, where the next few candles could determine the breakout direction.
If the price breaks out of the wedge, expect a retest of the former resistance turned support before moving higher.
Trading Plan by Blaž Fabjan:
Entry:
Aggressive Entry: Enter at the current price (~$0.1366) anticipating an imminent breakout from the falling wedge.
Conservative Entry: Wait for a confirmed breakout above the resistance level of the wedge (around $0.145), followed by a successful retest before entering a long position.
Stop Loss:
Set a stop loss slightly below the wedge support, around $0.127 to $0.129, to limit downside risk in case of a false breakout or continued downtrend.
Targets:
First Target (T1): $0.160 - This target aligns with the previous high and key resistance.
Second Target (T2): $0.180 - If the momentum continues, this level could be reached, representing a measured move from the wedge breakout.
Third Target (T3): $0.200 - For more aggressive traders looking to hold longer, this level represents a strong psychological resistance.
Risk Management:
Position sizing should be calculated based on your risk tolerance, but a 2-3% risk per trade is generally recommended. Ensure you are not overexposed.
Use a trailing stop once the price reaches the first target to lock in profits while allowing for further upside.
Confirmation:
Watch for an increase in volume and strong bullish candles breaking through the wedge's resistance line to confirm the breakout.
If the price fails to break out of the wedge or closes below the support, the pattern is invalidated, and short-term bearish action could continue.
Conclusion:
The falling wedge pattern and supporting indicators suggest a potential bullish breakout in the near term. A well-planned entry near the breakout, combined with a proper stop-loss and profit targets, offers a favorable risk-reward ratio for this setup. Be cautious of potential false breakouts and follow through with the technical signals closely.

KASPA TECHNICAL ANALYSIS + TRADE PLAN 2024 BY BLAŽ FABJANTA+TRADE plan by Blaž Fabjan
Descending Triangle Formation:
A clear descending triangle pattern is observed with lower highs (resistance) and a horizontal support around the $0.14 level. This is typically a bearish pattern, but in some cases, it can lead to a breakout to the upside.
The current price is close to the triangle’s apex, indicating a potential breakout soon.
Support and Resistance Levels:
Resistance: The downtrend resistance line is around $0.145 to $0.15. A break above this level would indicate a bullish reversal.
Support: The horizontal support around $0.14 has been tested multiple times. If the price breaks below this, it could trigger a further decline toward the next major support at around $0.13.
Indicators:
Volume Moving Average Convergence Divergence (VMAC): There are visible divergences, suggesting that momentum might be building. The overall indicator seems to support a bullish divergence.
Relative Strength Index (RSI): The RSI is near the oversold region (~35.49). This suggests that selling pressure might be easing, and a reversal could be imminent.
Stochastic Oscillator: The stochastic is near oversold levels, which often precedes a bullish move if it crosses upward.
Hull Moving Average (HMA): The histogram is showing signs of reduced bearish momentum, with green candles suggesting a possible bullish shift.
Trading Strategy
Bullish Scenario (Breakout to the upside):
Entry: Consider entering a long position on a confirmed breakout above $0.145-$0.15 (the resistance line). This would signal the end of the descending triangle and likely lead to upward momentum.
Target 1: $0.17, which would align with the projected move from the triangle breakout.
Target 2: $0.19, a previous high and psychological resistance level.
Stop Loss: Place a stop loss below $0.138 to minimize risk in case of a false breakout or bearish continuation.
Bearish Scenario (Breakout to the downside):
Entry: If price breaks below the $0.14 support level with volume, it could signal a bearish continuation. Short positions could be considered in this case.
Target 1: $0.13, the next major support.
Target 2: $0.12, the next significant psychological support level.
Stop Loss: A stop loss above $0.145 (above the resistance) would minimize risk if the trade reverses.
To sum up:
The current technical picture is at a critical point with a descending triangle suggesting a potential breakout in either direction. The oversold conditions in the RSI and stochastic, along with possible bullish divergence, lean towards a bullish breakout. However, be prepared for a downside if the $0.14 support fails.
Monitoring the volume during the breakout is crucial to confirm the direction and strength of the move.

Kaspa technical analysis + trade plan (27.09.2024) by BFTechnical Analysis + trade plan by Blaž Fabjan
Chart Pattern: Falling Wedge (Uptrend Bias)
A falling wedge pattern is present, which typically signals a bullish reversal. In this case, the price seems to be nearing the breakout point of the wedge. The breakout direction is upwards, and this pattern typically leads to a price increase if confirmed.
Support and Resistance Levels
Resistance Line: The upper line of the falling wedge, acting as dynamic resistance.
Support Line: The lower line of the wedge, acting as dynamic support.
Volume
Volume levels indicate significant interest, especially when approaching a potential breakout zone. The volume profile shows that recent trading sessions have been accompanied by a spike in activity, which can be a good sign for momentum.
Indicators
VMC Cipher B (Divergences): This indicator shows divergence signals, indicating possible trend reversals. It appears to be bullish with green dots forming at key points, suggesting an upward move.
RSI (Relative Strength Index): The RSI is around 54.79, which is neutral but slightly tilting towards bullish. It suggests that the market isn't overbought or oversold.
Stochastic Oscillator: Around 75.24, this indicator shows a bullish cross, indicating momentum might be shifting upward, but it's approaching the overbought zone.
HMA+ Histogram: Appears to be indicating short-term momentum change as the trend might be shifting upwards.
Price Prediction/Target
If the falling wedge plays out as expected, the price could target higher levels, breaking the $0.165-$0.170 range. The chart suggests a further upward target in the next phase, as highlighted by the projected arrow and airplane symbol.
Trading Plan
Entry Strategy:
Buy on Breakout: If the price breaks above the resistance line of the falling wedge (around $0.166 or slightly higher), consider entering a long position.
Confirmation: Wait for at least a 4-hour candle close above the resistance to confirm the breakout.
Aggressive Entry: You could also enter once the price reaches near the support line but remains cautious if the breakout has not been confirmed.
Stop Loss:
Place a stop loss below the recent swing low or just under the support line of the wedge (around $0.160). This will protect against a potential fake breakout.
Take Profit Targets:
Short-term Target: $0.175 - $0.180 (the first major resistance after breakout).
Medium-term Target: $0.190 and beyond, as indicated by the chart.
Risk Management:
Avoid risking more than 2-3% of your total portfolio on this trade.
Adjust your position size based on the stop-loss distance and your risk tolerance.
Monitoring:
Keep an eye on the volume and the RSI levels. If RSI enters the overbought zone (above 70), consider reducing your position or securing profits.
Watch for any signs of a failed breakout, as this could lead to a sharp drop back into the wedge pattern.
Exit Strategy:
If the price fails to break out and starts to drop below the support line, exit the trade.
If the price hits the overbought zone on both RSI and Stochastic, it might be wise to secure profits at key levels mentioned.
Conclusion:
The overall outlook based on the chart suggests a bullish breakout is likely if the falling wedge pattern completes. This offers a good risk-to-reward ratio for a long position if managed carefully with proper stop losses and monitoring of key indicators like volume and RSI.

KASPA USDT 4H CHART TA+price predictionHi! Today I will analyze Kaspa / Usdt chart on 4h timeframe and I will look up what's following in near future - price prediction. TA by Blaž Fabjan
The descending triangle is highlighted, signaling a potential bearish continuation or reversal.
1. Resistance is marked on the chart, suggesting that the price is struggling to break above that level.
2. Support is seen near the base of the triangle. If this support level breaks, a more significant downside is expected.
Indicators:
VMC Cipher Divergences: Suggesting a mix of bullish and bearish divergences. Current momentum appears bearish, as evidenced by the divergences. However, there could be a potential reversal, depending on the market structure.
RSI (Relative Strength Index): Sitting near the lower range (~42.77), which suggests that the asset is not yet oversold, but it's approaching a level that could present a buying opportunity if oversold conditions are met.
Stochastic RSI: It appears oversold (~42.35), indicating that a reversal or upward momentum might be due soon.
Price Action:
The chart shows a potential downward move towards the lower boundary of the triangle, which is marked with an emoji representing the target zone. A bounce from this zone may lead to a bullish breakout, as indicated by the upward arrow.
If the price falls below the triangle, the next support is likely around the $0.1500 level (as per the emoji), with a possible further decline if that level is breached.
Volume:
The volume appears stable, but no significant spikes indicate a strong trend change or momentum yet. Low volume during a potential breakdown would suggest a weaker move, while a volume spike could confirm the breakout/breakdown.
Trading Plan
Short-Term Outlook (Bearish Continuation):
Entry: If the price breaks below the current support at ~$0.1600, short positions could be considered, targeting the next support near $0.1500 or lower.
Stop Loss: Set just above the resistance level, around $0.1700, to minimize risk.
Target: Short-term targets would be $0.1500 (first support), potentially moving lower depending on market conditions.
Bullish Reversal (Medium- to Long-Term Outlook):
Entry: If the price bounces off support (as indicated by the chart), wait for confirmation of a reversal before entering. Look for a close above $0.1700 as a bullish sign.
Stop Loss: Set below the triangle's lower boundary at ~$0.1550.
Target: First target could be around $0.2100, following the chart’s indication of a potential sharp upward movement. Breakouts from descending triangles often lead to significant upward momentum.
Confirmation:
Wait for confirmation of direction either through volume increase or a clear breakout from the triangle. Trade cautiously within the triangle as price movements could be choppy.
In summary, the chart suggests a possible short-term bearish movement towards the $0.1500 level, followed by a potential bullish reversal. Watch for breakout confirmation and act accordingly based on the defined trading plan.

KASPA / USDT 4H TIMEFRAME MEXC TECHNICAL ANALYSISFalling Wedge Pattern:
The chart shows a falling wedge pattern, which is a bullish signal. This pattern suggests that the price might soon reverse and move upward.
Oversold Conditions:
The RSI and Stochastic RSI indicators are in the oversold zone. This typically means that the asset is undervalued and could see a price increase soon.
Volume Spike:
There's a noticeable increase in trading volume as the price reaches the bottom of the wedge. This suggests strong buying interest and supports the idea of an upcoming upward move.
Potential Price Target:
If the price breaks out of the wedge, it could move toward the $0.22 to $0.24 range, as shown by the projected arrow on the chart.
Conclusion:
The chart suggests a potential bullish reversal. If the price breaks above the wedge, it could lead to a significant upward move. Keep an eye on the breakout level and consider managing risk by setting a stop-loss below the recent low.
This analysis highlights the key factors indicating a potential price increase for the KAS/USDT pair.

KASUSDT 1WKAS ~ 1W
#KAS Buy from here, a new high will soon be formed.
Target at least 20%++ from here.

KAS: Approaching ResistanceTrade setup : Remain in an Uptrend. It pulled back briefly but made a Higher Low (sign of Uptrend) and broke back above $0.15 key level. Momentum has inflected bullish (MACD Histogram bars are rising). Price is now approaching our near-term target $0.194 for a +25% gain. Now we look for the right entry opportunity in Uptrend. We wait for price to either 1) break above $0.20 to signal continuation of uptrend, or 2) pull back near $0.15 support for another swing trade entry in Uptrend with +25% upside potential back to $0.194.
Pattern : Price is Approaching Resistance , which is a level where it could pause or reverse its recent advance, at least temporarily. Resistance is often a level where price got rejected in the past, or potentially prior Support level that was broken. (concept known as polarity). Once price breaks above resistance, it can advance higher to the next resistance level. Learn to trade key levels in Lesson 7.
Trend : Short-term trend is Strong Up, Medium-term trend is Up and Long-term trend is Strong Up.
Momentum : Price is neither overbought nor oversold currently, based on RSI-14 levels (RSI > 30 and RSI < 70).
Support and Resistance : Nearest Support Zone is $0.15, then $0.13. Nearest Resistance Zone is $0.194, then $0.24.

KASUSD Starting the rally to $0.4000Kaspa (KASUSD) has been trading within a Parabolic Growth Channel ever since its very first day, always supported by the 1W MA50 (blue trend-line). The 1W RSI recently almost reached 45.00 and rebounded and this week the 1W MACD will most likely complete the new Bullish Cross.
As you can see on this chart, this is a bullish signal for KAS as it is a repetitive pattern within the Parabola. It should technically now enter the green curve rally phase which on the previous 3 occasions made a new High at the top of the Channel.
Our medium-term Target is $0.4000.
-------------------------------------------------------------------------------
** Please LIKE 👍, FOLLOW ✅, SHARE 🙌 and COMMENT ✍ if you enjoy this idea! Also share your ideas and charts in the comments section below! This is best way to keep it relevant, support us, keep the content here free and allow the idea to reach as many people as possible. **
-------------------------------------------------------------------------------
💸💸💸💸💸💸
👇 👇 👇 👇 👇 👇

Technical Analysis of KAS/USDT (4-Hour Chart) #kaspa $kas #usdtTechnical Analysis of KAS/USDT (4-Hour Chart) by Blaž Fabjan
The chart displays a falling wedge pattern, which is typically a bullish formation, indicating a high probability of an upward breakout.
Indicators:
VMC Cipher B Divergences: This indicator shows bullish divergences at multiple points, supporting the possibility of an upward breakout.
RSI (14): Currently at 39.82, indicating the market is somewhat oversold and we may expect price growth.
Stochastic Oscillator (14, 1, 3): Values are 34.88 and 36.88, indicating an oversold condition, often a buy signal.
Recommended Entry Points for Trading:
Intra-Day Trading:
Entry: $0.145 (at the current price or upon a slight dip)
Target Price: $0.155 (first resistance level)
Stop Loss: $0.140 (to protect against significant losses)
Swing Trading:
Entry: $0.145 (at the current price or upon a slight dip)
Target Price: $0.165 - $0.170 (potential breakout from the falling wedge)
Stop Loss: $0.135 (to protect against significant losses)
Recommended Exit Points for Trading:
Intra-Day Trading:
Exit Price: $0.155
Alternative Exit Price: $0.150 (if the market shows signs of weakness)
Swing Trading:
First Target Price: $0.165
Second Target Price: $0.170
Exit Price on Reversal: $0.135 (to protect against significant losses)
Summary:
Based on the technical analysis and applied indicators, the current trend for KAS/USDT is positive, with potential for an upward breakout from the falling wedge. Recommended entry points are at the current price of $0.145 with target prices of $0.155 for intra-day trading and $0.165 - $0.170 for swing trading. Closely monitor the market and use stop loss to protect against unexpected downturns.

KASPA Repeating it again?Kaspa coin is performing again the same pattern it played some weeks ago. If this pattern is goin to repeat again, we could see a pump that could lead the price around $0.24 (i have multiple confluence about this target) in the next months. In order to see the pump, the support level at $0.10/$0.09 must hold

KASPA Still bullish and still strong above the 1D MA200.Back in November (Nov 21 2023) we made a case of why Kaspa (KASUSD) could be imitating Bitcoin's and Ethereum's trend and came up with a logarithmic curve for its growth:
As you can see, in 5 months since then, it has respected this trend-line to perfection. Zooming in on the 1D time-frame, we can see that a shorter term Channel Up pattern is involved. Every time the price broke below the 1D MA50 (blue trend-line) and kept the 1D MA200 (orange trend-line) intact, while the 1D RSI started rising (Bullish Divergence), the market accumulated.
Once it closed a 1D candle back above the 1D MA50, it was a bullish break-out signal. As a result, we are waiting for this break-out to buy and target 0.22500 (+105% rise from the Higher Low).
-------------------------------------------------------------------------------
** Please LIKE 👍, FOLLOW ✅, SHARE 🙌 and COMMENT ✍ if you enjoy this idea! Also share your ideas and charts in the comments section below! This is best way to keep it relevant, support us, keep the content here free and allow the idea to reach as many people as possible. **
-------------------------------------------------------------------------------
💸💸💸💸💸💸
👇 👇 👇 👇 👇 👇

Crypto Surge: Navigating Kaspa's Momentum and Fibonacci Signals Keeping a close eye on Kaspa! The recent surge, a whopping 20% in just 7 hours, indicates some serious momentum. Still riding the ATH wave, and the Fibonacci analysis suggests that hitting the -.618 might be the key for the next leg up. The last 7 hours showing an 11.1% rise - exciting times! Additionally, the RSI is now moving above the MA, adding more bullish signals. Let's see if Kaspa continues to ride the upward trend. CryptoInsights KaspaJourney MarketAnalysis

Kaspa - Will the Bulls remain in control?KASPA is trading within a symmetrical triangle at 4H, after a sharp rise.
If it breaks above, the price should continue to go up in the short term, but be aware that it is extremely overbought on higher timeframes.

Kaspa Update | KASUSDT UpdateKUCOIN:KASUSDT CRYPTO:KASUSD
Hello, dear traders!
Ah, well, well...
Our price chart's been playing hard to get with that stubborn $0.1500 resistance, giving it a go three times, no less! But alas, here comes the downturn.
Buyers, feeling a bit let down by the lack of perpetual growth, are wrapping up their trades, and wouldn't you know it, the bears decide to join the party. We're looking at a drop, folks.
Now, down to the 0.500 Fibonacci Ratio, we're in for a price slide. After a little breather, expect the downtrend to strut its stuff all the way down to the $0.1000 level.
✅ Wishing you all the luck in the trading arena. May the charts be ever in your favor. ✅
⚠️ Disclaimer: The viewpoints shared represent my individual outlook on the market, based on publicly accessible information and historical data. While a portion of these opinions is influenced by my actual trades, others are not. It's important to note that I am not a financial advisor, and I do not assume any responsibility for the decisions you make in your trading activities.
✅ Feel free to share your inquiries or suggestions in the comments. I am more than willing to assess and analyze any cryptocurrency, forex currency pair, or stock index that piques your interest, so, Please don't hesitate to ask or mention the specific currency chart you'd like me to review.

KASPA middle term targetsMEXC:KASUSDT
Possible Targets and explanation idea
➡️Since summer 2022 KAS gain over 25000% without corrections
➡️Since listing on MEXC we are only in distribution zones on weekly
➡️Waiting potential small correction and pump to 0.5 extension fib level 0.06
➡️Forming divergency and TD pattern before massive correction after October/November
➡️In accumulation zone to everyone who wanna buy again will be time for accumulation
➡️At 0.06 people who bought at listing price will be in 12000% gains profit.
Hope you enjoyed the content I created, You can support with your likes and comments this idea so more people can watch!
✅Disclaimer: Please be aware of the risks involved in trading. This idea was made for educational purposes only not for financial Investment Purposes.
---
• Look at my ideas about interesting altcoins in the related section down below ↓
• For more ideas please hit "Like" and "Follow"!

KASUSD Pull-back soon, which will be a buy opportunity.Kaspa (KASUSD) has been on a 5-day bullish run as it first consolidated on the 1D MA50 (blue trend-line) and bottom (Higher Lows trend-line) of the 5-month Channel Up, solidifying it as the Support.
The 1D RSI is extremely overbought above 80.00 and soon that should transcend into a technical pull-back. The current rise resembles that of June, which extended to +105%, then pulled-back near the 0.5 Fibonacci retracement level and the 1D MA50 and started the final and most aggressive leg of +155% to the Channel's new Higher High.
As a result we will look to buy at the end of a potential 1 week pull-back and target 0.16000 (estimated +155%).
-------------------------------------------------------------------------------
** Please LIKE 👍, FOLLOW ✅, SHARE 🙌 and COMMENT ✍ if you enjoy this idea! Also share your ideas and charts in the comments section below! This is best way to keep it relevant, support us, keep the content here free and allow the idea to reach as many people as possible. **
-------------------------------------------------------------------------------
💸💸💸💸💸💸
👇 👇 👇 👇 👇 👇
