KAVAUSDT - Resistance Breakout!KAVAUSDT (4h Chart) Technical analysis
KAVAUSDT (4h Chart) Currently trading at $5.2
Buy level: Above $5.1
Stop loss: Below $4.22
Target 1: $5.5
Target 2: $6
Target 3: $6.6
Target 4: $7
Max Leverage 2x / Spot Market
Always keep Stop loss
Follow Our Tradingview Account for More Technical Analysis Updates, | Like, Share and Comment Your thoughts.
Kava

Dogecoin Daily TA : 01.12.22 : $DOGEDoge Coin's old important support has become an important resistance , and the price is currently trying to break this important X-Point resistance, the price closing above 17.5 cents will be very important for us.
Follow our other analysis & Feel free to ask any questions you have, we are here to help.
⚠️ This Analysis will be updated ...
👤 Arman Shaban : @ArmanShabanTrading
📅 12.Jan.22
⚠️(DYOR)
❤️ If you apperciate my work , Please like and comment , It Keeps me motivated to do better ❤️

BITCOIN Daily TA : 01.12.22 : $BTCAs you can see that the price has pulled itself above the dynamic resistance and is stabilizing. Today is an important day for market decision making and market risks in these areas will always increase. Resistance in the 43K range is currently holding back further price growth. We have to see if the price will be rejected from this level or not.
Important resistance : 43600$
Follow our other analysis & Feel free to ask any questions you have, we are here to help.
⚠️ This Analysis will be updated ...
👤 Arman Shaban : @ArmanShabanTrading
📅 12.Jan.22
⚠️(DYOR)
❤️ If you apperciate my work , Please like and comment , It Keeps me motivated to do better ❤️

KAVA broke out big triangle and a channelHi dear patrons, hope you are well and welcome to the new update on Kava. io (KAVA) token
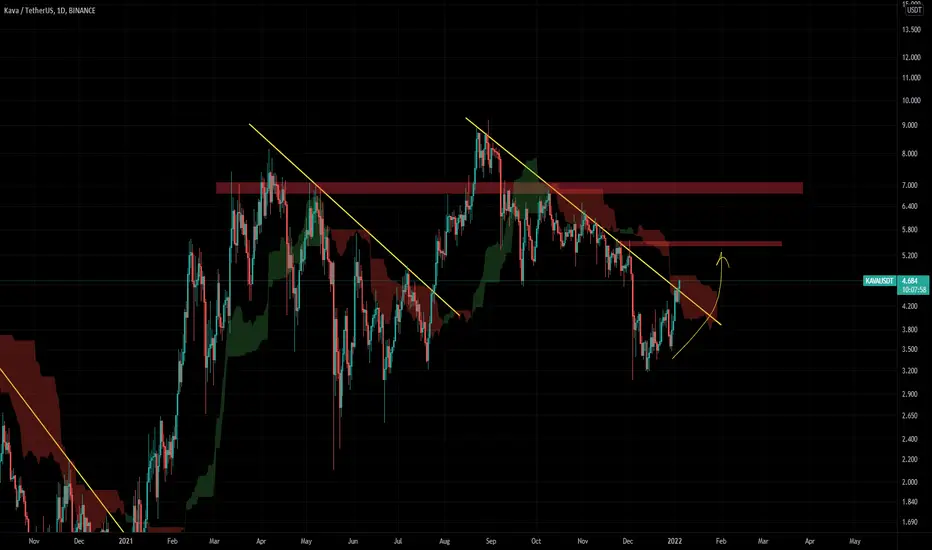
The channels and SMA resistance:
On a daily time frame, KAVA has formed a down channel and recently came out of the resistance of this channel and formed another up channel. There is a price level resistance at $4.55. Right now the price action is rejected by this resistance and there is also 100 SMA resistance as well.
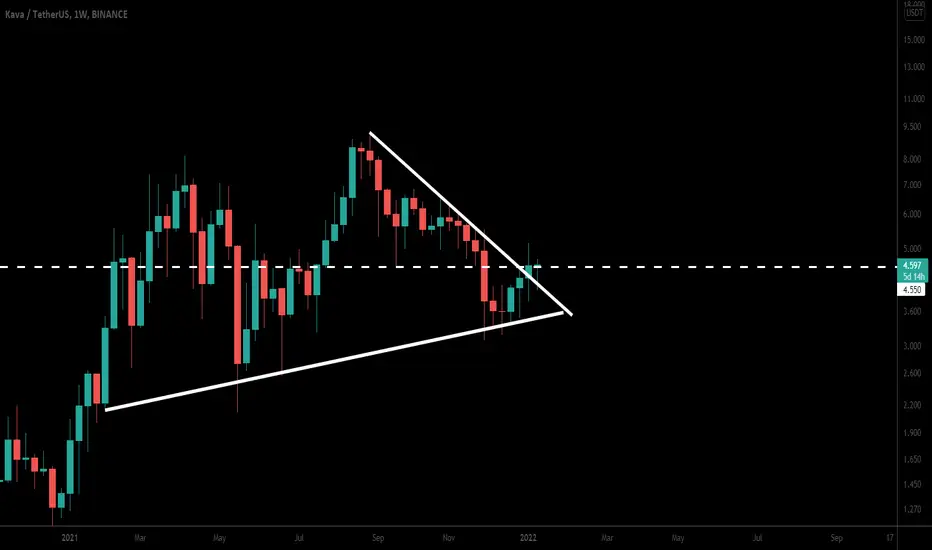
Big triangle and hidden divergence:
On a weekly time frame, KAVA has broken out a big symmetrical triangle and now re-testing the previous resistance as support. If we take a look at the stochastic then there is also a hidden bullish divergence, as the priceline is forming higher lows and the RSI is setting lower lows. Therefore, there is a very high probability for a big bullish move, and obviously, Kava 9 mainnet Upgrade event will be also supported for this move. By the way, this event is expected on 19 Jan 2022.
Note: Above idea is for educational purpose only. It is advised to diversify and strictly follow the stop loss, and don't get stuck with trade
Kava your momma some potential targets for Kava make sure to DYOR. entry and targets on the chart.
follow your proper risk management.
we got some bullish divergence on the weekly as well

Chiliz Weekly TA : 01.10.22 : $CHZZAll supports and resistances are marked on the chart. As we can see, the price is in an important range and recommended to keep an eye on it ...
Follow our other analysis & Feel free to ask any questions you have, we are here to help.
⚠️ This Analysis will be updated ...
👤 Arman Shaban : @ArmanShabanTrading
📅 10.Jan.22
⚠️(DYOR)
❤️ If you apperciate my work , Please like and comment , It Keeps me motivated to do better ❤️

BITCOIN 12H TA : 01.09.22 : $BTCAs you can see in the Daily and 12-H bitcoin charts , we see that the price has lost its important dynamic support in the daily timeframe and is stabilizing below it , an important range that is currently preventing further price falls is the Key Static Range of $ 40,500 to $ 42,000, if the price loses this important support the next support is $ 37,400 to $ 39,000 range . (Note that we currently have no positive and bullish view of the chart unless proven otherwise.) Significant resistance levels are shown on the 12-hour chart, as are subsequent bearish targets.
Follow our other analysis & Feel free to ask any questions you have, we are here to help.
⚠️ This Analysis will be updated ...
👤 Arman Shaban : @ArmanShabanTrading
📅 09.Jan.22
⚠️(DYOR)
❤️ If you apperciate my work , Please like and comment , It Keeps me motivated to do better ❤️

Fantom Daily TA : 01.07.22 : $FTMAs you can see, the price has pullback to the broken level of of its resistance, and if it stabilizes, we can expect further price growth up to the previous ATH.
All supports and resistances are marked on the chart. As we can see, the price is in an important range and recommended to keep an eye on it ...
Follow our other analysis & Feel free to ask any questions you have, we are here to help.
⚠️ This Analysis will be updated ...
👤 Arman Shaban : @ArmanShabanTrading
📅 07.Jan.22
⚠️(DYOR)
❤️ If you apperciate my work , Please like and comment , It Keeps me motivated to do better ❤️

KAVAUSDT - SHORTBased on technical factors there is a short position in KAVAUSDT Kava
KAVAUSDT Kava
Score 2️⃣
🔴Short Now or set on Key Level 4.330
🟢Target 1 4.030
🟢Target 2 3.730
❌Stop loss 4.450
#K_Level
Every signal has a score from 1 to 5, so accordingly adjust your risk for each signal. The signals with the score of 5 are the most probable ones.
Please support our activity with your likes and comments.

Bitcoin Short 6H TA : 01.06.22 : $BTCAs we expected, the price break the trading range from the bottom and also lost its important dynamic support. Currently, the first very important support and bearish target is the (Swing Low) price, which is in the range of $ 42,000. Up to $ 42300, if this critical level is broken the next downside targets will be $ 40 ,000, $ 38,600 and $ 37,700 and if all 3 of these support will be lost , the Potential Reversal Zone (PRZ) could be the of 35,500 $ range ... (This analysis will be updated)
Follow our other analysis & Feel free to ask any questions you have, we are here to help.
⚠️ This Analysis will be updated ...
👤 Arman Shaban : @ArmanShabanTrading
📅 06.Jan.22
⚠️(DYOR)
❤️ If you apperciate my work , Please like and comment , It Keeps me motivated to do better ❤️

KAVA/USDT 1D TRADE SETUPWelcome to this quick Update, everyone.
If you are reading my updates for the first time do follow me to get more complex charts in a very simplified way.
I also post altcoin setups on Spot, Margin, and Futures.
I have tried my best to bring the best possible outcome in this chart.
KAVA/USDT broke out of descending channel now, coming back to retest the channel.o
Entry: $4.67to $4.40 but don't yous high leverage max up to5x only.
Targets: 60% to 90%
Stop Loss: $ 4
What's your thought on this?
Do hit the like button if you like this update and share your views in the comment section.
Thank you
#PEACE

GTCUSDT Daily TA : 01.04.22 : $GTC🟡 Results so far (HH) : +17% 🔥(Watchlist 3 Result)
All supports and resistances are marked on the chart. As we can see, the price is in an important range and recommended to keep an eye on it ...
Follow our other analysis & Feel free to ask any questions you have, we are here to help.
⚠️ This Analysis will be updated ...
👤 Arman Shaban : @ArmanShabanTrading
📅 04.Jan.22
⚠️(DYOR)
❤️ If you apperciate my work , Please like and comment , It Keeps me motivated to do better ❤️

ATOMUSDT (Cosmos) : Time to take profitWell, according to the previous analysis, as you can see, the price hit the all its targets so far and it has brought us more than 90% Profit . Amazing , Isn't it ??
☑️ TP1 Reached 🔥
☑️ TP2 Reached 🔥🔥
☑️ TP3 Reached 🔥🔥🔥
☑️ TP4 Reached 🔥🔥🔥🔥
✅ All Targets Reached ✅
✅ Results so far : +90% 😍
⚠️ Time To Take Profit for everyone . Cheers 🥂
Follow our other analysis & Feel free to ask any questions you have, we are here to help.
⚠️ This Analysis will be updated ...
👤 Arman Shaban : @ArmanShabanTrading
📅 04.Jan.22
⚠️(DYOR)
❤️ If you apperciate my work , Please like and comment , It Keeps me motivated to do better ❤️

KAVA long setup ( short term )Kava breakout, just use a decent stoploss and enjoy the ride. dont try to hodl till dear life. sell and take profits
wagmi
KAVA | Breaking out of Descending Channel..!!
#KAVA (Update)
Pay Attention to KAVA..
In Daily timeframe Chart, Breaking out of Descending Channel After Long consolidation..
Volume has been Increasing..
Expecting +80% Bullish Wave so don't miss the Ride..
Please like the idea for Support & Subscribe for More ideas like this and share your ideas and charts in Comments Section..!!
Thanks for Your Love & Support..!!


KAVA Token Is Going To Set A New All Time HighHi dear friends, hope you are well, and welcome to the new update on Kava. io (KAVA) token.
Big Broadening wedge:
On a weekly time frame, the priceline of KAVA is bounced from the support of a huge broadening wedge pattern. Stochastic has turned bullish from the oversold zone. There is also a hidden bullish divergence as the priceline is forming higher lows and stochastic is setting higher lows.
Daily channel:
On a daily time frame, KAVA has reached the resistance of a down channel, and in case of breakout, it can start a big move at least to the resistance of the big broadening wedge that is formed on the weekly chart to set a new all-time high.
Note: Above idea is for educational purpose only. It is advised to diversify and strictly follow the stop loss, and don't get stuck with trade

ALICEUSDT Daily TA : 01.01.22 : $ALICEAll supports and resistances are marked on the chart. As we can see, the price is in an important range and recommended to keep an eye on it ...
Follow our other analysis & Feel free to ask any questions you have, we are here to help.
⚠️ This Analysis will be updated ...
👤 Arman Shaban : @ArmanShabanTrading
📅 01.01 .2022
⚠️(DYOR)
❤️ If you apperciate my work , Please like and comment , It Keeps me motivated to do better ❤️

KAVAUSDT Daily TA : 01.01.22 : $KAVAAll supports and resistances are marked on the chart. As we can see, the price is in an important range and recommended to keep an eye on it ...
Follow our other analysis & Feel free to ask any questions you have, we are here to help.
⚠️ This Analysis will be updated ...
👤 Arman Shaban : @ArmanShabanTrading
📅 01 . 01 .2022
⚠️(DYOR)
❤️ If you apperciate my work , Please like and comment , It Keeps me motivated to do better ❤️

🆓Kava (KAVA) Jan-1 #KAVA $KAVA
.
📈RED PLAN
♻️Condition : If 1-Day closes ABOVE 3.5$ zone
🔴Buy : 3.8 - 3.5
🔴Sell : 5 - 6 - 7
📈BLUE PLAN
♻️Condition : If 1-Day closes BELOW 3.5$ zone
🔵Sell : 3.5
🔵Buy : 3.2 - 2.8
❓Details
🚫Stoploss for Long : 10%
🚫Stoploss for Short : 5%
📈Red Arrow : Main Direction as RED PLAN
📉Blue Arrow : Back-Up Direction as BLUE PLAN
🟩Green zone : Support zone as BUY section
🟥Red zone : Resistance zone as SELL section

KAVA/USDT Buy step by step in support. Or if the market does not fall, buy after the resistance breaks.
Like and comment please❤

longI think in the range are the best places to returneth and breaking the range and continue the process is very important. This analysis is only for your better perspective

Kava.io (KAVA) formed bullish Gartley for upto 216% massive moveHi dear friends, hope you are well and welcome to the new trade setup of Kava. io (KAVA) token
Previously we had a nice trade of KAVA:
Now on a weekly time frame chart, KAVA has formed bullish Garltey move. There is also 100 simple moving average support in buying zone.
