KAVA.USDT/BTC (Y20.P3.E5).Waiting to enterHi All,
Next coin on the list to review and plan for as it has given good results so far as part of the DeFi boom.
OBSERVATIONS:
============================
> On the daily, we can observe the following:
a) Large bearish divergence at play
b) A number of large bearish candles
c) Fib. levels corresponding to the impulse wave have not hit the 3 main levels yet
d) The 21/34 EMA on the daily on this uptrend has played support
e) Previous resistance equates to likely support at the 0.382 fib or more likely the 0.5 for the daily trend to be higher highs and lower highs.
f) Note the 2 indicators, both show the crossing of their signals\rsi's with bearish divergence reflecting on price action.
e) On the 4 hrly or daily, we can envision a correction wave to the area of interest.
MY THOUGHTS:
============================
I'm not expecting a deep bearish pullback, but one that hits the 21/34 EMA ribbon on the daily.
Hence I will be looking for the 21/34 EMA on the daily as support along one of these fib levels and looking for a bullish candle at the lower time frames, say 8 hrly.
This might equate to entering at the 0.382 or 0.5 fib level on the daily chart.
Which equates to the 200 EMA on the 4 hrly chart, as the chart below (the blue shaded band).
I will also be watching the cross over of the WT wave on the 4 hrly, near the bottom of the chart and\or along with a 8 or 12 bullish candle at the specific levels mentioned.
With the Phoeix, I will be looking for the cross over of the green rsi over the red and above 50% level on the 12 or daily chart.
As for the BTC pairing, The price action of KAVA on USD\T should be aligned with the pairing as the chart below. Maybe the EMA ribbon will be in the same proximity as the blue box range.
Either one will be satisfactory.
4 HRLY CHART
DAILY CHART
DAILY BTC pairing CHART:
The price action of KAVA on USD\T should be aligned with the pairing as the chart below.
Kava


KAVABTC - Bearish patternKAVA is showing us a bearish pattern. Supports are drawn, which equals the flag pole in length.

KAVA.BTC (Y20.P3.E4).Cup and HandleHi All,
*** This is a component of the previous KAVA.BTC post > Link below ***
Hence supporting my thesis that this coin is in its early phases of doing a Parabolic run.
The chart tells its all.
Note, it did well with the btc dominance bounce and likely to keep doing so.
How to trade this?
2 options to consider:
a) You can wait for the 6 hrly candle to close before jumping in
b) Look for the retest of the support line
Its possible both will be covered in the 6 or 8 hrly window.
Please give me a tick or like for this post.
Enjoy!
Regards,
S.Sari
PREVIOUS POST

KAVA on track with weekend prediction. KAVA is keeping pace and the MA flip flop is proving to be a relevant indicator. We could see another 50% gain in price in time for the next crypto-payday promotion. It's hard to believe, heck, I barely believe it but, numbers backed by historical performance tend to come in close in the future. Icing on the cake would be a Coinbase add. May still be possible because DEX, out performed exchanges by 5x last month. So Coinbase may have to shift its business model or risk becoming irrelevant. If that or a full Binance integration announcement was to happen, we could see a $10 KAVA supported due to the higher demand for USDX loans. Amazing Tech.

KAVA.BTC (Y20.P3.E3).Gems in the making.No.3Hi All,
This post is part of a series of posts that I have started with parabolic curve signs and hence the title association Gems in the making.No.x
<<< Note: This title is associated with all parabolic curve charts or likely to be as per yesterdays post on LEND.BTC >>>
KAVA is part of the DeFi group and looking at the overall view so far, chart below, we can see how its progressed.
If you refer to my previous post on LEND.BTC, I touch on the points of Base1, Base2, Base3 and Base 4 to then extend beyond the Arc to complete the cycle.
LINK.BTC is doing this right now. Refer to link supplied below for further background information.
OBSERVATIONS:
========================
> It is early stages but what I have quickly learnt about parabolic curves is that they move away from the channel path aggressively, just like Kava btc pairing now;
> Current price action is below another FIB. extension target and is consolidating into what seems a ascending triangle;
> The daily Phoeix supports the thesis that it will go sideways for now with slight downward pressure; Green RSI crossing over Red RSI with gray pressure moving upwards, meaning sideways action.
> The Phoeix outlook on the 3 day and onwards is all upwards pressure;
> Daily chart, the 21, 34 and 50 EMA from the price action, demonstrating aggressive movements;
> Daily Macd looking for a bounce off the signal line;
THOUGHTS:
> If the current price breaks this level in the coming week, it will give us the arc we are looking for, hence confirming the parabolic curve;
> How to trade this > go long and go to the smaller time frames be it 4 or 8 hourly chart and enter as the chart below.
Otherwise wait for the breakout and retest of this resistance line (place order there), but you risk missing out.
Please dont forget give me a like or tick for this post as I would like to see my charts not only succeed but also get more exposure out there.
Regards
S.Sari
Macro overview:
Daily chart:
Note the 21, 34 and 50 EMA from the price action, demonstrating aggressive movements
Entry level, if you haven't bought yet

Parabolic moves coming?We are in a ascending channel on kavabtc/mkrbtc ratio. if kava keeps on the pace it is right now, kava will grow in price around 80% against Makerdao in a matter of days.
Its taking less and less time for kava to make moves up. This means at least 7$ kava in a week or less.
Parabolic moves coming for kava even before coinbase listing?

KAVA 80 MA and 50 MA flip-flop signaling a possible bull runThe last time this happened was on Aug 3rd, KAVA over the next 7 days rn up by 140%, with that same level of enthusiasm, Kava could find itself at $7.50 by Wednesday this coming week; possibly temporarily hitting as much as $10. But what does your crypto analyst know? Only time can tell, ball are on the table, this is quite the claim, let's see how this plays out. Beyond the technicals, the sentiment is growing. Swipe and Kava publicly announced the ability to use USDX as a means of making payments anywhere VISA is accepted. That opens up 60 million locations globally to make use of their USDX loans. Still bullish for now.


KAVAUSDT Analysis for next days in Augkava is forming strong uptrend from May2020 and it'll continue bullish trend in next month

So light at the end of the tunnelI'm trying to look past the shifting of funds and remember the end game. Kava will likely be at the top of its next breakout Wednesday next week. two reasons, Fiat payday, and Crypto-Payday. Hopefully some technical news on their progress or partnerships are shared. If a Coinbase listing happens we could see well beyond these projections. Let's hope the dev and marketing team is being tactical and efficient to bring this much needed service to the crypto community and the unbanked.

KAVA may just be getting warmed uplogarithmic analysis is always better when dealing with parabolic moves. Looking at Kava on the charts, its looks like it healthy just being valued for its utility. Looking forward to higher highs. Kava is still in its first few steps of a very long and bright future.

KAVA 4hr Chart Breakout - KAVABTC KAVAUSD KAVAUSDT KAVA ALT COINKAVA 4hr Chart Breakout - KAVABTC KAVAUSD KAVAUSDT KAVA ALT COIN

KAVAUSDT AnalysisIf you bought from BUY 2 signal, enjoy your 9.29% PROFIT that you made in 1 day!
Since there are buy 2 signal & green cloud, do not hurry to sell.
Also, there is a candle open-closed (1D chart) above the horizontal line (2.92).
You can wait for EngineeringRobo's sell signal or wait for candles to open-close below the horizontal line (2.92).

KAVA/USDT is Breaking out!Hey, I am back with another idea, this time looking at Altcoin, KAVA.
Fun fact, in my country KAVA means coffee so this maybe my another favourite alt coin haha..
About the chart, the price is breaking resistance area and is currently breaking out from the Bull flag, which is a bullish pattern.
Get in quickly, this looks good!
Good luck with the trade, don't forget to follow in order not to miss out on another trade signals.

KAVA.USDT (Y20.P3.E2.v2). Waiting is overA continuation from the previous post, link below;
While BTC goes sideways, expect some ALTS to make their move, anther ALT pumb.
No time for words as this will likely move quick.
Observations:
KAVA has a nice macro uptrend
> It broke the channel
> Its facing a key resistance
> Off the fib level of 0.382
> 21 EMA on the Daily
> Daily RSI holding as well as the WT having confluence
Please give me a tick or like for this post.
Regards,
S.Sari
Previous post


KAVA.USDT (Y20.P3.E2).Waiting on support levelHi All,
(ref > A.Charts)
Kava (Defi) gave a good run and its wise to look for it again.
I have 2 possible entrance points but for now, its heading down with clear downward pressure (based on a number of indicators) including the daily candle sticks.
Anyway, we have the option at 0.618 fib retracement equaling the bottom of the channel or much lower where we the previous strong resistance to be now our support (0.786 fib level).
Similarly for KAVA.BTC pairing.
Lets keep an eye on this.
Please give me a like or tick for this post.
Regards,
S.Sari
My PREVIOUS POST FOR KAVA

KAVA Analysis Q3 2020 -Q3 2021 Public$KAVA is looking solid right now - crossing blue resistance line will turn it to Major Bullish Sentiment as it was previous the strongest Support line. It completed a IH&S cycle for about 135days and if it continues to replicate the same pattern for the coming 135days minimum we can lead to $10 target. we have to see how it plays out for the coming weeks as it might either have another leg up or if BTC decides to dump in the coming weeks towards August 2020 it will affect current TA as well. Accumulating Entry Point would be from Max $2. Ideally would be $1 or less.

Kava is moving back to upward Trend in the chart we see the clear selling pressure and its void. i think if the US Dollar index keep moving downside we will see price coming back to the resistance area soon

KAVAUSDT ANALYSİSIf you are holding Kava wait until the Engineeringrobo ' s sell signals or you can take your profit right now.Congratulations to you.
If you want to buy it you can buy it at the support (about $1.90) level.
To buying kava at this moment is very risky.


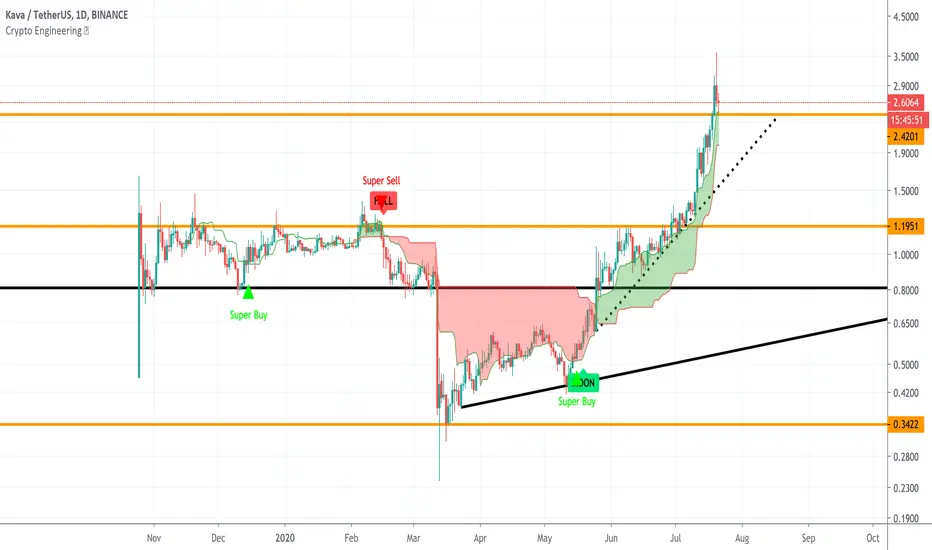
KAVAUSDT analysisThis is a definite buy. With Super buy, moon and green signal, I will wait until 2 of those signals turn red. It has broken an all time high. I also watching for any sell signals from Robo 1 and Robo2 as helper indicators.