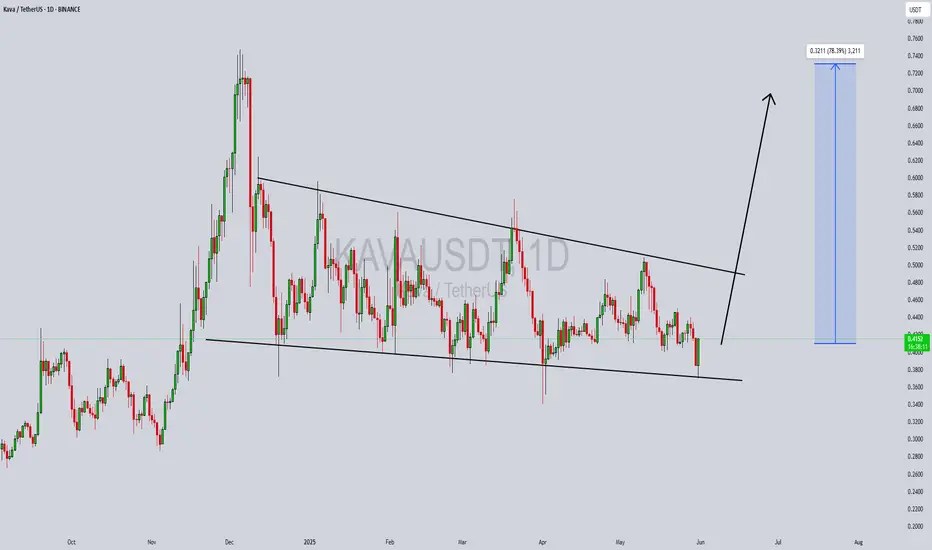
KAVAUSDT Forming a Bullish WaveKAVAUSDT is currently presenting a strong bullish wave pattern formation on the daily timeframe, hinting at a potential continuation of the upward trend. After a period of consolidation, KAVA has started to push higher with increasing bullish momentum. This movement is accompanied by solid volume, suggesting that the current wave could be the beginning of a larger impulse leg. The structure is favorable for swing traders and position traders looking to capture mid-term gains in the range of 60% to 70% or more.
From a technical perspective, the price has respected key support zones and is now forming higher highs and higher lows—a classic sign of a bullish trend in development. The overall market sentiment around KAVA is improving, and this is reflected in its rising trading volumes and increased mentions across crypto discussion platforms. If the bullish wave continues to unfold as expected, KAVA could challenge previous resistance levels and break into a new bullish phase.
KAVA also benefits from growing investor interest due to its strong fundamentals in the DeFi ecosystem. As a cross-chain DeFi platform, KAVA provides lending and stablecoin services, making it an attractive asset in a maturing crypto market. Technical indicators such as RSI and MACD are showing bullish signals, further supporting the case for a significant upside move. With volume surging and structure aligning, KAVA appears well-positioned to deliver a strong breakout rally.
Keep an eye on price levels around recent breakout zones as potential entry points. A successful retest could provide a good risk-reward setup for traders aiming to ride the bullish wave. Continued buying pressure and sustained volume would be key signs of strength in the coming days.
✅ Show your support by hitting the like button and
✅ Leaving a comment below! (What is You opinion about this Coin)
Your feedback and engagement keep me inspired to share more insightful market analysis with you!
Kavalong
KAVA USDT LONGKAVA is breaking out From massive Falling Wedge in Weekly Time Frame,
Everything is supportive here from Fundamentals to Price action with RSI

#KAVA/USDT#KAVA
The price is moving in a descending channel on the 1-hour frame and is expected to continue upwards
We have a trend to stabilize above the moving average 100 again
We have a descending trend on the RSI indicator that supports the rise by breaking it upwards
We have a support area at the lower limit of the channel at a price of 0.5360
Entry price 0.5460
First target 0.5636
Second target 0.5832
Third target 0.6067

KAVAUSDT: Short-Term Bounce or Long-Term Opportunity?KAVAUSDT: Short-Term Bounce or Long-Term Opportunity? 🚀
Traders, let’s talk about KAVAUSDT, a coin making waves in the market right now! With a whopping %477 daily volume spike and significant CDV data pointing to heavy buyer activity, this is one setup you don’t want to ignore.
Here’s the breakdown:
Short-Term Blue Box: Found using precise CDV data, this zone is perfect for a quick bounce trade. Timing and precision will be key!
Long-Term Blue Box: This level acts as a safety net during a potential market crash. But let me be clear: I’m not waiting for it. With current data showing strong accumulation, the first zone looks very promising.
Why this matters: CDV analysis reveals a surge in buy activity, signaling that smart money is stepping in. Combine that with the volume explosion, and we’ve got a high-conviction play here.
Risk Management Tip: Be cautious but confident. Set clear stops, and don’t let greed cloud your judgment.
Your next move? Analyze the zones, plan your entries, and let the data guide you. What’s your take on KAVA? Boost, comment, and follow to stay ahead in the market!
Let me tell you, folks, this is amazing. Nobody does analysis like I do. Believe me. If this helps you, don't forget to boost and comment! It’s a big deal, motivates me to share even more winning insights with you. Tremendous insights.
Let me tell you, this is something special. These insights, these setups—they’re not just good; they’re game-changers. I've spent years refining my approach, and the results speak for themselves. People are always asking, "How do you spot these opportunities?" It’s simple: experience, clarity, and a focus on high-probability moves.
Want to know how I use heatmaps, cumulative volume delta, and volume footprint techniques to find demand zones with precision? I’m happy to share—just send me a message. No cost, no catch. I believe in helping people make smarter decisions.
Here’s the list, long list, great list, of some of my previous incredible analyses. Each one, a winner:
🎯 ZENUSDT.P: Patience & Profitability | %230 Reaction from the Sniper Entry
🐶 DOGEUSDT.P: Next Move
🎨 RENDERUSDT.P: Opportunity of the Month
💎 ETHUSDT.P: Where to Retrace
🟢 BNBUSDT.P: Potential Surge
📊 BTC Dominance: Reaction Zone
🌊 WAVESUSDT.P: Demand Zone Potential
🟣 UNIUSDT.P: Long-Term Trade
🔵 XRPUSDT.P: Entry Zones
🔗 LINKUSDT.P: Follow The River
📈 BTCUSDT.P: Two Key Demand Zones
🟩 POLUSDT: Bullish Momentum
🌟 PENDLEUSDT.P: Where Opportunity Meets Precision
🔥 BTCUSDT.P: Liquidation of Highly Leveraged Longs
🌊 SOLUSDT.P: SOL's Dip - Your Opportunity
🐸 1000PEPEUSDT.P: Prime Bounce Zone Unlocked
🚀 ETHUSDT.P: Set to Explode - Don't Miss This Game Changer
🤖 IQUSDT: Smart Plan
⚡️ PONDUSDT: A Trade Not Taken Is Better Than a Losing One
💼 STMXUSDT: 2 Buying Areas
🐢 TURBOUSDT: Buy Zones and Buyer Presence
🌍 ICPUSDT.P: Massive Upside Potential | Check the Trade Update For Seeing Results
🟠 IDEXUSDT: Spot Buy Area | %26 Profit if You Trade with MSB
📌 USUALUSDT: Buyers Are Active + %70 Profit in Total
🌟 FORTHUSDT: Sniper Entry +%26 Reaction
🐳 QKCUSDT: Sniper Entry +%57 Reaction
📊 BTC.D: Retest of Key Area Highly Likely
This list? It’s just a small piece of what I’ve been working on. There’s so much more. Go check my profile, see the results for yourself. My goal is simple: provide value and help you win. If you’ve got questions, I’ve got answers. Let’s get to work!

Riding the KAVA wave: From EMA retrace tot Fib heightsI'm gonna ride this one all the way to the top! With a beautiful retrace to the 50 EMA and my take profit target at the 1.414 Fibonacci level of $12.93 , KAVA is showing strong potential.
As a DeFi powerhouse, it offers seamless interoperability and secure lending, supporting major cryptocurrencies like BTC and XRP. Built on the Cosmos SDK, KAVA’s unique co-chain architecture bridges Ethereum and Cosmos ecosystems, delivering scalability and flexibility. Competing with DeFi giants like Aave, Compound, and MakerDAO, KAVA’s focus on speed and cross-chain functionality sets it apart in the evolving landscape. 🚀

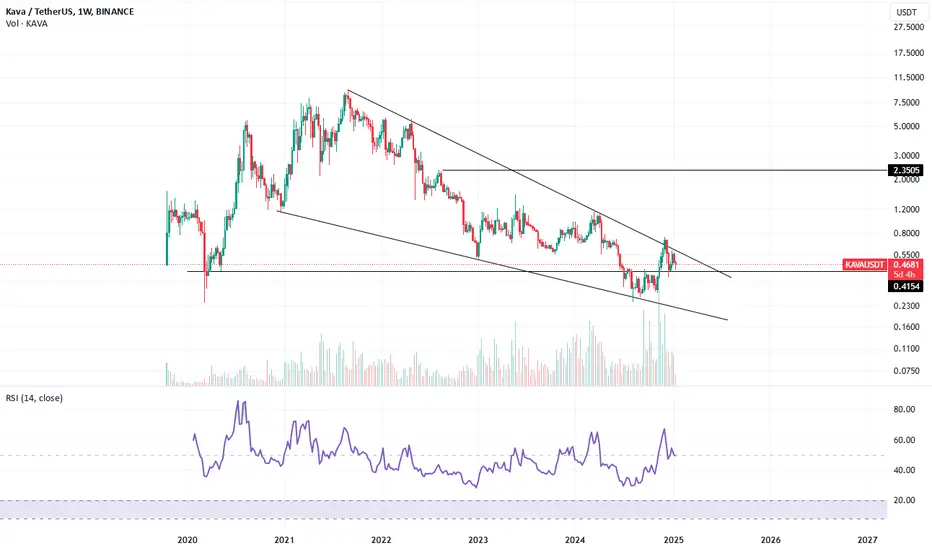
KAVAUSDT Falling WedgeKAVAUSDT technical analysis update
KAVAUSDT has formed a falling wedge pattern and has been trading within this pattern for 1,450 days. The price has now touched both the falling wedge support and the March 2020 bottom support, which is considered a strong support level for KAVA. We can expect a significant bounce from the current level.
Regards
Hexa

KAVAUSDTKAVA ~ 1W ✅
#KAVA This is the final support for this Coin. if you have Conviction on this coin,. This should be a very good price for you to make a purchase. at least for 20%++

Kava long road to 6$BINANCE:KAVAUSDT
Kava personally for me underrated now. 100% coins in circulation supply only 1b
Possible Targets and explanation idea
➡️Weekly tf, trade around 27 accumulation block
➡️Jan 2023 got main signal to buy on W based on Trade on indicator
➡️Trade around buy line on take profit indicator
➡️Road to 6B market cap and sweep EqHigh Jan-Apr 2022
➡️Money inflow on Weekly tf on money power indicator and MACD div like confirmation
➡️ Main targets for bull run I think way higher 6b market cap
Hope you enjoyed the content I created, You can support with your likes and comments this idea so more people can watch!
✅Disclaimer: Please be aware of the risks involved in trading. This idea was made for educational purposes only not for financial Investment Purposes.
---
• Look at my ideas about interesting altcoins in the related section down below ↓
• For more ideas please hit "Like" and "Follow"!

KAVAUSDT Triangle Pattern!KAVAUSDT Technical analysis update
KAVA has formed a triangle pattern on the 4-hour chart. It is currently bouncing from the triangle support, indicating that we can expect a significant move from the current support level.
Regards
Hexa

#KAVA/USDT#KAVA
The price is moving in a 1-hour bearish channel and sticking to it well
The price rebounded well from the lower border of its neck at the green support level of 0.660
We have a tendency to stabilize above the Moving Average 100
We have oversold RSI to support the upside
Entry price is 0670
The first target is 0.7180
The second target is 0.7435
The third goal is 0.7723

#KAVA/USDT LONG#KAVA
The downtrend of the reversal flag has been broken
At the same time, the EMA 100 was breached higher
We have a large reversal pattern and the price looks set to break it
The price is expected to trade in an upward wave with price corrections
Current price 0.945
The first goal is 1.180
The second goal is 1.411

Is KAVA a sleeping giant in the market?Hello everyone!
You can call it whatever you want, but #KAVA is a real hidden GEM in the market!
The chart clearly defines a 5-wave growth structure in the past bull market and a long, drawn-out correction in the following bear market.
Currently, the asset has approached an important Fibonacci level, many other assets have already surpassed it, but not KAVA.
On a global scale, we have huge potential for growth, I dare not aim to surpass the previous ATH, but I think reaching $3 is quite possible, and if we reach a bit higher with much higher risk, $5 mark and phenomenal +390% on the spot market.
For myself, I see an entry after overcoming the 0.236 Fibonacci level and consolidating above it. Next, all targets are important Fibonacci levels.
This is not financial advice, everything you do, you do at your own risk!
Follow me for even more trading ideas!

#KAVA/USDT#KAVA
The price has been trading in a large descending triangle since last May
The downtrend was recently broken and the price began to rise successively
The price is expected to reach the first target of 0.919
Then it bounces back to correct
Before completing its rise to the second target at the level of 1.10, which represents 170% of the current price
This is supported by bullish momentum and oversold on the MACD
and as usual follow your trading plan and manage your risk.
If you like this kind of analysis don't forget to like and follow

KAVAUSDT 5DKAVA ~ 5D 📈
#KAVA Make purchases gradually from here, with a minimum target of 20%++. This Resistance Line will soon be broken. 🚀

#KAVA/USDT#KAVA
We have a down channel that just broke out perfectly
We have a strong rising trend on RSI as well
We have stability above the Moving Average 100 and we have an upward momentum supported by the rise of Bitcoin
The pattern is canceled if the day is closed with a strong bearish candle below the green support area at 0.684.
Entry price is 0.779
The first goal is 0.810
The second goal is 0.888
Third goal 0.967

KAVA 1D BULLISH WAVEKAVA in 1D timeframe has already broken descending triangle at 0.88 zone and gaining momentum, 1.3 would be the first target for short term and for long term 2x can be expected.

KAVAUSDT 1W LONG📈Hi all. Timeframe 1 week. KAVAUSDT has been in accumulation for more than a year with growing volumes. I am considering recruiting to the spot with a possible decrease to the ~0.555 zone. Also go long during a breakdown/retest of the accumulation channel. Marked goals and levels on the chart.

KAVA/USDT Bracing for Potential Bullish Shift👀🚀KAVA Analysis💎 Paradisers, turn your attention to #KAVAUSDT. It's showing the beginnings of what could be a bullish shift, rising from its current lower demand zone.
💎 In the face of recent market volatility and price consolidations, #kava has experienced a downtrend, currently hovering around the key demand level of $0.707. Although there's a noticeable wane in momentum, we've observed its adherence to a descending channel, respecting the channel's resistance on two occasions.
💎 This sets the stage for a likely initial drop to a lower demand level at $0.615, followed by a bullish reversal. Should #KAVA maintain its strength at this lower demand level, we might see an ascent aiming for the significant supply zone at $0.975.
💎 Given the fluid nature of the crypto market, readiness to adapt our trading strategies is crucial. If #KAVA struggles to stabilize at this pivotal point, we should be prepared for further downward movements.

KAVA to 1.26 or even 2.8?0.73 was a crucial zone, Kava was able to close to candle above it which is huge sign to go up. Last week's candle was bit worrying but couldn't close the candle below the crucial zone. And this week's candle looks promising. I will be taking profits at those green lines.

#KAVAIt is moving in a short-term downward channel after the recent drop in the one-hour timeframe. If he is able to break this channel, he can try again to the previously built supply area after the pullback.

KAVA target 1.54h time frame
-
KAVA is creating a potential long-term double bottom structure. Currently making a cup and handles pattern in lower time frame, this CH provide us a reasonable setting for SL. Also, if KAVA maintain the pumping momentum, there are three targets as below. Risk to reward is great, even only reach the first target.
-
TP: 1~1.05 / 1.17 / 1.5
SL: 0.725

KAVA Road Map🗺️!!!Hi everyone👋( Reading time less than 2 minutes⏰ ).
If you want to invest in Kava(KAVA) , I suggest you read this post.
🌐 What Is Kava (KAVA) ❗️❓
Kava is a Layer-1 blockchain that combines the speed and interoperability of Cosmos with the developer power of Ethereum.
Kava was built from the ground up to optimize its resources for protocol growth, strengthened by its Cosmos EVM technology that enables maximum scalability, speed, security, and developer support.
Builders on Kava earn a share of Kava Rise's $750M developer incentive fund via the program's blockchain-based distribution method, designed to reward the top protocols every month based on usage.
-----------------------------------------------------------------------------------
Kava started to fall after completing the Diagonal pattern and breaking the lower line of this pattern.
The structure of Kava fall waves is in the form of five impulse waves .
Kava now seems to have completed the main wave 4 on the downtrend line .
🔔I expect the main wave 5 to end in the 🟡 Price Reversal Zone($0.525-$0.359) 🟡 and it will be a suitable area for mid-term investment.
Kava Analyze ( KAVAUSDT ), Weekly time frame ⏰.
Do not forget to put Stop loss for your positions (For every position you want to open).
Please follow your strategy, this is just my Idea, and I will be glad to see your ideas in this post.
Please do not forget the ✅' like '✅ button 🙏😊 & Share it with your friends; thanks, and Trade safe.
