KAVAUSDT: Short-Term Bounce or Long-Term Opportunity?KAVAUSDT: Short-Term Bounce or Long-Term Opportunity? 🚀
Traders, let’s talk about KAVAUSDT, a coin making waves in the market right now! With a whopping %477 daily volume spike and significant CDV data pointing to heavy buyer activity, this is one setup you don’t want to ignore.
Here’s the breakdown:
Short-Term Blue Box: Found using precise CDV data, this zone is perfect for a quick bounce trade. Timing and precision will be key!
Long-Term Blue Box: This level acts as a safety net during a potential market crash. But let me be clear: I’m not waiting for it. With current data showing strong accumulation, the first zone looks very promising.
Why this matters: CDV analysis reveals a surge in buy activity, signaling that smart money is stepping in. Combine that with the volume explosion, and we’ve got a high-conviction play here.
Risk Management Tip: Be cautious but confident. Set clear stops, and don’t let greed cloud your judgment.
Your next move? Analyze the zones, plan your entries, and let the data guide you. What’s your take on KAVA? Boost, comment, and follow to stay ahead in the market!
Let me tell you, folks, this is amazing. Nobody does analysis like I do. Believe me. If this helps you, don't forget to boost and comment! It’s a big deal, motivates me to share even more winning insights with you. Tremendous insights.
Let me tell you, this is something special. These insights, these setups—they’re not just good; they’re game-changers. I've spent years refining my approach, and the results speak for themselves. People are always asking, "How do you spot these opportunities?" It’s simple: experience, clarity, and a focus on high-probability moves.
Want to know how I use heatmaps, cumulative volume delta, and volume footprint techniques to find demand zones with precision? I’m happy to share—just send me a message. No cost, no catch. I believe in helping people make smarter decisions.
Here’s the list, long list, great list, of some of my previous incredible analyses. Each one, a winner:
🎯 ZENUSDT.P: Patience & Profitability | %230 Reaction from the Sniper Entry
🐶 DOGEUSDT.P: Next Move
🎨 RENDERUSDT.P: Opportunity of the Month
💎 ETHUSDT.P: Where to Retrace
🟢 BNBUSDT.P: Potential Surge
📊 BTC Dominance: Reaction Zone
🌊 WAVESUSDT.P: Demand Zone Potential
🟣 UNIUSDT.P: Long-Term Trade
🔵 XRPUSDT.P: Entry Zones
🔗 LINKUSDT.P: Follow The River
📈 BTCUSDT.P: Two Key Demand Zones
🟩 POLUSDT: Bullish Momentum
🌟 PENDLEUSDT.P: Where Opportunity Meets Precision
🔥 BTCUSDT.P: Liquidation of Highly Leveraged Longs
🌊 SOLUSDT.P: SOL's Dip - Your Opportunity
🐸 1000PEPEUSDT.P: Prime Bounce Zone Unlocked
🚀 ETHUSDT.P: Set to Explode - Don't Miss This Game Changer
🤖 IQUSDT: Smart Plan
⚡️ PONDUSDT: A Trade Not Taken Is Better Than a Losing One
💼 STMXUSDT: 2 Buying Areas
🐢 TURBOUSDT: Buy Zones and Buyer Presence
🌍 ICPUSDT.P: Massive Upside Potential | Check the Trade Update For Seeing Results
🟠 IDEXUSDT: Spot Buy Area | %26 Profit if You Trade with MSB
📌 USUALUSDT: Buyers Are Active + %70 Profit in Total
🌟 FORTHUSDT: Sniper Entry +%26 Reaction
🐳 QKCUSDT: Sniper Entry +%57 Reaction
📊 BTC.D: Retest of Key Area Highly Likely
This list? It’s just a small piece of what I’ve been working on. There’s so much more. Go check my profile, see the results for yourself. My goal is simple: provide value and help you win. If you’ve got questions, I’ve got answers. Let’s get to work!
KAVAUSDT

Bullish triangle closing in for KAVATurns out kava wasn't ready to break out of the ascending triangle I mentioned in my recent post just yet, price dropped and bounced from the bottom support. There are slight hidden bullish divergences on obv and rsi on the daily chart and price is lagging behind to that of some other alts and current price action is indicating it is ready to catch up. Expecting next test of the triangle top to result in a breakout and a strong move up.
DYOR and trade safe!

KAVAUSDT Long-Term Accumulation/Distribution StrategyKAVAUSDT is presenting a compelling opportunity for long-term accumulation and distribution. With an entry price range between $0.65 to $0.4 and a target price of $5, this strategy aims for substantial returns over time.
Weekly charts reveal a significant increase in volume over time, indicating strong accumulation. This accumulation phase suggests underlying strength in the asset, making it an attractive opportunity for investors seeking long-term growth.
Risk Management:
To mitigate risk, consider allocating 1-5% of your portfolio at higher price levels, increasing to 5-10% and 10-20% as prices decline. By diversifying your investments and managing risk levels accordingly, you can navigate market fluctuations effectively.
Note: split your major money like if you have 1000$, split it into 10 parts so each trade has 100$ allocation, now use that 100$ to buy in 1-5%, 5-10% & 10-20% respectively.
With a strategic long-term approach and diligent risk management, KAVAUSDT offers the potential for substantial returns. Remember to think long-term to build sustainable wealth and capitalize on the opportunities presented by this asset.

Kava in the floorhello friends
This token, with its modification, is in a good position to buy.
You can buy a step because we are on good support.
If the resistance is broken, we expect the specified targets to move.
Note that you must consider a purchase step in case of further correction of the price.
Be successful and profitable.

Riding the KAVA wave: From EMA retrace tot Fib heightsI'm gonna ride this one all the way to the top! With a beautiful retrace to the 50 EMA and my take profit target at the 1.414 Fibonacci level of $12.93 , KAVA is showing strong potential.
As a DeFi powerhouse, it offers seamless interoperability and secure lending, supporting major cryptocurrencies like BTC and XRP. Built on the Cosmos SDK, KAVA’s unique co-chain architecture bridges Ethereum and Cosmos ecosystems, delivering scalability and flexibility. Competing with DeFi giants like Aave, Compound, and MakerDAO, KAVA’s focus on speed and cross-chain functionality sets it apart in the evolving landscape. 🚀

KAVAUSDT Long-Term Accumulation/Distribution StrategyKAVAUSDT is presenting a compelling opportunity for long-term accumulation and distribution. With an entry price range between $0.65 to $0.4 and a target price of $5, this strategy aims for substantial returns over time.
Weekly charts reveal a significant increase in volume over time, indicating strong accumulation. This accumulation phase suggests underlying strength in the asset, making it an attractive opportunity for investors seeking long-term growth.
Risk Management:
To mitigate risk, consider allocating 1-5% of your portfolio at higher price levels, increasing to 5-10% and 10-20% as prices decline. By diversifying your investments and managing risk levels accordingly, you can navigate market fluctuations effectively.
Note: split your major money like if you have 1000$, split it into 10 parts so each trade has 100$ allocation, now use that 100$ to buy in 1-5%, 5-10% & 10-20% respectively.
With a strategic long-term approach and diligent risk management, KAVAUSDT offers the potential for substantial returns. Remember to think long-term to build sustainable wealth and capitalize on the opportunities presented by this asset.

Kava Heavy Bearmarket- This analysis is presented as a tutorial. Some of you may already be familiar with MACD, but for those who aren’t, I’m happy to guide you through it.
- Today, I’d like to share some insights on how to determine whether a token is still in a bear market or if it's on the verge of changing direction.
- As always everything is noted in the graphic, so lets go :
1 . First, focus on the orange line, which is the most crucial one, sitting around $1.20. Did you notice that in 2020, Kava bounced off this line? Back then, it served as strong support. Now, take note that Kava was rejected twice in 2023 and 2024 at this exact same price level, this support just turned as a strong resistance.
2. Take a look at the MACD indicator Lines. During Kava's bull market in 2020, the MACD was consistently moving in the positive zone (bullmarket green area). After Kava's crash, observe how Kava have been repeatedly rejected at this exact middle line and continued to evolve in a negative zone (bearmarket red area).
3. Finally, take a closer look at the "hammer Emoji" and the bearish trendline. You will observe that everything is interconnected. At times, Kava gets "hammered" at the $1.20 level along the middle line, while at other times, it encounters resistance on its bearish trendline. None of this is coincidental.
Conclusion :
- Kava remains is still in a heavy bear market. As a relatively young token, it's difficult to analyze long-term historical data. However, with time, extending the timeframe to 1 or 3 months can help reduce noise and potentially detect a bullish reversal.
- Kava's key level is $1.20. When it stays below this, it's better to step back, touch some grass, and wait for a breakout before considering any long positions.
- If you’re looking to trade profitably, always go with the flow. Don’t try to long something that’s trending downward or short something that's rising. It’s simply a matter of logic.
Happy Tr4Ding !

KAVAUSDT Falling WedgeKAVAUSDT technical analysis update
KAVAUSDT has formed a falling wedge pattern and has been trading within this pattern for 1,450 days. The price has now touched both the falling wedge support and the March 2020 bottom support, which is considered a strong support level for KAVA. We can expect a significant bounce from the current level.
Regards
Hexa

KAVAUSDT Reversal Confirmed!KAVUSDT Technical ANlsysis update
SEED_DONKEYDAN_MARKET_CAP:KAVA price has formed a triangle pattern on the daily chart at the bottom. The price has now broken the triangle resistance line and is trading above the 100 EMA on the daily chart. We can expect a strong bullish move from the current level. A sustained move above this level could signal further upside potential.
In the weekly chart, KAVA price is bouncing from the 2020 support level and trading within a falling wedge pattern

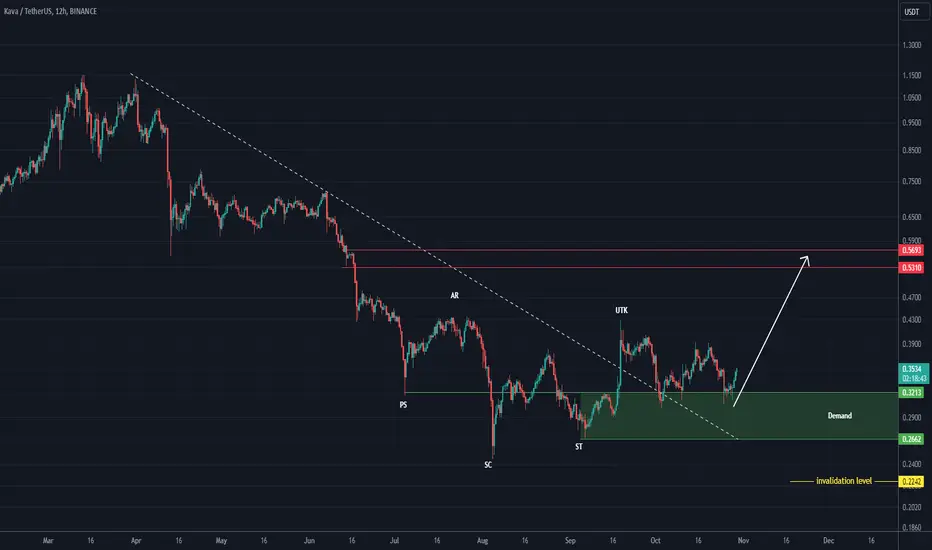
KAVA is really bullishWe have signs of a trend reversal at the bottom for KAVA.
Many buy orders have been collected. In our opinion, the upcoming resistances will be broken and the price will reach the red box.
The target is a red box.
Closing a daily candle below the invalidation level will violate this analysis.
For risk management, please don't forget stop loss and capital management
Comment if you have any questions
Thank You
KAVAUSDTKAVA ~ 1W
#KAVA Back to retesting this support block,. If you still have Conviction on this coin,. This support block would be a good buying spot for now.

Is #KAVA on the Brink of a Massive Breakout? Don’t Miss ThisYello, Paradisers! Is this the moment we’ve been waiting for the #KAVAUSDT? Let's look at the latest analysis of the #KAVA and see what's happening:
💎#Kava is currently compressed within a falling wedge pattern, building up momentum for a potential bullish breakout.
💎If the bulls muster enough strength, we could see KAVAUSDT break free from this formation, potentially igniting a powerful bullish wave. The price may surge toward the internal resistance zone around $0.388 if this trend continues. We might even see momentum push toward a major resistance level if momentum persists!
💎But caution is essential. If the bulls can’t deliver the necessary momentum, we might see KAVA slipping toward the lower support zone at $0.23–$0.25 as it hunts for liquidity.
💎If this critical support zone also fails, bearish pressure could increase, leading to a further decline.
Stay focused, patient, and disciplined, Paradisers🥂
MyCryptoParadise
iFeel the success🌴

KAVAUSDTKAVA ~ 1W ✅
#KAVA This is the final support for this Coin. if you have Conviction on this coin,. This should be a very good price for you to make a purchase. at least for 20%++


KAVA Technical Analysis in a Weekly TimeframeHello everyone, I’m Cryptorphic.
I’ve been sharing insightful charts and analysis for the past seven years.
Follow me for:
~ Unbiased analyses on trending altcoins.
~ Identifying altcoins with 10x-50x potential.
~ Futures trade setups.
~ Daily updates on Bitcoin and Ethereum.
~ High time frame (HTF) market bottom and top calls.
~ Short-term market movements.
~ Charts supported by critical fundamentals.
Now, let’s dive into this chart analysis:
Since August 2021, KAVA has been in a downtrend and is now close to an all-time low. There has been no significant growth, and the current price range seems to be a dead end.
If KAVA doesn't manage to recover, we could see a new all-time low and a price discovery phase toward the downside.
In my opinion, KAVA should respect this ATL support, rebound by breaking above the resistance trendline, and start a bullish rally. The RSI is in the oversold zone, indicating a potential bullish move.
Key levels:
- Important Support/Accumulation: $0.2403
- Primary Resistance: $0.558
- Long-term Target: 10x-20x
DYOR, NFA
Please hit the like button to support my content and share your thoughts in the comment section. Feel free to request any chart analysis you’d like to see!
Thank you!
#PEACE

Kava long road to 6$BINANCE:KAVAUSDT
Kava personally for me underrated now. 100% coins in circulation supply only 1b
Possible Targets and explanation idea
➡️Weekly tf, trade around 27 accumulation block
➡️Jan 2023 got main signal to buy on W based on Trade on indicator
➡️Trade around buy line on take profit indicator
➡️Road to 6B market cap and sweep EqHigh Jan-Apr 2022
➡️Money inflow on Weekly tf on money power indicator and MACD div like confirmation
➡️ Main targets for bull run I think way higher 6b market cap
Hope you enjoyed the content I created, You can support with your likes and comments this idea so more people can watch!
✅Disclaimer: Please be aware of the risks involved in trading. This idea was made for educational purposes only not for financial Investment Purposes.
---
• Look at my ideas about interesting altcoins in the related section down below ↓
• For more ideas please hit "Like" and "Follow"!

KAVA (Kava.io): Approaching ResistanceTrade setup : Price remains in a downtrend, trading well below 200-day moving average. It had a bearish breakout from Falling Wedge pattern and dipped as low as $0.32, making a new 52-week low. It bounced from very oversold levels (RSI < 25!) near that $0.32 support and is approaching $0.42 resistance now, where it's likely to get rejected and revisit $0.32. It's too early to tell if this is a sign of trend reversal or just a bounce in a downtrend.
Pattern : Price is Approaching Resistance , which is a level where it could pause or reverse its recent advance, at least temporarily. Resistance is often a level where price got rejected in the past, or potentially prior Support level that was broken. (concept known as polarity). Once price breaks above resistance, it can advance higher to the next resistance level. Learn to trade key levels in Lesson 7.
Trend : Short-term trend is Strong Down, Medium-term trend is Strong Down and Long-term trend is Strong Down.
Momentum : Price is neither overbought nor oversold currently, based on RSI-14 levels (RSI > 30 and RSI < 70).
Support and Resistance : Nearest Support Zone is $0.32. Nearest Resistance Zone is $0.42, then $0.55.

KAVA PRICE ACTION TRADINGToday i will try to explain how to play with Kava in a simple way.
- Remember always that in Cryptos are not easy as forex or stocks, because movements are always brutal.
- The first step is always to detect the real trendline.
- Detect 3 points. Bouncing Points, Rejection Points.
- Some traders use only 2 points, but i am old style trader, so i really need 3 Points to Draw the trend.
- Remove the abnormality ( FOMO and PANIC )
- Draw your line.
- Now you will need to find PRICE ACTION AREAS.
- Those areas can be easily detected by the price fluctuating for a long period of time in the same zone.
- For KAVA right now we are fluctuating between $0.75-$1.25$ ( Price action zone 2)
- Now you can draw your price action lines.
---------------------------------------------------------------------------------------------------------------------------------------------------------------
METHOD 1
---------------------------------------------------------------------------------------------------------------------------------------------------------------
- So to enter a position you need to understand that you never know if you are right, or if you are wrong. anyone have a magic ball.
- The best way is to NEVER GO ALL IN.
- Keep always more juice to rebuy if the market crash.
- For exemple, you could try to enter KAVA Market at 0.75$ (invest 25%), in case of DIP to 0.5$ (re-inject 75%) ( this is very important!!)
---------------------------------------------------------------------------------------------------------------------------------------------------------------
METHOD 2
---------------------------------------------------------------------------------------------------------------------------------------------------------------
- Simple wait to see if KAVA will break out the Trendline
- in that case you will need to wait the price to break out from triangle (Yellow Triangle)
- Again never go all in, on a breakout, some breakout could be fakes.
- Keep always Juice.
---------------------------------------------------------------------------------------------------------------------------------------------------------------
- More you will understand and detect price movements, supports, resistances, breakouts, more you will trade better.
- Price action and trendline are the basic of trading.
- indicators are complementary.
PS : This method can also be applied by Shorting the market. ( just inverse everything ).
- Happy Tr4Ding !

KAVAUSDT.1DAnalyzing the daily chart for KAVA/USDT, we see a number of technical indicators that provide insights into the asset's recent performance and potential future movements.
Price Action: KAVA/USDT is currently trading near the 0.6135 level, having recently tested and bounced off a support level around 0.5002. This support zone is critical as it prevented further downside several times in the past, which suggests strong buyer interest at this level.
Resistance Levels: On the upside, the immediate resistance levels are marked at R1 (0.8319) and R2 (1.1651). The asset has struggled to break the R1 level since early 2024, indicating a strong selling presence. Overcoming this could lead to a test of R2, which has not been touched since late 2023.
Moving Average Convergence Divergence (MACD): The MACD line is slightly below the signal line, and both are trending below the zero line, which generally suggests bearish momentum. However, the MACD histogram, currently showing smaller bars, hints at decreasing negative momentum.
Relative Strength Index (RSI): The RSI is hovering around 39.53, which is near the oversold territory but not quite there yet. This suggests that there might still be room for downside if selling pressure continues, although it's also close to levels where we might expect buying interest to reemerge due to perceived undervaluation.
Volume and Volatility: The chart does not explicitly display volume and volatility, but these factors would typically provide additional context, especially around key price movements and resistance/support tests.
Conclusion:
Based on the current technical setup, KAVA/USDT is in a critical juncture. If it holds the support around 0.5002, there could be potential for a rebound towards 0.8319, especially if broader market sentiment improves. However, traders should watch for any further weakening indicated by MACD and RSI, which could lead to a breakdown below support. Given the bearish bias indicated by MACD and the proximity of RSI to oversold conditions, a cautious approach is advisable. Setting stop-loss orders just below the current support level might protect against unexpected downturns, while aiming for R1 as an initial profit target makes sense from a risk-reward perspective.

KAVA Analysis: Navigating the Range🔍Bitcoin's dominance is creating market uncertainty, resulting in low volatility for many altcoins, including KAVA. KAVA is a project within the Cosmos ecosystem, known for its significant staking activity, leading to smoother price movements.
📆 Coin of the Day: KAVA
About the Project
KAVA is a project within the Cosmos ecosystem, known for its significant staking activity which leads to lower volatility and smoother price movements.
🧩 Technical Analysis
4-Hour Timeframe
This analysis focuses on futures trading, examining different scenarios.
♟ Support and Resistance: KAVA has primary support at 0.6216 and primary resistance at 0.7036. The major resistance level is at 0.7725, while a significant support level is at 0.6216. The market is currently ranging between 0.7036 and 0.6495, making it challenging to trade within this range due to the fixed range volume profile.
📉 Bearish Scenario: If the price breaks below 0.6216, the next bearish target is 0.5572. This level becomes significant for confirming a new bearish phase.
📈 Bullish Scenario: If the price breaks above 0.7036, we can look for a target at 0.7725. Confirmation of bullish momentum would be crucial for entering a long position.
📊Volume Analysis
The volume is currently ranging with a slight sell momentum. Significant buy volume is needed to break the resistance levels, and increased sell volume is required to break the support levels.
👨💻 Trading Positions
🪄Long Position
Primary Entry Trigger: Break above 0.7036
Strategy: Open a position on the break of 0.7036 and wait for confirmation from the price to set the target at 0.7725. Consider taking partial profits at 0.7725 and adjusting stop loss to entry.
💣Short Position
Primary Entry Trigger: Break below 0.6216
Strategy: Open a position on the break of 0.6216 as this is a very critical level in the market. Target the next support at 0.5572. Adjust stop loss based on price action.
📝 Summary: KAVA is currently ranging within key support at 0.6216 and resistances at 0.7036 and 0.7725. Traders should watch for breaks of these critical levels to open positions. The fixed range volume profile indicates significant trading activity between 0.7036 and 0.6495, making trading within this range challenging. Long positions should be considered above 0.7036, while short positions should be considered below 0.6216. Always keep an eye on Bitcoin's market conditions as it significantly influences KAVA's price action.
🧠💼It's important to acknowledge the inherent risks in futures trading, with the potential for margin calls if risk management is neglected. Always adhere to strict capital management principles and utilize stop-loss orders, ensuring that the initial target offers a risk-to-reward ratio of 2.
🫶If you enjoyed this analysis and want to support me, please boost this analysis. Feel free to leave a comment or suggest a coin you'd like me to analyze next.

KAVAUSDT Triangle Pattern!KAVAUSDT Technical analysis update
KAVA has formed a triangle pattern on the 4-hour chart. It is currently bouncing from the triangle support, indicating that we can expect a significant move from the current support level.
Regards
Hexa

KAVA looks bullishKAVA appears to be forming a bullish triangle.
We now seem to be in the final wave of the triangle (Wave E).
By maintaining the green range, it can move towards the targets
The targets are clear on the chart.
Closing a daily candle below the invalidation level will violate the analysis.
For risk management, please don't forget stop loss and capital management
When we reach the first target, save some profit and then change the stop to entry
Comment if you have any questions
Thank You

KAVAUSD 1WKAVA ~ 1W
#KAVA This is a very good support block to start accumulating again.
Make purchases gradually from here, with a minimum target of 20%+
