Kava.io (KAVA) - September 13 Hello?
Dear traders, nice to meet you.
"Like" is a huge force for me.
By "following" you can always get new information quickly.
Thank you for always supporting me.
-------------------------------------------------- -----
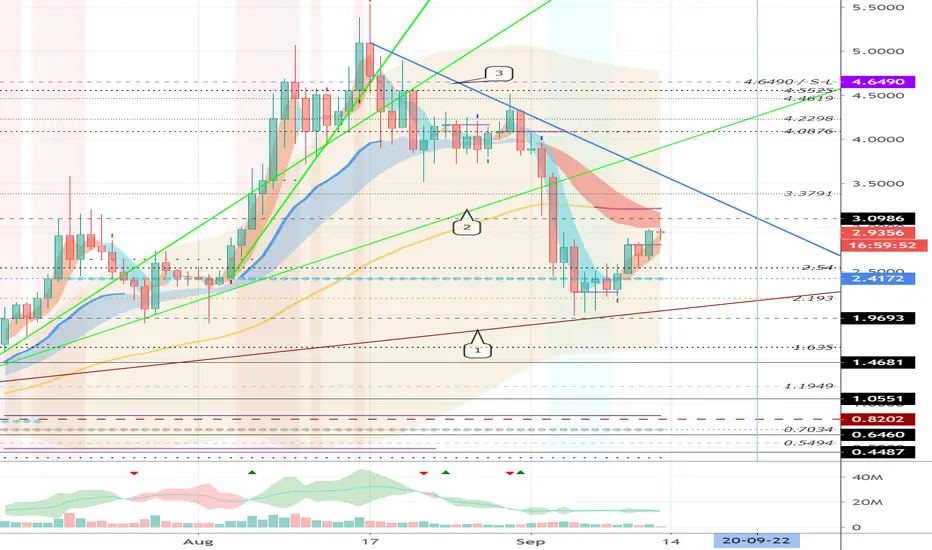
It remains to be seen if it can rise above the 3.0986 point.
If you break the downtrend line (3) around September 22 and get support above the 3.0986 point, I think there is a high possibility of further gains.
If you fall from the uptrend line (1), I think you need to trade to preserve profit and loss.
If it declines and gets support again in the 2.4172-2.54 section, the flow described above is valid.
-------------------------------------------------- -------------------------------------------
** Check support, resistance, and abbreviation points.
** Support or resistance is based on the closing price of the 1D chart.
** All explanations are for reference only and do not guarantee profit or loss on investment.
Explanation of abbreviations displayed on the chart
R: A point or section of resistance that requires a response to preserve profits
S-L: Stop-Loss point or section
S: A point or segment that can be bought for generating profit as a support point or segment
(Short-term Stop Loss can be said to be a point where profits and losses can be preserved or additionally entered through installment trading. You must trade from a short-term investment perspective.)
KAVAUSDT
KAVA/BTC (Retest Major Support @ 18k sat?)BINANCE: KAVABTC
-This coin is on waterfall after the break of support at 33k sat
-Its value has declined by -53% from the swing High
-If we are looking for a potential strong buy area
-The level of 18k sat is a high probability of potential swing point entry
-It was a confluence of previous key resistance and turned support last July trading
-Let's see if a bullish sign will happen if the price get this zone
**If you like my daily Published Ideas, Please don't forget to leave a thumbs up and comment below. Thank you!**


KAVA is very close to perform a 10% move!Just a quick analysis on KAVA.
- EMA's uptrend
- RSI above 60
- Third buying wave in a row
- In resistance area
Overall looks good, I am in since 2.7501, looking for around 10%, I will see how it acts in the TP level of $3.06.
TP1 below $3.06
TP2 below $3.315
This should go well!
Tibor

KAVAUSDT, Some squeezing above the level!If the price will cross down the level and fix below it will be a sell signal.
The situation looks like the "bulls" have no power.
The potential profit will be 3 times bigger than the risk.
Push like if you think this is a useful idea!
Before to trade my ideas make your own analysis.
Write your comments and questions here!
Thanks for your support!

KAVA/BTCKava testing the top of the ascending channel. In confluence with the bottom of the falling wedge. Message me for more deets.

KAVA to double digits!This chart is just an example of this strategy, go try this out with your shitcoins!
This is simple buy startegy for bull markets (1D,USD charts).
Buy opportunities are based off RSI and EMA200 close only.
1. When a shitcoin crosses over EMA200 properly, and bull market is starting, its time to start using this strategy!
2. This asset now needs to stay above EMA200.
3. Put a horizontal line at both 50 and 60 RSI, when RSI hits around that level, u start u looking for buys. When RSI hits 50 or lower, its a good buy opp. Riskier buys are around 60-51 RSI.
4. EMA200 hits are your other good buy opp if the price drops back that far.
Sometimes the price may dip below EMA for a few days, so do not panic if it does! U should start to worry only if the price is over than a week under this magic line, or the price tests it as resistance on a daily when under.
After the accumulation range is broken u usually don't get EMA touches anymore, but when u look at RSI u can still get a few good entries before moon and lambos.
buy boxes:
green: good buy (50 or lower RSI, even better if touching EMA)
yellow: buy with more risk (60 to 51 RSI, trade gets riskier when price is far from EMA)


KAVA AnalysisKava needs to break the next fib level 0.618 or will see new local low.
It looks good for scalping.
Keep in mind that the crypto greed is at 78, which is really high.
To be rich, fear when people are greedy, and vice versa.

KAVA.USDT/BTC (Y20.P3.E5).Waiting to enterHi All,
Next coin on the list to review and plan for as it has given good results so far as part of the DeFi boom.
OBSERVATIONS:
============================
> On the daily, we can observe the following:
a) Large bearish divergence at play
b) A number of large bearish candles
c) Fib. levels corresponding to the impulse wave have not hit the 3 main levels yet
d) The 21/34 EMA on the daily on this uptrend has played support
e) Previous resistance equates to likely support at the 0.382 fib or more likely the 0.5 for the daily trend to be higher highs and lower highs.
f) Note the 2 indicators, both show the crossing of their signals\rsi's with bearish divergence reflecting on price action.
e) On the 4 hrly or daily, we can envision a correction wave to the area of interest.
MY THOUGHTS:
============================
I'm not expecting a deep bearish pullback, but one that hits the 21/34 EMA ribbon on the daily.
Hence I will be looking for the 21/34 EMA on the daily as support along one of these fib levels and looking for a bullish candle at the lower time frames, say 8 hrly.
This might equate to entering at the 0.382 or 0.5 fib level on the daily chart.
Which equates to the 200 EMA on the 4 hrly chart, as the chart below (the blue shaded band).
I will also be watching the cross over of the WT wave on the 4 hrly, near the bottom of the chart and\or along with a 8 or 12 bullish candle at the specific levels mentioned.
With the Phoeix, I will be looking for the cross over of the green rsi over the red and above 50% level on the 12 or daily chart.
As for the BTC pairing, The price action of KAVA on USD\T should be aligned with the pairing as the chart below. Maybe the EMA ribbon will be in the same proximity as the blue box range.
Either one will be satisfactory.
4 HRLY CHART
DAILY CHART
DAILY BTC pairing CHART:
The price action of KAVA on USD\T should be aligned with the pairing as the chart below.


KAVA on track with weekend prediction. KAVA is keeping pace and the MA flip flop is proving to be a relevant indicator. We could see another 50% gain in price in time for the next crypto-payday promotion. It's hard to believe, heck, I barely believe it but, numbers backed by historical performance tend to come in close in the future. Icing on the cake would be a Coinbase add. May still be possible because DEX, out performed exchanges by 5x last month. So Coinbase may have to shift its business model or risk becoming irrelevant. If that or a full Binance integration announcement was to happen, we could see a $10 KAVA supported due to the higher demand for USDX loans. Amazing Tech.

KAVA 80 MA and 50 MA flip-flop signaling a possible bull runThe last time this happened was on Aug 3rd, KAVA over the next 7 days rn up by 140%, with that same level of enthusiasm, Kava could find itself at $7.50 by Wednesday this coming week; possibly temporarily hitting as much as $10. But what does your crypto analyst know? Only time can tell, ball are on the table, this is quite the claim, let's see how this plays out. Beyond the technicals, the sentiment is growing. Swipe and Kava publicly announced the ability to use USDX as a means of making payments anywhere VISA is accepted. That opens up 60 million locations globally to make use of their USDX loans. Still bullish for now.


KAVAUSDT Analysis for next days in Augkava is forming strong uptrend from May2020 and it'll continue bullish trend in next month

DEFI continues to rip!There are a lot of coins that are still looking for use cases out there. I remember when there were coins that said that they can do anything and everything. They would even tie your shoe for you! According to the shills that is. Right now in crypto, there is a group that just doesn’t stop. That is the newly founded Defi movement. These coins have found an area where they can actually be useful. In a world where interest rates are in the zero bound, how can savers make their 7%?It sure isnt high interest savings accounts or bonds. What about high dividend paying stocks? Well dividends are being cut left right and center! Defi has that answer with many different ways to make that happen. So what coins are part of this?
Well there are a couple of ways to track them. I personally have made lists from some of the sites like coinmarketcap and coingecko. They both have tabs specifically for the Defi movement. FTX exchange also has a Defi ETF that gives you exposure to some of the bigger names in the space. We will use that as a charting tool.
So if some of the bigger names in the space have done 100% in 50 days, what are some of the smaller cap coins doing? The answer is way more. We can cover some of the specific names over the next few days, but one thing is for sure, this is the area that the money is flowing to right now in crypto. So manage your risk and keep your head on a swivel!
Happy Trading!
Brandon Anderson
www.derzzycharts.com

KAVA 4hr Chart Breakout - KAVABTC KAVAUSD KAVAUSDT KAVA ALT COINKAVA 4hr Chart Breakout - KAVABTC KAVAUSD KAVAUSDT KAVA ALT COIN

KAVAUSDT AnalysisIf you bought from BUY 2 signal, enjoy your 9.29% PROFIT that you made in 1 day!
Since there are buy 2 signal & green cloud, do not hurry to sell.
Also, there is a candle open-closed (1D chart) above the horizontal line (2.92).
You can wait for EngineeringRobo's sell signal or wait for candles to open-close below the horizontal line (2.92).

KAVA/USDT is Breaking out!Hey, I am back with another idea, this time looking at Altcoin, KAVA.
Fun fact, in my country KAVA means coffee so this maybe my another favourite alt coin haha..
About the chart, the price is breaking resistance area and is currently breaking out from the Bull flag, which is a bullish pattern.
Get in quickly, this looks good!
Good luck with the trade, don't forget to follow in order not to miss out on another trade signals.

KAVA.USDT (Y20.P3.E2.v2). Waiting is overA continuation from the previous post, link below;
While BTC goes sideways, expect some ALTS to make their move, anther ALT pumb.
No time for words as this will likely move quick.
Observations:
KAVA has a nice macro uptrend
> It broke the channel
> Its facing a key resistance
> Off the fib level of 0.382
> 21 EMA on the Daily
> Daily RSI holding as well as the WT having confluence
Please give me a tick or like for this post.
Regards,
S.Sari
Previous post


KAVA.USDT (Y20.P3.E2).Waiting on support levelHi All,
(ref > A.Charts)
Kava (Defi) gave a good run and its wise to look for it again.
I have 2 possible entrance points but for now, its heading down with clear downward pressure (based on a number of indicators) including the daily candle sticks.
Anyway, we have the option at 0.618 fib retracement equaling the bottom of the channel or much lower where we the previous strong resistance to be now our support (0.786 fib level).
Similarly for KAVA.BTC pairing.
Lets keep an eye on this.
Please give me a like or tick for this post.
Regards,
S.Sari
My PREVIOUS POST FOR KAVA

KAVA Analysis Q3 2020 -Q3 2021 Public$KAVA is looking solid right now - crossing blue resistance line will turn it to Major Bullish Sentiment as it was previous the strongest Support line. It completed a IH&S cycle for about 135days and if it continues to replicate the same pattern for the coming 135days minimum we can lead to $10 target. we have to see how it plays out for the coming weeks as it might either have another leg up or if BTC decides to dump in the coming weeks towards August 2020 it will affect current TA as well. Accumulating Entry Point would be from Max $2. Ideally would be $1 or less.
