KAVAUSDT analysisThis is a definite buy. With Super buy, moon and green signal, I will wait until 2 of those signals turn red. It has broken an all time high. I also watching for any sell signals from Robo 1 and Robo2 as helper indicators.
KAVAUSDT
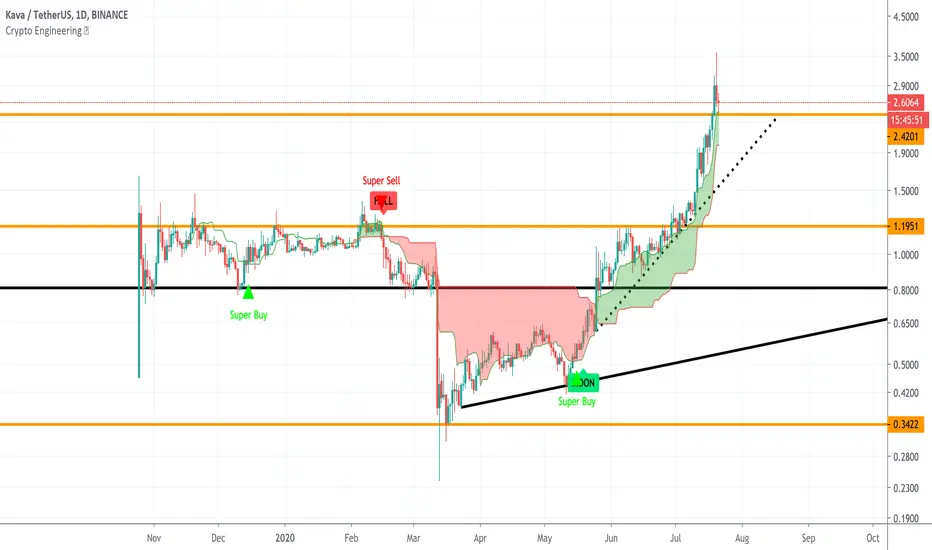
KAVAUSDT Analysis The trend has been increasing and there is now an open-close candle above the uptrend line. Therefore, it is a good time to buy it! The trend might start to decrease. In this case, I will keep my eyes open for an open-close candle below the support line and then sell it.

KAVAUSDT ❌ Bullish Continuation OR Bearish Correction (Multi TF)💬 Between the cryptocurrency exchange Kraken adding KAVA, the ongoing DeFi boom, and the recent series of higher highs on higher timeframes leading up to this point, KAVA's chart is looking bullish. Our goal here is to look for a pullback before price moves up again. With that in mind, let's take a look at some levels.
Hit that 👍 button to show support for the content!
Help the community grow by giving us a follow 🐣
-----
Support:
S1: S1 is a great support level to look at if all we get is a small pullback before moving up. You can see how price reacted to the S/R level (blue line) right under S1. We might see a shallow pullback similar to that at S1, with price then breaking past the recent highs before selling back on that top range to test it as support (as illustrated by the upper abc and note).
S2: If S1 doesn't hold, we could perhaps see a bearish correction rather than quick consolidation before a run. This path would be confirmed with for example by a rejection off of S1 after a test of the S2 orderblock cluster. The S2 level held on the way up, so we do expect a reaction here regardless.
Resistance:
The previous range highs are the first and only point of resistance for KAVA bulls. Any additional resistance would have to be created by falling price action (for example if we get that bearish correction noted in the support section).
Multi Time frame: :
The multi-timeframe S/R and orderblock cluster and main price pivot point, as visualized on the 4-hour and brought onto the 30-minute chart, is a logical support given the amount of activity seen here. If we do get that bearish correction, this is the level that must hold for KAVA to remain bullish. Anything below this level is a very bad look for the bulls, the progress made after conquering such a substantial range such as the one highlighted on the 4h-hour would all be given back.
-----
Summary:
KAVA is hot right now, could be some time before it gets hotter given its new listing and the DeFi craze. No matter how hot something gets though, price is always going to pull back eventually. The goal here is to buy that pullback with the assumption that the bulls aren't going to give up too much ground. With that in mind, caution is in order if you see that bearish correction plays out. What makes sense here is being focused on new highs above S1 and using caution otherwise.
Resources:
www.coindesk.com
✨ Drop a comment asking for an update, we do NEW setups every day! ✨


KAVA.BTC (Y20.P3.E1).StalkingHi All,
Kava is another Defi compliant product. It continues on its upwards trend with the possibility of new macrostructure new highs.
Its holding above the 0.0001407 sato or $1.288 USDT mark and as long as it holds above the current uptrend structure I would not be bearish on it.
The caveat, as long as Bitcoin can hold up, we can see KAVA continue into price discovery.
Please give me a like or tick for this post.
Regards,
S.Sari
Daily KAVA.BTC chart, has a bearish div. however as we know, if it makes new highs, the div. is negated.
KAVA/USDT Chart, 12 HRLY

KAVAUSDT Swimming in a Heavy Consolidation Zone. Not much to say here aside from the fact KAVA is sitting within a heavy consolidation zone... Keeping a close eye on Volume and Momentum indicators.. Would love to see a slight correction from where we are currently which would give me more confidence we could have a strong breakout above that zone when it's retested again. RSI isn't overbought and and Volume seems to be keeping up... Honestly, unless an overnight altcoin DeFi bull run kicks up, I do not have the confidence KAVA will be able to defend off the the heavy sell side pressure in order to break out of the zone quite YET..
SOOOOooOOOON.
IMO Kava is a solid DeFi project that aligns well with the overall DeFi Bull trend happening.. Just do not get caught in the FOMO
Let me know what you guys think :)

KAVAUSDTKAVAUSDT, the trend has been increasing and just hit the resistance line above. Watch an open-close candle above the line then buy. we are expecting more increase.
-It might start to decrease, keep your eyes on the support line. If it breaks it below, watch an open-close candle then sell. Due to the fact that expecting more decreases.

Bullish Accumulation Pattern after ressistance breakout on KAVA Hello, Traders.
KAVA breakout a bullish accumulation pattern above the resistance level (now support).
The Williams Alligator trend following Strategy shows us a bullish Trend on the daily chart since May.
The Willians Alligator is an indicator developed by Bill Williams. an early pioneer of market psychology
Its use is to identify a trend including the direction of it and filter the good signs or bad signs of ruins, preventing the market break that can cause damage.
The indicator consists of 3 moving averages shifted towards the future:
- Alligators Jaw (blue line): the smoothed moving average of 13 periods displaced 8 bars in the future.
- Alligator's teeth (red line): the smoothed moving average of 8 periods shifted 5 bars in the future.
- Alligator's Lips (green line): the smoothed moving average of 5 periods shifted 3 bars in the future.
TREND FORMING: The lips of the Alligator, the green line, is the fastest moving average and will be the first one a trader will want to monitor. You want to see the green line cross both of the slower moving averages. This is a sign that the Alligator is waking up.
When the “mouth” opens it is Buy or Sell indication and when the mouth is closed it is a take profit indication.
Push The like Button and Follow us on TradingView.

KAVA breakout of resistance trend line KAVA breakout of resistance trend line. Potential target after breakout resistance at 0.00012.
Strong supprot at 0.00009785.
Disclaimer: THIS IS NOT FINANCIAL ADVICE. All the information shared here is for learning and entertainment purposes only.

Kava Usdt Short Term Work For 2$The descending wedge fractal that I had been waiting for a long time was formed. My target is 1,5$ ~ 2$ for now. it is definitely not investment advice. is my personal work. Good luck to everyone.

KAVA/BTC. Great profit. 130 \ 155%Great profit. 130 \ 155%
The surest way to work now on the market is to work in the channel
Everyone perfectly understands the situation on the market: the dominance of BTC is growing noticeably, and it follows from this that people are getting out of the position regarding altcoins
therefore we trade against the dollar or USDT


KAVA/BTC (Bullish Descending Pattern?)KAVA/BTC
-testing the downward trendline resistance
-if this will be a temporary top
-the potential pullback area is between 7000-6500
-the best trading strategy is
-wait for good pullback and break of the trendline
-on the closed above the descending line resistance
-that's your buy signal
-it will signal a high chance of trend reversal
-upside target is up to 12500s


KAVAUSDT forming bullish BAT | Upto 14% move aheadFormation of bullish BAT:
This time on short term 4 hour chart the price action of KAVA token is forming bullish harmonic BAT pattern and soon it will be entered in potential reversal zone.
Buying And Sell Targets:
The buying and sell targets according to harmonic BAT pattern should be:
Buy between: $0.4694 to $0.4597
Sell between: $0.4925 to $0.5271
Stop Loss:
The potential reversal zone area which is up to $0.4597 can be used as stop loss in case of complete candle sticks closes below this level.
This idea is for short term traders not a long term idea; I will be keep posting more trading ideas.
Note: This idea is education purpose only and not intended to be investment advice, please seek a duly licensed professional and do you own research before any investment.


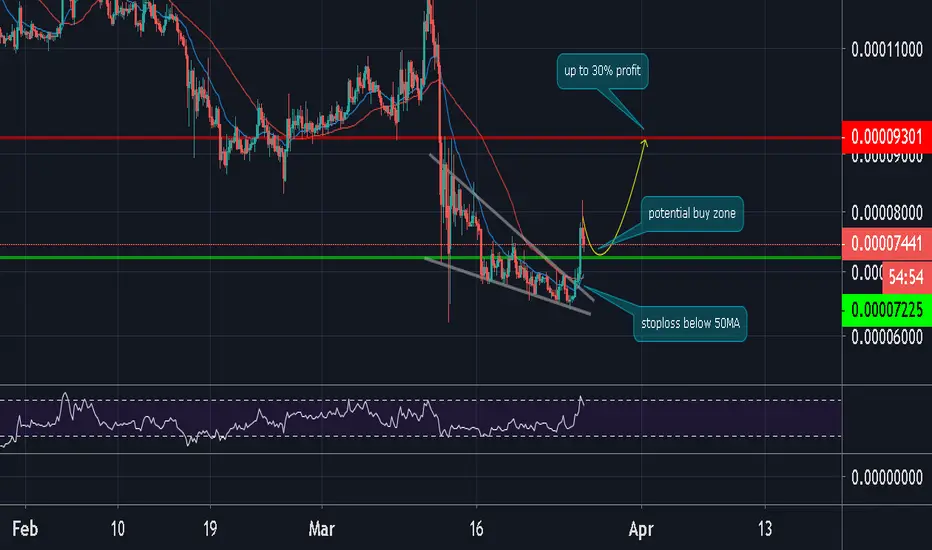
KAVA/BTC (Bullish breakout: up to 30% profit)KAVA/BTC
KAVA broke bullish of this descending channel and manages to change the 4H trend. If we see a pullback at 7000 sat area,
this will be a good opportunity for long positions and target the 9000 sats resistance zone.
The stop-loss is below the 50MA or 6700 sats.


KAVA ready to fire up a 50% Incoming rally, this coin is forming an ascending triangle.
Be sure to position yourself accordingly.

KAVAUSDT LONG - Past 2$Hey everyone!
After a long consolidation, I can't see this pair ranging for much longer without an expansion move soon.
Previously this was a pair already on the radar and provided a failed upside setup however it just keeps bouncing from maxima to minima of the range and now buyers and sellers are left to make an impulsive decision.
The bias is upside specially being a fresh coin that makes it easier to move into price discovery and activate the FOMO's.
Risk-Reward-Ratio (RRR) is taken from zooming into smaller timeframes and taking the last break of a daily high as seen here as our entry trigger.
At the same time, to reduce getting shaken out on volatilite moves, the stop loss is set in a classical manner - at the patterns valid 3L point.
Let's see how this one goes!
Take care,
Vlad The Crypto Trader
