KAVAUSDTThe price is in the middle of the long-term channel as well as the bottom of the daily time frame trend. The first target is 15%, the second target is 35%
KAVAUSDT

KAVAUSDTHello. We have a chance to go up with Bitcoin. Yes, this is a small rebound, but the potential is good.

KAVAUSDT - are you ready for the rally?We just went long on KAVA since the price is trading near the 61.8% Fiboinacci support. The risk/reward setup is decent and probability favors the uptrend. Let's get rolling KAVA~!

KAVA price where are you going?Today, KAVA will update its network. And almost at the same time, the announcement of the "fresh" US CPI.
If the two news turn out to be positive, this could be a c-c-combo push for the KAVAUSDT price to move up.
The critical level is $1.20. From this level, the price may begin to rise:
rapid growth along the $1.50-2.30 route
and a correction to $0.80
_____________________
Did you like our analysis? Leave a comment, like, and follow to get more

KAVA Road Map🗺️!!!Hi everyone👋( Reading time less than 2 minutes⏰ ).
If you want to invest in Kava(KAVA) , I suggest you read this post.
🌐 What Is Kava (KAVA) ❗️❓
Kava is a Layer-1 blockchain that combines the speed and interoperability of Cosmos with the developer power of Ethereum.
Kava was built from the ground up to optimize its resources for protocol growth, strengthened by its Cosmos EVM technology that enables maximum scalability, speed, security, and developer support.
Builders on Kava earn a share of Kava Rise's $750M developer incentive fund via the program's blockchain-based distribution method, designed to reward the top protocols every month based on usage.
-----------------------------------------------------------------------------------
Kava started to fall after completing the Diagonal pattern and breaking the lower line of this pattern.
The structure of Kava fall waves is in the form of five impulse waves .
Kava now seems to have completed the main wave 4 on the downtrend line .
🔔I expect the main wave 5 to end in the 🟡 Price Reversal Zone($0.525-$0.359) 🟡 and it will be a suitable area for mid-term investment.
Kava Analyze ( KAVAUSDT ), Weekly time frame ⏰.
Do not forget to put Stop loss for your positions (For every position you want to open).
Please follow your strategy, this is just my Idea, and I will be glad to see your ideas in this post.
Please do not forget the ✅' like '✅ button 🙏😊 & Share it with your friends; thanks, and Trade safe.

KAVAUSDT Short Bearish Will Go deeperKAVA price failed to break out during the weekend but is still trading inside a long-term bullish pattern.
The crypto market had a bullish performance last week. However, a short-term bearish reversal began near the end of the week and continued during the weekend.
The KAVA price has increased alongside an ascending support line since the beginning of the year. More recently, it bounced at the line on June 15 and began a sharp rally.
While KAVA reached a high of $1.28 on June 25, it failed to close above the $1.15 horizontal resistance area. Rather, it created a long upper wick (red icon) and fell. These wicks are considered signs of selling pressure since buyers could not sustain the price increase.
Despite the drop, the $115 area and the ascending support line together create an ascending triangle. This is considered a bullish pattern. So, a breakout down from it is the most likely scenario.
strategy bearish
sell only

KAVA IS BEARISHHi, dear traders. how are you ? Today we have a viewpoint to SELL/SHORT the KAVA symbol.
For risk management, please don't forget stop loss and capital management
When we reach the first target, save some profit and then change the stop to entry
Comment if you have any questions
Thank You


Kava. io forming a bullish BAT for upto 34.50% pumpHi dear friends, hope you are well and welcome to the new trade setup of Kava. io (KAVA) token with US Dollar pair.
Our last trade for KAVA was as below:
Now on a 4-hour time frame, KAVA is about to complete a bullish BAT move for another price reversal.
Note: Above idea is for educational purpose only. It is advised to diversify and strictly follow the stop loss, and don't get stuck with trade.

ETHUSDT DAILY : NICE RISK TO RIWARD Hi Guys ,Hope you well.
The chart shows everything, if you can buy in good limits and with confirmation, it can be a good profit for you, it always has very good performance.
Hi Guys, Hope you well. and have good weekend
As we have been waiting for a while, Bitcoin from our green box, which was a very good PRZ location, was able to grow well. Now we can see the prices of 34,500 and even 36,000 according to the excellent liquidity ranges, and similar to these imbalance areas in the Tether chart, which I will do in the next analysis. The expectation of the market is to reach the 35000 range with the weakness of the trend and then move towards the long-term upward trend.
SecondChanceCrypto
⏰25/JUNE/23
⛔️DYOR
Always do your research .
If you have any questions, you can write them in the comments below.and I will answer them.
And please don't forget to support this idea with your likes and comments.

kavausdtkava time frame 1D
thiiiiiiiiiiiiiiiiiiiiiiiiis issssssssssssssssssssssssssssssssssssssssss kavaaaaaaaaaaaaaaaaaa futuuuuuuuuuureeeeeeeeeeeee

kavausdtupdateeeeeeeeeeeeeeeeeeeeeeeeeeeeeeeeeeeeeeeeeeeee
kavaaaaaaaaaaaaaaaaaaaaaaaaaaaaausddddddddddddddddddddddddt

kavausdtkavaaaaaaaaaaaaaaaaaaaaaaaaaaaaaaaaaaaaaaaaausdddddddddddddddddddddddddddddddddttttttttttttttttttttttttttttttttt
loooooooooooooooooooong

kavaIf the green range is touched, we will expect to move towards higher numbers. And if the channel breaks, I can examine the green box and the lower green line.

kavaI expect an upward movement and a correction in the green lines to buy spots with a red stop loss

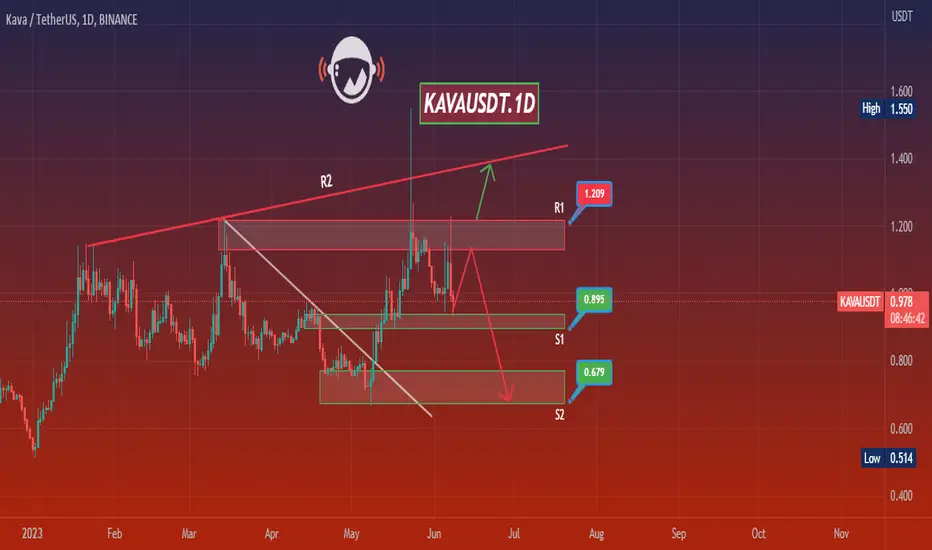
KAVAUSDT.1DMars Signals Team wishes you high profits*
This is a daily time frame analysis for KAVAUSDT.1D
We are in the daily time frame. As you can see, the price has hit our first support area and we expect the price to support and start moving towards our first resistance line. But if it cannot support the price and stabilizes below our support line, we expect further decline.
Warning: This is just a suggestion and we do not guarantee profits. We advise you to analyze the chart before opening any positions.
Take care
KAVA: Resistance BreakoutKava (KAVA) technical analysis:
Trade setup : Kava has traded completely against the market in recent week. This is bullish as it shows that there’s demand for the asset regardless of the overall bearish market sentiment. Price broke above 200-day moving average and $1.00 resistance which are signs of Uptrend. It retested those levels and bounced back up, which should confirm the bullish breakout. Upside potential to $1.40.
Trend : Uptrend across all time horizons (Short- Medium- and Long-Term).
Momentum is Mixed as MACD Line is below MACD Signal Line (Bearish) but RSI > 55 (Bullish). MACD Histogram bars are rising, which suggests that momentum could be nearing another upswing.
Support and Resistance : Nearest Support Zone is $1.00 (previous resistance), then $0.76. The nearest Resistance Zone is $1.15, which it broke, then $1.40.

KAVA LOOKS BULLISHHi, dear traders. how are you ? Today we have a viewpoint to BUY/LONG the KAVA symbol.
For risk management, please don't forget stop loss and capital management
When we reach the first target, save some profit and then change the stop to entry
Comment if you have any questions
Thank You


kava usdtkava usdt scalping , its supper bullish on weekly time frame target for long position on the the chart BINANCE:KAVAUSDT


KAVAUSDT is testing important levels, potential +10% from here
Hello Traders:)
Currently, the level of the top line of the Market profile from Monday is being tested. Previously, after breaking this level, KAVAUSDT exploded over 30% up. Currently, after returning and positively testing this level, I assume a return to at least the upper limits of the market profile from the previous days, which will give us at least 10% increase in KAVAUSDT. Negation of the scenario after breaking through today's lower limit of the market profile.
I wish you great trades!

KAVAUSDTKAVAUSDT is in strong bullish trend and currently providing 2nd pivot to increasing trendline from strong support zone.
Will it continue its bullish trajectory ?
