KCS/USD - KuCoin returns to $10. At Critical Support! 😱KCS had a nice rally in late May, but this quickly reversed in June with the price now back on the key support at $10.
The whole market crashed and ETH fell under its old all-time high. If Bitcoin crashes under $20k, then most altcoins will likely make lower lows.
What does this mean for KCS?
Probably a price under $10.
Bulls have to do their best to keep the price above this key level as otherwise the next support is found at $9 which would put KCS into single digits.
The indicators on higher timeframes remain bearish, while the shorter timeframes like 4-hours are bullish. This suggests a short relief will be followed by more pain.
A break below the support at $10 will settle any doubts. Bias is bearish for now.
Like and follow if you like my idea!
KCSUSDT

KCS - Strong Zones!Hello TradingView Family / Fellow Traders. This is Richard, as known as theSignalyst.
KCS is approaching a a strong support zone and round number 10.0 so we will be looking for buy setups on lower timeframes.
As per my trading style:
As KCS approaches the 10.0 zone, I will be looking for reversal setups (like a double bottom pattern, trendline break, and so on...)
Unless the 10.0 support is broken, then a movement till the 5.0 support where we will be looking for buy setups.
Always follow your trading plan regarding entry, risk management, and trade management.
Good luck!
All Strategies Are Good; If Managed Properly!
~Rich

KCSUSDT near the 2 year Support trend-lineThe KuCoin token (KCSUSDT) has followed the overall crypto market to the downside this past week, with the 1D RSI marginally breaking below the oversold 30.00 level. However, there is no cause for concern that the long-term bullish trend is reversing, as the Higher Lows trend-line that has been supporting the price since the February 28 2021 Low and held on another five Higher Lows, hasn't yet been reached.
In fact, the price, on RSI and candle terms, seems to be following the bottom sequence of May 19 - 2021 - June 22 2021. Technically, the next time the 1D MA50 (blue trend-line) breaks, we should return to the bullish trend within this Fibonacci Channel.
--------------------------------------------------------------------------------------------------------
** Please support this idea with your likes and comments, it is the best way to keep it relevant and support me. **
--------------------------------------------------------------------------------------------------------

KCSUSDT🔥 IT CAN BE EASY 8%Greetings to all👋
KCS is in a downtrend, I think it is still going to the lower support limit of $14
I think the instrument will soon begin an upward movement towards the trend line of resistance, so far we can wait for a pullback and go from the support zone to LONG. Profit 16.5$
✅Do not forget to visit the channel there is a lot of useful information about trading.Greetings to all👋

KCSUSDT 1D Long-term investment #1At the beginning of the year, we have published a serial of ideas introduced an investment trade into token Kucoin KCS, with a weekly updating of our opinions about the KCSUSDT price movement, and how we manage the position
The result is the break-even stop for +2.5% that we received when the whole cryptomarket began to fall.
More detail what we have chosen this token for medium(long)-term investment and the last update of the idea below:
Further, we only do shot short trades, because the market went into the stage of correctional fall.
And the other day, we have released a global idea on BTCUSDT, which noted that in our opinion, the price is now in a critical zone from where a not bad grew could be organized. More in more detail in the idea below:
Therefore, we will try to restore the investment section in the KCS, and every week we will update the information how we manage the position.
Considering that we expect growth in BTCUSD pair is a big chance that the rest of the cryptocurrencies will be tightened up by the main trade couple.
The price of KCSUSDT has bounced very well after May fall and now, after a weak correction (which may indicate the power of buyers) tries to fix above the mirror level of $15.00
Therefore, given the above facts, we offer the following input data for a long -term position:
Entrance in the range of $15.25-15.75
Stop below $10.99
Take Profit in the area of $41.50
Profit/loss ratio 6/1
We expect that the summer can give a not bad wave of growth, of course, if there are no force Major.
So, if you are interested in this section: Put a like, write a comment and subscribe to us , and we will update the information every week how we manage this position and what we see new ones on the KCSUSDT chart.

KCS | Bullish wedge patternKCS (KuCoin Token) bullish wedge pattern
We can see from the chart that it's forming an bullish wedge pattern
Buy on breakout
Targets:
18.38
19.88
21.20

KCSUSDT broke below its Channel. Levels to consider.The KuCoin token (KCSUSDT) broke today below the Channel Up pattern it has been trading in since the 2nd half of May. The obvious Support to look for now is the 4H MA200 (orange trend-line), with the next ones (14.930, 14.130 and 13.520), being the Higher Lows during the uptrend after the May 12 low. Every one of those Support levels can provide a rebound, so buying there with the SL just below them, constitutes a sound trade from a Risk/ Reward ratio perspective.
On the other hand a daily closing below 13.520, technically restores the long-term bearish trend. If you are looking for a confirmed buy, perhaps it would be best to wait for the 4H RSI to break above its upper Bollinger.
--------------------------------------------------------------------------------------------------------
** Please support this idea with your likes and comments, it is the best way to keep it relevant and support me. **
--------------------------------------------------------------------------------------------------------

KCS/BTC - Resistance hit, time for some cooldown. 🤔KCS on the Bitcoin pair has hit the key resistance at 5.8k satoshi.
Now, the price is reversing and if we are to look at the USD pair (see idea below) it seems the bullish momentum may have to take a pause.
For this reason, a retest of the 5k satoshi support line may be in order before KCS can hope to break the key resistance here.
The indicators on the daily timeframe are also curving back down and may signal a local top.
Bias is short on this price action, best to be on guard here and keep a close eye on the support.
Like and follow if you like my idea!

KCS/USD - Momentum Stalling, Here's the Critical Support 😲 KuCoin token had a good rally, actually, a great one considering other coins barely bounce (hint hint at Bitcoin).
KCS almost doubled in price compared to its local bottom here, so not bad at all.
However, the momentum seems to be shifting against KCS and its price may roll over and fall lower to the key support at $14.
If the selloff will not be too aggressive I can totally see KCS hold well there before attempting to recovery again and rally.
For now, the daily MACD is curving down and may turn bearish, so it will take some time for this to play out. Volume is also terribly low.
Bias is turning bearish on this price action, but wait for Monday to get more confidence in the price action.
Like and follow if you liked this analysis!

KuCoin - CollapseI am hoping this coin can respect this area of daily supply to give a beautiful drop in price to the remaining fair value gap areas.
I will be looking for entry points on the lower time frames.

KuCoin uptrend can be expected to continue.After the break above the trendline, we might be seeing a continuation of the uptrend. Potentially, the price should be aimed at the top of the ascending channel.

KCS - Trend-Following Setup!Hello TradingView Family / Fellow Traders. This is Richard, as known as theSignalyst.
KCS rejected our green support and traded higher, so we are currently trading inside this orange channel.
As per my trading plan, I will be looking for trend-following buy setups on lower timeframes if price retests the lower orange trendline acting as a non-horizontal support.
and we will be expecting the bears to take over for a correction after retesting the upper orange/red trendlines.
Which scenario do you think is more likely to happen? Which floor is more likely to hold?
Always follow your trading plan regarding entry, risk management, and trade management.
Good luck!
All Strategies Are Good; If Managed Properly!
~Rich

KCSUSDT testing the 1D MA100, close to a major break-outThe KuCoin token (KCSUSDT) has broken since our last analysis above the 1D MA50 (blue trend-line) for the first time since April 26 2022. On top of that, the 1W MA50 (red trend-line) is now supporting. At the moment it is going for a re-test of the 1D MA100 (green trend-line) where it failed yesterday.
Perhaps the most important barrier, above which the long-term trend switches back to bullish, is the 1D MA200 (orange trend-line), which right now happens to be exactly on the Lower Highs trend-line that started after the December 01 2021 market Top.
Naturally if we get a weekly candle close above the 1D MA200, we should expect a medium-term rally towards the 28.845 Resistance (Dec 01 2021 High). If not, the Lower Highs can very well reject the price back towards the 14.500 level.
Even though the current Channel Up resembles the one that also tested the 1D MA100 back in early February, this time the price has broken above the critical 0.618 Fibonacci retracement level, making a full gap fill more probable. Also keep an eye on the 1W RSI. If it crosses above its MA (yellow line) then that also favors the bullish case on the long-term.
Overall we believe that KCSUSDT is an excellent investment on the long-term with a 10x profit potential in this Cycle.
--------------------------------------------------------------------------------------------------------
Please like, subscribe and share your ideas and charts with the community!
--------------------------------------------------------------------------------------------------------

#KCS/USDT 12Hr UPDATE !!Hello, dear traders welcome you to this KCS/USDT chart analysis.
Hello dear traders, we here new so we ask you to support our ideas with your LIKE and COMMENT, also be free to ask any question in the comments, and we will try to answer for all, thank you, guys.
KCS/USDT bullish cup and handle pattern create and retest buy the green zone and the dip.
Remember:-This is not a piece of financial advice. All investment made by me is at my own risk and I am held responsible for my own profit and losses. So, do your own research before investing in this trade.
Thanks for your time, we hope our work is good for you, and you are satisfied, we wish you a good day and big profits.
THANK YOU.

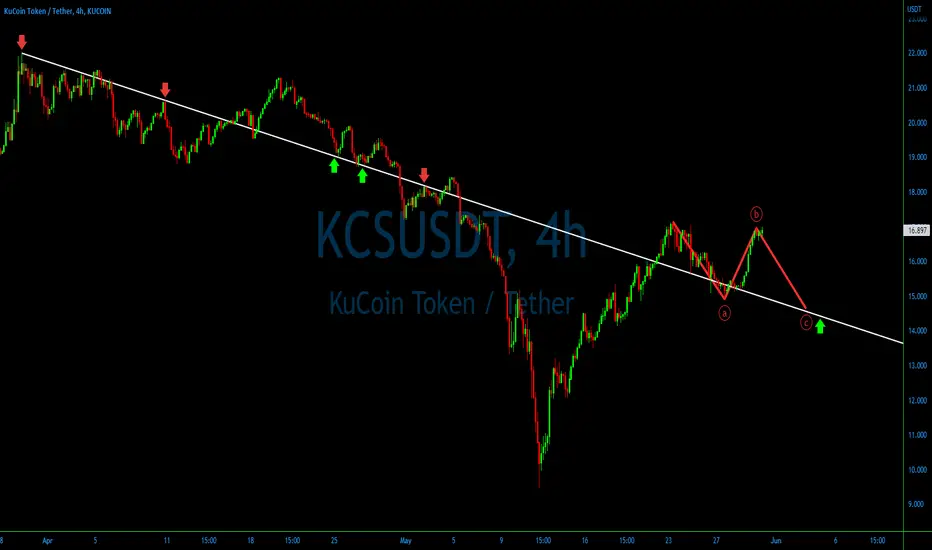
Kucoin might form an ABC corrective patternWe already see a strong recovery by KCS and this can eventually turn into an uptrend. Although as long as the recent high holds, there is a chance of an ABC corrective pattern.
KuCoin Token (KCS) - May 26hello?
Traders, welcome.
If you "follow", you can always get new information quickly.
Please also click "Like".
Have a nice day.
-------------------------------------
(KCSUSDT 1W Chart)
Below the 6.859-7.562 section: There is a possibility of entering the mid- to long-term investment area.
Above 10.230: Expected to create a new wave
(1D chart)
If it finds support above 15.880, I expect it to turn into an uptrend in the short and medium term.
However, due to the volatility of BTC, there is a possibility of temporarily touching the 13.450-14.093 section, so careful trading is required.
(buy)
- 1st buy: After confirming support at 15.880
- 2nd purchase: After confirming support near the 13.450-14.093 section
(Stop Loss)
- When it falls below 12.511
(Sell)
- When receiving resistance near 19.007
- When receiving resistance in the section 21.376-22.189
------------------------------------------------------------ -----------------------------------------------------
** All indicators are lagging indicators.
Therefore, it is important to be aware that the indicator will move accordingly as price and volume move.
However, for convenience, we are talking in reverse for the interpretation of the indicator.
** The MRHAB-T indicator used in the chart is an indicator of our channel that has not been released yet.
** The OBV indicator was re-created by applying a formula to the DepthHouse Trading indicator, an indicator disclosed by oh92. (Thanks for this.)
** Support or resistance is based on the closing price of the 1D chart.
** All descriptions are for reference only and do not guarantee a profit or loss in investment.
(Short-term Stop Loss can be said to be a point where profit and loss can be preserved or additional entry can be made through split trading. It is a short-term investment perspective.)
---------------------------------

KCSUSDT Up +80% from its Low. Levels to watch next.The KuCoin Token (KCSUSDT) has risen more than +80% since the May 12 Low. By doing so, it broke again above the 1W MA50 (red trend-line) which was the Support during the rise of 2021. Closing the week above it, strengthens the case of a market bottom.
However, we still have a set of Resistance levels to consider on the short-term. The 1D MA50 (blue trend-line) is right above but in my opinion it is the 1D MA100 (green trend-line) which is more important as during the last rebound from a Lower Low (as you see the long-term pattern is a Channel Down), it rejected the price three times. The 1D MA200 (orange trend-line) shouldn't pose much Resistance if the 1D MA100 breaks.
As a result, if we get a 1D candle close above the 1D MA100, I expect a strong extension to the 21.300 - 22.000 Resistance Zone, which has been rejecting break-out attempts since January 05 2022 and is the difference between the start of the new Bull Cycle and the extension of the current Bear Cycle. A rejection on the 1D MA100, should set in motion a new sell-off to the lower Fibonacci retracement levels.
A break above the 62.80 RSI Resistance, adds more to the bullish case.
I have to mention that overall on the long-term, I view KCSUSDT as one of the best investments in the market. The exchange is always backing the token and enriching the project with new fundamentals.
--------------------------------------------------------------------------------------------------------
Please like, subscribe and share your ideas and charts with the community!
--------------------------------------------------------------------------------------------------------

KCS/BTC - Major BREAKOUT above 5k Satoshi!!! 💪KuCoin Token has broken above 5k satoshi and exploded much higher on sustained volume!
This is a major breakout with a price not seen since 2018 vs BTC!
If momentum keeps up, KCS could challenge the all time high sitting at 15k Satoshi.
The first key resistance is found at 5.8k satoshi and then at 7.6k.
The support at 5k statoshi was not really tested, so probably price will revisit this area in case of a pullback.
Overall, a great performance from KCS and likely to continue.
Bias remains bullish on this price action and the indicators also support further uptrend.
Like and follow if you liked my idea!

KCS/USD - Full steam ahead towards $21! 🚀KuCoin Token has had a great past week with price quickly moving above $14, turning it into support and now rallying towards $21.
The momentum is bullish and the overall market is also giving signs of a significant relief rally incoming.
This may be a much needed change in the price action after two months of non stop price drop.
The daily indicators are all bullish right now, but volume appears to fade a bit. As price approaches $21, the sellers will start coming back in force and likely will do their best to defend this key resistance.
Expect to see profit taking as price approaches $21, then reassess.
For now bias remains bullish.
Like and follow if you liked my idea!

KCS is a beast!Hello TradingView Family / Fellow Traders. This is Richard, as known as theSignalyst.
The picture is self-explanatory.
As per my last KCS analysis here, we were looking for buy setups around the 10.0 as it is a strong support / round number intersection with the lower red trendline. (unless broken downward)
KCS is truly a beast, making a massive 77% correction while most altcoins (including many good projects) aren't moving much.
Now What?
The first resistance that might hold KCS down is around the upper gray zone and red trendline. so we might expect rejection from there for a correction movement before breaking that red channel upward.
of course, we will need to zoom in to lower timeframes and monitor price action to confirm the correction confirmation.
For now, we are very bullish and we can still break that upward zone from here.
Which scenario do you think is more likely to happen? Which floor is more likely to hold?
Always follow your trading plan regarding entry, risk management, and trade management.
Good luck!
All Strategies Are Good; If Managed Properly!
~Rich


KCS/BTC - A FULL reversal in a few days! 🤩KCS continues to impress with almost a full reversal from the previous lows which were tested during the 12 May crash.
Support held steady and on the BTC pair, KCS remains strong and may outperform Bitcoin if it manages to escape this large channel with a key resistance at 5k satoshi.
If successful, KCS could run and make some sustained gains against Bitcoin.
For now, KCS is making a nice recovery and indicators are slowly turning bullish. If next week KCS manages to maintain this momentum, then a test of the key resistance becomes likely.
Bias is bullish in the short term, or at least until price reaches the key resistance, then we have to reassess.
Also see below the KCS/USD pair analysis which is also bullish.
Like and follow if you liked this idea!

KCS/USD - KuCoin about to break above $14!In a sharp reversal, KCS is now approaching the $14 resistance point and will likely break it soon provided Monday does not start in red for the market.
The indicators went into oversold conditions over the last week and now recovery is likely with at least a relief rally.
Should KCS manage to break above $14, the price will enter into its old range between $14 and $21.
The bias is mildly bullish on this chart, but watch out for Monday's price action.
Continuation is likely before any serious rejection by bears.
Keep a close eye on this chart.
Like and follow if you liked this analysis!
