#KDA/USDT Stay Adaptive ?#KDA
The price is moving within a descending channel on the 1-hour frame, adhering well to it, and is on its way to breaking it strongly upwards and retesting it.
We have a bounce from the lower boundary of the descending channel. This support is at 0.4260.
We have a downtrend on the RSI indicator that is about to be broken and retested, supporting the upside.
There is a major support area in green at 0.4186, which represents a strong basis for the upside.
Don't forget a simple thing: ease and capital.
When you reach the first target, save some money and then change your stop-loss order to an entry order.
For inquiries, please leave a comment.
We have a trend to hold above the 100 Moving Average.
Entry price: 0.4530
First target: 0.4625
Second target: 0.4754
Third target: 0.4932
Don't forget a simple thing: ease and capital.
When you reach the first target, save some money and then change your stop-loss order to an entry order.
For inquiries, please leave a comment.
Thank you.
KDABTC

#KDA/USDT Stay Adaptive ! #KDA
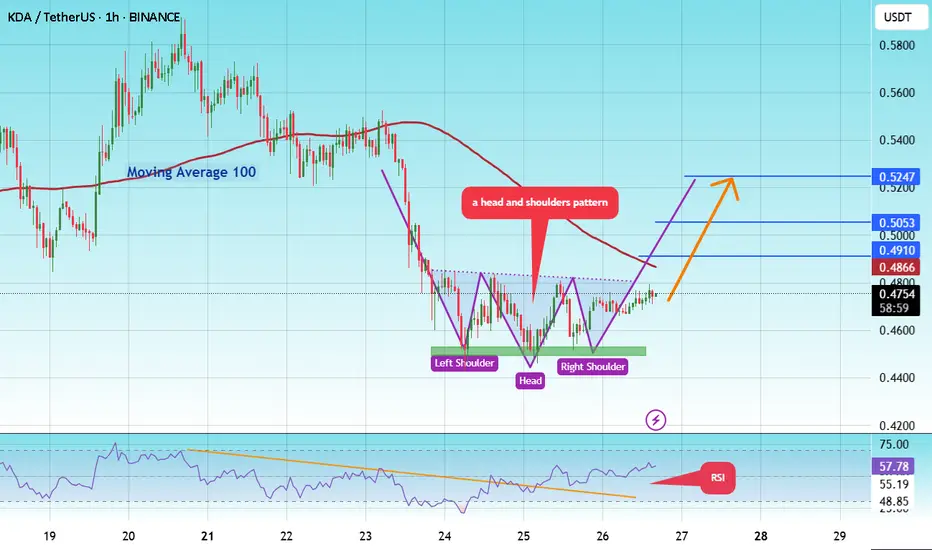
The price is moving in a head and shoulders pattern on the 1-hour frame and is expected to break and continue higher.
We have a trend to stabilize above the 100 moving average once again.
We have a bearish trend on the RSI indicator, supporting the upward move with a break above it.
We have a support area at the lower boundary of the head and shoulders at 0.4545, acting as strong support from which the price can rebound.
We have a major support area in green that pushed the price higher at 0.4490.
Entry price: 0.4747
First target: 0.4910
Second target: 0.5053
Third target: 0.5247
To manage risk, don't forget stop loss and capital management.
When you reach the first target, save some profits and then change your stop order to an entry order.
For inquiries, please comment.
Thank you.
#KDA/USDT UPDATE .#KDA
The price is moving within a descending channel on the 1-hour frame, adhering well to it, and is on its way to breaking it strongly upwards and retesting it.
We have a bounce from the lower boundary of the descending channel. This support is at 0.3665.
We have a downtrend on the RSI indicator that is about to be broken and retested, supporting the upside.
There is a major support area in green at 0.3663, which represents a strong basis for the upside.
Don't forget a simple thing: ease and capital.
When you reach the first target, save some money and then change your stop-loss order to an entry order.
For inquiries, please leave a comment.
We have a trend to hold above the 100 Moving Average.
Entry price: 0.3824
First target: 0.3909
Second target: 0.4041
Third target: 0.4195
Don't forget a simple thing: ease and capital.
When you reach the first target, save some money and then change your stop-loss order to an entry order.
For inquiries, please leave a comment.
Thank you.

#KDA/USDT#KDA
The price is moving within a descending channel on the 1-hour frame, adhering well to it, and is heading for a strong breakout and retest.
We are seeing a rebound from the lower boundary of the descending channel, which is support at 3370.
We have a downtrend on the RSI indicator that is about to be broken and retested, supporting the upward trend.
We are looking for stability above the 100 moving average.
Entry price: 0.3420
First target: 0.3526
Second target: 0.3646
Third target: 0.3800

#KDA/USDT#KDA
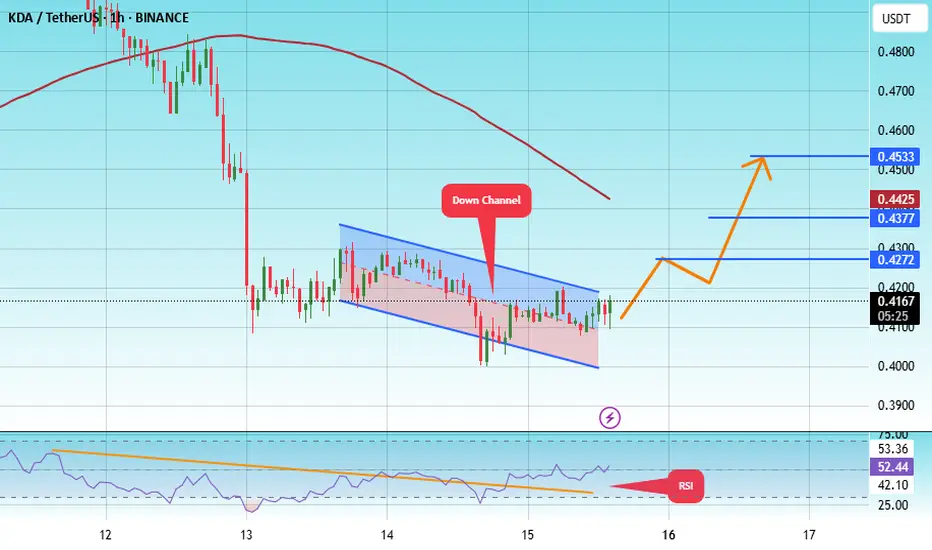
The price is moving within a descending channel on the 1-hour frame, adhering well to it, and is heading toward a strong breakout and retest.
We are experiencing a rebound from the lower boundary of the descending channel. This support is at 0.4043.
We are experiencing a downtrend on the RSI indicator, which is about to break and retest, supporting the upward trend.
We are heading toward stability above the 100 Moving Average.
Entry price: 0.4167
First target: 0.4274
Second target: 0.4377
Third target: 0.4533
#KDA/USDT#KDA
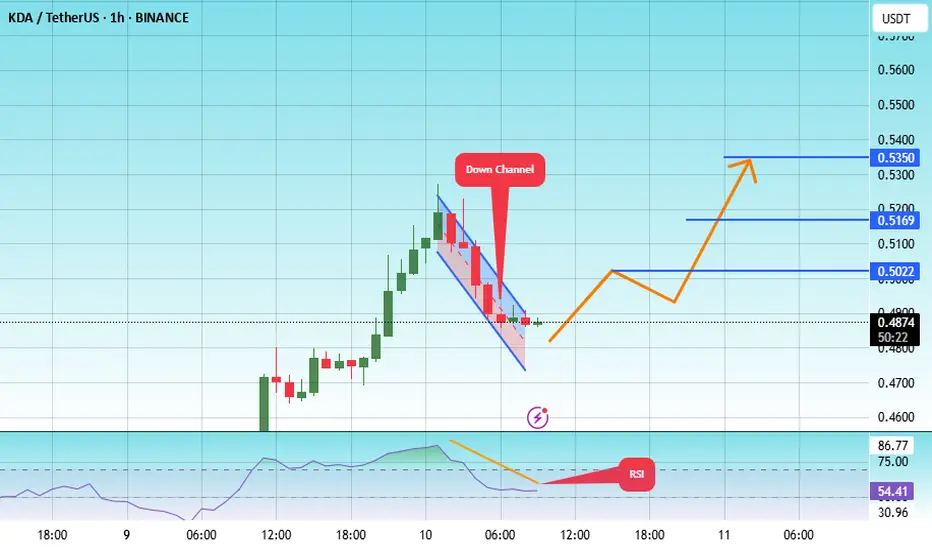
The price is moving within a descending channel on the 1-hour frame, adhering well to it, and is heading toward a strong breakout and retest.
We are experiencing a rebound from the lower boundary of the descending channel. This support is at 0.4770.
We have a downtrend on the RSI indicator that is about to be broken and retested, supporting the upward trend.
We are heading toward stability above the 100 moving average.
Entry price: 0.4887
First target: 0.5022
Second target: 0.5170
Third target: 0.5350
#KDA/USDT#KDA
The price is moving within a descending channel on the 1-hour frame, adhering well to it, and is heading for a strong breakout and retest.
We are seeing a rebound from the lower boundary of the descending channel, which is support at 0.5780.
We have a downtrend on the RSI indicator that is about to be broken and retested, supporting the upward trend.
We are looking for stability above the 100 moving average.
Entry price: 0.6033
First target: 0.6330
Second target: 0.6625
Third target: 0.7011

#KDA/USDT#KDA
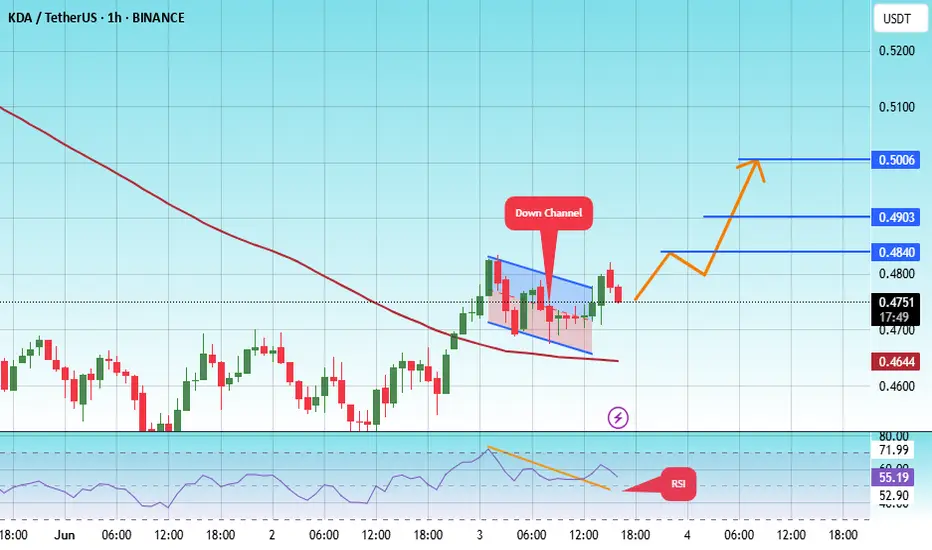
The price is moving within a descending channel on the 1-hour frame, adhering well to it, and is heading for a strong breakout and retest.
We are experiencing a rebound from the lower boundary of the descending channel. This support is at 0.4670.
We are experiencing a downtrend on the RSI indicator, which is about to break and retest, supporting the upward trend.
We are looking for stability above the 100 Moving Average.
Entry price: 0.4764
First target: 0.4840
Second target: 0.4900
Third target: 0.5000
#KDA/USDT#KDA
The price is moving within a descending channel on the 1-hour frame and is expected to break and continue upward.
We have a trend to stabilize above the 100 moving average once again.
We have a downtrend on the RSI indicator that supports the upward move with a breakout.
We have a support area at the lower limit of the channel at 0.4333, acting as strong support from which the price can rebound.
Entry price: 0.4422
First target: 0.4487
Second target: 0.4566
Third target: 0.466

#KDA/USDT#KDA
The price is moving within a descending channel on the 1-hour frame, adhering well to it, and is on its way to breaking it strongly upwards and retesting it.
We are seeing a rebound from the lower boundary of the descending channel, which is support at 0.5380.
We have a downtrend on the RSI indicator that is about to break and retest, supporting the upward trend.
We are looking for stability above the 100 moving average.
Entry price: 0.5447
First target: 0.5545
Second target: 0.5670
Third target: 0.5820

#KDA/USDT#KDA
The price is moving in a descending channel on the 1-hour frame and is adhering to it well and is heading to break it strongly upwards and retest it
We have a bounce from the lower limit of the descending channel, this support is at a price of 0.5070
We have a downtrend on the RSI indicator that is about to be broken and retested, which supports the rise
We have a trend to stabilize above the moving average 100
Entry price 0.5400
First target 0.5616
Second target 0.5782
Third target 0.60000

KDAUSDT | Be Cautious, Stay AdaptiveKDAUSDT has been navigating a tricky range, and structure seems to be shifting slowly. The red box below us now acts as a potential support area, while the green box above is shaping up to be a strong resistance zone that has halted price momentum before.
🟥 Red Box – Support Zone
This area has shown signs of buyer interest in the past. If price pulls back here and holds, it might offer a chance for a reactive bounce — especially if we see supportive signals like slowing sell volume or a low-timeframe breakout.
🟩 Green Box – Resistance Zone
The green box is a key level where sellers are currently defending. It's been tested before and failed to break cleanly, which means it’s not to be taken lightly. If you’re looking for shorts, this is the zone to watch for confirmation setups.
✅ Trading Outlook
Short bias from the green box with confirmation on lower timeframes. Let price enter the resistance and then look for weakness.
Long bias from the red box only if buyers step in with strength. A strong bounce or a reclaim with a retest could offer a low-risk entry.
Important Reminder: If either of these zones is broken and price consolidates above/below with strength, adapt accordingly. As always, I don’t insist on short ideas if the market structure shifts. If a resistance zone is reclaimed with strength, I flip to long.
Let the chart tell the story, not your emotions.
📌I keep my charts clean and simple because I believe clarity leads to better decisions.
📌My approach is built on years of experience and a solid track record. I don’t claim to know it all but I’m confident in my ability to spot high-probability setups.
📌If you would like to learn how to use the heatmap, cumulative volume delta and volume footprint techniques that I use below to determine very accurate demand regions, you can send me a private message. I help anyone who wants it completely free of charge.
🔑I have a long list of my proven technique below:
🎯 ZENUSDT.P: Patience & Profitability | %230 Reaction from the Sniper Entry
🐶 DOGEUSDT.P: Next Move
🎨 RENDERUSDT.P: Opportunity of the Month
💎 ETHUSDT.P: Where to Retrace
🟢 BNBUSDT.P: Potential Surge
📊 BTC Dominance: Reaction Zone
🌊 WAVESUSDT.P: Demand Zone Potential
🟣 UNIUSDT.P: Long-Term Trade
🔵 XRPUSDT.P: Entry Zones
🔗 LINKUSDT.P: Follow The River
📈 BTCUSDT.P: Two Key Demand Zones
🟩 POLUSDT: Bullish Momentum
🌟 PENDLEUSDT.P: Where Opportunity Meets Precision
🔥 BTCUSDT.P: Liquidation of Highly Leveraged Longs
🌊 SOLUSDT.P: SOL's Dip - Your Opportunity
🐸 1000PEPEUSDT.P: Prime Bounce Zone Unlocked
🚀 ETHUSDT.P: Set to Explode - Don't Miss This Game Changer
🤖 IQUSDT: Smart Plan
⚡️ PONDUSDT: A Trade Not Taken Is Better Than a Losing One
💼 STMXUSDT: 2 Buying Areas
🐢 TURBOUSDT: Buy Zones and Buyer Presence
🌍 ICPUSDT.P: Massive Upside Potential | Check the Trade Update For Seeing Results
🟠 IDEXUSDT: Spot Buy Area | %26 Profit if You Trade with MSB
📌 USUALUSDT: Buyers Are Active + %70 Profit in Total
🌟 FORTHUSDT: Sniper Entry +%26 Reaction
🐳 QKCUSDT: Sniper Entry +%57 Reaction
📊 BTC.D: Retest of Key Area Highly Likely
📊 XNOUSDT %80 Reaction with a Simple Blue Box!
📊 BELUSDT Amazing %120 Reaction!
I stopped adding to the list because it's kinda tiring to add 5-10 charts in every move but you can check my profile and see that it goes on..

#KDA/USDT
#KDA
The price is moving within a descending channel on the 1-hour frame, adhering well to it, and is heading for a strong breakout and retest.
We are seeing a bounce from the lower boundary of the descending channel, which is support at 0.1480.
We have a downtrend on the RSI indicator that is about to break and retest, supporting the upward trend.
We are looking for stability above the 100 moving average.
Entry price: 0.1515
First target: 0.1530
Second target: 0.1550
Third target: 0.1580

#KDA/USDT Ready to go higher#KDA
The price is moving in a descending channel on the 1-hour frame and sticking to it well
We have a bounce from the lower limit of the descending channel, this support is at 0.7788
We have a downtrend on the RSI indicator that is about to be broken, which supports the rise
We have a trend to stabilize above the moving average 100
Entry price 0.7956
First target 0.8427
Second target 0.8977
Third target 0.9515

#KDA/USDT#KDA
The price is moving in a descending channel on the 1-hour frame and is adhering to it well and is heading to break it strongly upwards and retest it
We have a bounce from the lower limit of the descending channel, this support is at a price of 0.4450
We have a downtrend on the RSI indicator that is about to break and retest, which supports the rise
We have a trend to stabilize above the moving average 100
Entry price 0.4730
First target 0.4872
Second target 0.5036
Third target 0.5266

#KDA/USDT#KDA
The price is moving in a descending channel on the 1-hour frame and is expected to continue upwards
We have a trend to stabilize above the moving average 100 again
We have a descending trend on the RSI indicator that supports the rise by breaking it upwards
We have a support area at the lower limit of the channel at a price of 0.7940
Entry price 0.8066
First target 0.8320
Second target 0.8718
Third target 0.9149

#KDA/USDT Ready to go higher#KDA
The price is moving in a descending channel on the 1-hour frame and sticking to it well
We have a bounce from the lower limit of the descending channel, this support is at 0.9500
We have a downtrend on the RSI indicator that is about to be broken, which supports the rise
We have a trend to stabilize above the moving average 100
Entry price 0.9613
First target 0.9943
Second target 1.03
Third target 1.07

KDAUSDT: Will the Bulls Hold the Line, or Are We Headed Lower? Yello, Paradisers! Are we about to see a strong bounce or a deeper drop for Kadena (KDA)? The chart is heating up, and it’s time to pay close attention to these critical levels as we approach a make-or-break moment.
💎#KDAUSDT is raising the high probability of bullish continuation from the key support zone at $0.9342–$1.0102, which is currently holding as a vital barrier for the bulls. If this level continues to act as a floor, we could see a reversal back toward $1.2951–$1.4623, where significant resistance awaits. A clean breakout above this resistance could spark a bullish rally, with the next targets around $1.50 and $1.80. However, without strong buying pressure, the upward momentum may stall.
💎On the downside, if the $0.9342 support fails, the demand zone at $0.6569–$0.7518 will come into play. This area has historically attracted buyers and could act as a temporary safety net. Still, a sustained breakdown below this zone would expose KDA to deeper losses, with the potential to drop to $0.50 or lower.
💎The RSI is neutral but leaning toward oversold territory, which may suggest a potential bounce. Meanwhile, the MACD is signaling weak momentum but could flip bullish if the price holds or climbs above $0.9342.
💎This is a decisive moment for KDA. Whether it’s a bounce or a breakdown, volatility is expected in the coming days. Stay patient and disciplined, waiting for clear confirmation before making your move.
Stay focused and trade smart!
MyCryptoParadise
iFeel the success🌴

#KDA/USDT Ready to go higher#KDA
The price is moving in a descending channel on the 1-hour frame and sticking to it well
We have a bounce from the lower limit of the descending channel, this support is at 1.06
We have a downtrend on the RSI indicator that is about to be broken, which supports the rise
We have a trend to stabilize above the 100 moving average
Entry price 1.12
First target 1.18
Second target 1.30
Third target 1.40

#KDA/USDT#KDA
The price is moving in a descending channel on the 4-hour frame and is sticking to it well
We have a bounce from the lower limit of the descending channel and we are now touching this support at a price of 0.520
We have a downtrend on the RSI indicator that is about to be broken, which supports the rise
We have a trend to stabilize above the moving average 100
Entry price 0.530
First target 0.543
Second target 0.560
Third target 0.581

#KDA/USDT#KDA
We have a descending channel pattern on the 4-hour frame, the price is moving inside it and adhering to its borders well
We have a support area in green at a price of 0.500 after the price touched it and rebounded from it
We have a trend to stabilize above the moving average 100
We have a downtrend on the RSI indicator that supports the price upwards
Entry price 0.580
First target 0.684
Second target 0.76
Third target 0.833

#KDA/USDT#KDA
We have a bullish channel pattern on a 12-hour frame, the price moves within it and adheres to its limits well
We have a green support area at 0.750
We have a tendency to stabilize above moving average 100
We have an uptrend on the RSI indicator that supports the price higher
Entry price is 0.820
The first goal is 0.900
The second goal is 0.990
the third goal is 1.085
