#KDA/USDT Stay Adaptive ?#KDA
The price is moving within a descending channel on the 1-hour frame, adhering well to it, and is on its way to breaking it strongly upwards and retesting it.
We have a bounce from the lower boundary of the descending channel. This support is at 0.4260.
We have a downtrend on the RSI indicator that is about to be broken and retested, supporting the upside.
There is a major support area in green at 0.4186, which represents a strong basis for the upside.
Don't forget a simple thing: ease and capital.
When you reach the first target, save some money and then change your stop-loss order to an entry order.
For inquiries, please leave a comment.
We have a trend to hold above the 100 Moving Average.
Entry price: 0.4530
First target: 0.4625
Second target: 0.4754
Third target: 0.4932
Don't forget a simple thing: ease and capital.
When you reach the first target, save some money and then change your stop-loss order to an entry order.
For inquiries, please leave a comment.
Thank you.
KDAUSD

#KDA/USDT Stay Adaptive ! #KDA
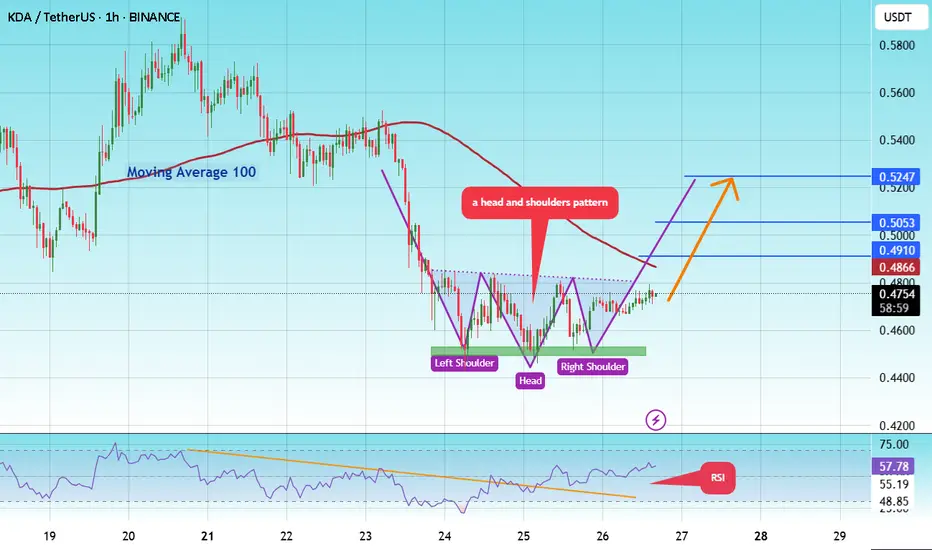
The price is moving in a head and shoulders pattern on the 1-hour frame and is expected to break and continue higher.
We have a trend to stabilize above the 100 moving average once again.
We have a bearish trend on the RSI indicator, supporting the upward move with a break above it.
We have a support area at the lower boundary of the head and shoulders at 0.4545, acting as strong support from which the price can rebound.
We have a major support area in green that pushed the price higher at 0.4490.
Entry price: 0.4747
First target: 0.4910
Second target: 0.5053
Third target: 0.5247
To manage risk, don't forget stop loss and capital management.
When you reach the first target, save some profits and then change your stop order to an entry order.
For inquiries, please comment.
Thank you.
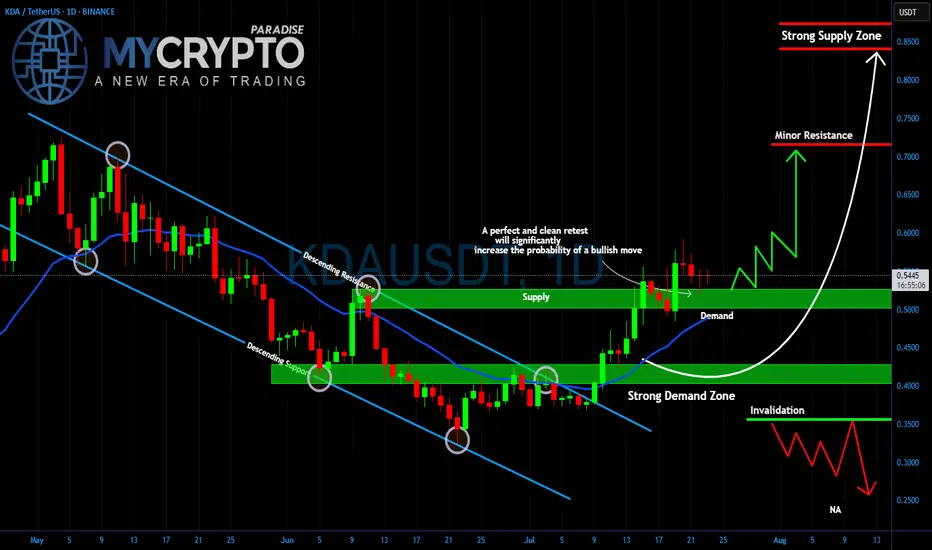
KDA Breakout or Fakeout? Critical Retest AheadYello Paradisers, is #KDA setting up for a major bullish move, or are we looking at another trap designed to wipe out impatient traders? The price has broken out of the descending channel that has been controlling the market for weeks, and now all eyes are on the retest.
💎The strong demand zone around $0.40–0.45 has been the key accumulation area for weeks, holding firmly every time the price dipped. Right now, #KDAUSDT is trading above the $0.50–0.55 demand level, which is acting as a critical support. A clean and confirmed retest of this zone would dramatically increase the probability of a bullish continuation.
💎If buyers step in aggressively, the first target will be the minor resistance at $0.70. Breaking above that could open the way for a push toward the strong supply zone at $0.85, where heavy selling pressure is expected. But if the demand fails and price drops below $0.35, this bullish scenario is invalidated, and a deeper move towards $0.25 becomes likely.
Trade smart, Paradisers. This game rewards patience and discipline, not reckless entries. Stick to your strategy, and you will stay ahead of the herd.
MyCryptoParadise
iFeel the success🌴
#KDA/USDT UPDATE .#KDA
The price is moving within a descending channel on the 1-hour frame, adhering well to it, and is on its way to breaking it strongly upwards and retesting it.
We have a bounce from the lower boundary of the descending channel. This support is at 0.3665.
We have a downtrend on the RSI indicator that is about to be broken and retested, supporting the upside.
There is a major support area in green at 0.3663, which represents a strong basis for the upside.
Don't forget a simple thing: ease and capital.
When you reach the first target, save some money and then change your stop-loss order to an entry order.
For inquiries, please leave a comment.
We have a trend to hold above the 100 Moving Average.
Entry price: 0.3824
First target: 0.3909
Second target: 0.4041
Third target: 0.4195
Don't forget a simple thing: ease and capital.
When you reach the first target, save some money and then change your stop-loss order to an entry order.
For inquiries, please leave a comment.
Thank you.

If you bought Kadena last cycle...you have to be DCA'ing in this zone, to give yourself a chance to exit with some gains in the upcoming pump.

KDA/USDT – Major Reversal Brewing from Multi-Year Demand Zone?🔍 Technical Breakdown – Weekly Timeframe
Kadena (KDA) is currently trading at a make-or-break level after months of persistent downtrend. The price is revisiting a historical multi-year demand zone between $0.31 - $0.45, an area that previously acted as a launchpad for major rallies.
This range has consistently attracted buyers, forming a strong base of accumulation, as observed in mid-2021 and mid-2022. Now, once again, KDA is testing this critical zone — and all eyes are on whether it will spark the next impulsive leg up.
🧠 Pattern Structure:
Price has formed a potential Triple Bottom / Rounded Accumulation pattern on the weekly chart.
Strong bullish divergence is visible (if confirmed by RSI or MACD).
Long-term sideways consolidation hints at phase of accumulation, common before breakout rallies.
A clean break above local resistance zones may trigger a multi-level Fibonacci extension rally.
🟢 Bullish Scenario:
If price holds and confirms a rebound from this yellow demand box, watch for a bullish breakout with the following key resistance targets:
1. 🔹 $0.6277 – Minor local resistance
2. 🔹 $0.8354 – Former swing high (early 2024)
3. 🔹 $1.1000 – Psychological & structural level
4. 🔹 $1.3567 – Weekly resistance
5. 🔹 $1.7615 – Medium-term target zone
💥 Extension Targets for Macro Bulls:
$5.5285 – Previous major high
$7.6381 – Major resistance from 2022
$15.3227 and $21.9739 – Long-term fib levels from all-time high retracement
✅ Bullish confirmation requires a weekly close above $1.10 with rising volume and higher highs.
🔴 Bearish Scenario:
If price closes below $0.31 with strong bearish momentum:
Expect continuation of macro downtrend.
No strong support structure below; risk of falling into uncharted territory or sub-$0.20 levels.
Breakdown could lead to capitulation and extended bear phase.
⚠️ Manage risk accordingly. Invalidating the current demand zone could shift the entire structure to a distribution model.
📊 Market Psychology & Volume Profile Insight
Extended sideways action and low volatility can signal the end of bearish momentum.
A breakout from this long-term base often leads to explosive upside as weak hands are flushed out.
Volume spikes near the bottom zones indicate smart money accumulation.
🧭 Strategic Note for Traders:
This setup offers a high reward-to-risk ratio, especially for swing and position traders. Early entry within the accumulation zone with tight stop-loss (below $0.30) could provide a golden opportunity — but only if confirmed with volume and price strength.
#KDAUSDT #Kadena #CryptoBreakout #AltcoinAnalysis #TechnicalAnalysis #SupportAndResistance #TripleBottom #BullishSetup #CryptoSignals #AccumulationPhase

#KDA/USDT#KDA
The price is moving within a descending channel on the 1-hour frame, adhering well to it, and is heading for a strong breakout and retest.
We are seeing a rebound from the lower boundary of the descending channel, which is support at 3370.
We have a downtrend on the RSI indicator that is about to be broken and retested, supporting the upward trend.
We are looking for stability above the 100 moving average.
Entry price: 0.3420
First target: 0.3526
Second target: 0.3646
Third target: 0.3800

KDAUSDT 1W Analysis KDA ~ 1W Analysis
#KDA This is the lowest support for now. Buy if you still have confidence in this coin with a short term target of at least 15%+ from this support.

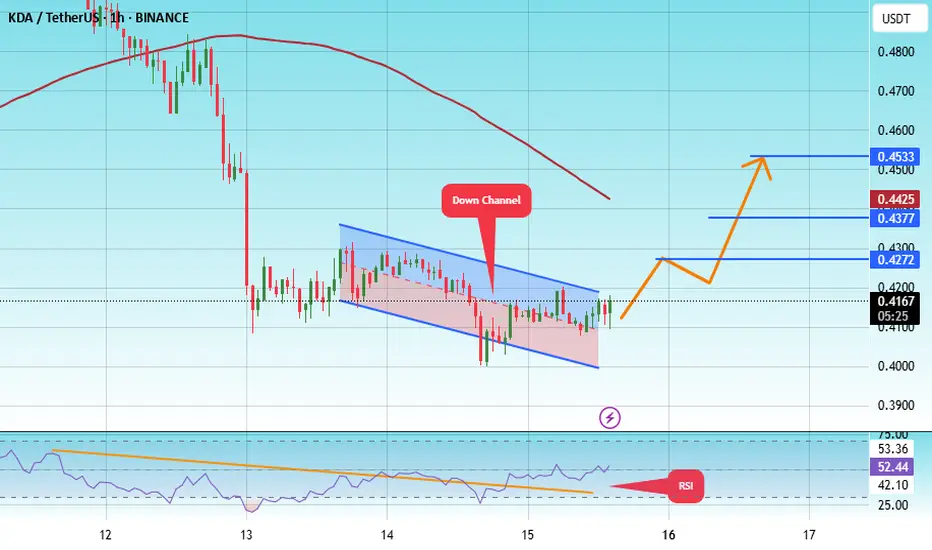
#KDA/USDT#KDA
The price is moving within a descending channel on the 1-hour frame, adhering well to it, and is heading toward a strong breakout and retest.
We are experiencing a rebound from the lower boundary of the descending channel. This support is at 0.4043.
We are experiencing a downtrend on the RSI indicator, which is about to break and retest, supporting the upward trend.
We are heading toward stability above the 100 Moving Average.
Entry price: 0.4167
First target: 0.4274
Second target: 0.4377
Third target: 0.4533
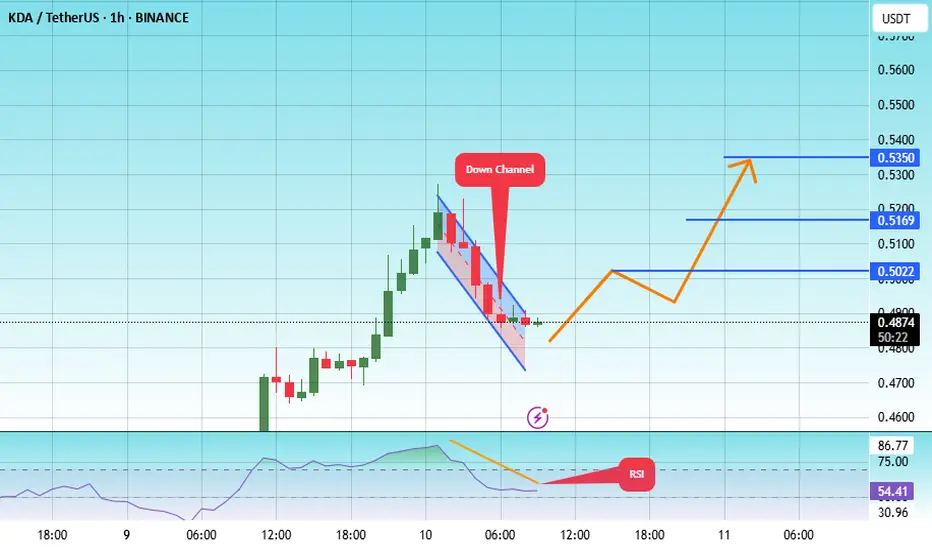
#KDA/USDT#KDA
The price is moving within a descending channel on the 1-hour frame, adhering well to it, and is heading toward a strong breakout and retest.
We are experiencing a rebound from the lower boundary of the descending channel. This support is at 0.4770.
We have a downtrend on the RSI indicator that is about to be broken and retested, supporting the upward trend.
We are heading toward stability above the 100 moving average.
Entry price: 0.4887
First target: 0.5022
Second target: 0.5170
Third target: 0.5350
#KDA/USDT#KDA
The price is moving within a descending channel on the 1-hour frame, adhering well to it, and is heading for a strong breakout and retest.
We are seeing a rebound from the lower boundary of the descending channel, which is support at 0.5780.
We have a downtrend on the RSI indicator that is about to be broken and retested, supporting the upward trend.
We are looking for stability above the 100 moving average.
Entry price: 0.6033
First target: 0.6330
Second target: 0.6625
Third target: 0.7011

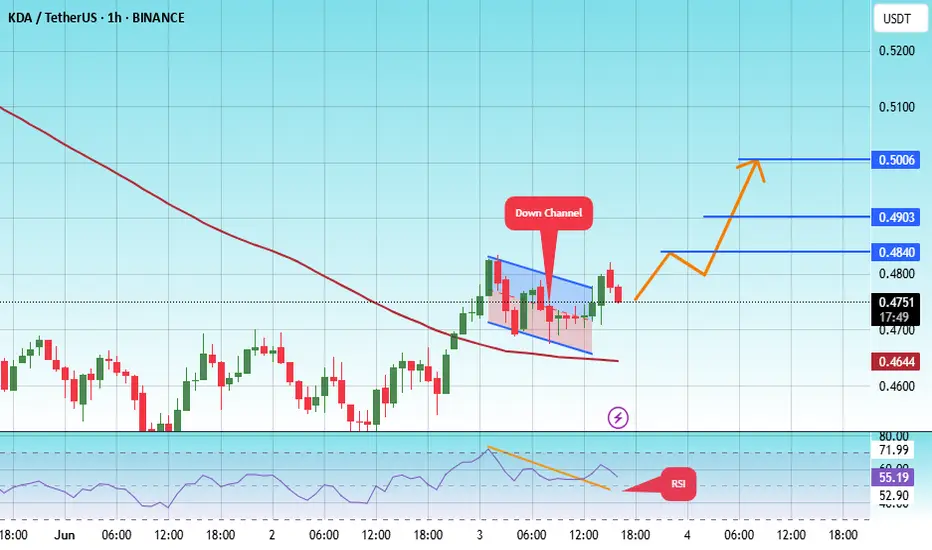
#KDA/USDT#KDA
The price is moving within a descending channel on the 1-hour frame, adhering well to it, and is heading for a strong breakout and retest.
We are experiencing a rebound from the lower boundary of the descending channel. This support is at 0.4670.
We are experiencing a downtrend on the RSI indicator, which is about to break and retest, supporting the upward trend.
We are looking for stability above the 100 Moving Average.
Entry price: 0.4764
First target: 0.4840
Second target: 0.4900
Third target: 0.5000
#KDA/USDT#KDA
The price is moving within a descending channel on the 1-hour frame and is expected to break and continue upward.
We have a trend to stabilize above the 100 moving average once again.
We have a downtrend on the RSI indicator that supports the upward move with a breakout.
We have a support area at the lower limit of the channel at 0.4333, acting as strong support from which the price can rebound.
Entry price: 0.4422
First target: 0.4487
Second target: 0.4566
Third target: 0.466

#KDA/USDT#KDA
The price is moving within a descending channel on the 1-hour frame, adhering well to it, and is on its way to breaking it strongly upwards and retesting it.
We are seeing a rebound from the lower boundary of the descending channel, which is support at 0.5380.
We have a downtrend on the RSI indicator that is about to break and retest, supporting the upward trend.
We are looking for stability above the 100 moving average.
Entry price: 0.5447
First target: 0.5545
Second target: 0.5670
Third target: 0.5820

#KDA/USDT#KDA
The price is moving in a descending channel on the 1-hour frame and is adhering to it well and is heading to break it strongly upwards and retest it
We have a bounce from the lower limit of the descending channel, this support is at a price of 0.5070
We have a downtrend on the RSI indicator that is about to be broken and retested, which supports the rise
We have a trend to stabilize above the moving average 100
Entry price 0.5400
First target 0.5616
Second target 0.5782
Third target 0.60000

KDAUSDT | Be Cautious, Stay AdaptiveKDAUSDT has been navigating a tricky range, and structure seems to be shifting slowly. The red box below us now acts as a potential support area, while the green box above is shaping up to be a strong resistance zone that has halted price momentum before.
🟥 Red Box – Support Zone
This area has shown signs of buyer interest in the past. If price pulls back here and holds, it might offer a chance for a reactive bounce — especially if we see supportive signals like slowing sell volume or a low-timeframe breakout.
🟩 Green Box – Resistance Zone
The green box is a key level where sellers are currently defending. It's been tested before and failed to break cleanly, which means it’s not to be taken lightly. If you’re looking for shorts, this is the zone to watch for confirmation setups.
✅ Trading Outlook
Short bias from the green box with confirmation on lower timeframes. Let price enter the resistance and then look for weakness.
Long bias from the red box only if buyers step in with strength. A strong bounce or a reclaim with a retest could offer a low-risk entry.
Important Reminder: If either of these zones is broken and price consolidates above/below with strength, adapt accordingly. As always, I don’t insist on short ideas if the market structure shifts. If a resistance zone is reclaimed with strength, I flip to long.
Let the chart tell the story, not your emotions.
📌I keep my charts clean and simple because I believe clarity leads to better decisions.
📌My approach is built on years of experience and a solid track record. I don’t claim to know it all but I’m confident in my ability to spot high-probability setups.
📌If you would like to learn how to use the heatmap, cumulative volume delta and volume footprint techniques that I use below to determine very accurate demand regions, you can send me a private message. I help anyone who wants it completely free of charge.
🔑I have a long list of my proven technique below:
🎯 ZENUSDT.P: Patience & Profitability | %230 Reaction from the Sniper Entry
🐶 DOGEUSDT.P: Next Move
🎨 RENDERUSDT.P: Opportunity of the Month
💎 ETHUSDT.P: Where to Retrace
🟢 BNBUSDT.P: Potential Surge
📊 BTC Dominance: Reaction Zone
🌊 WAVESUSDT.P: Demand Zone Potential
🟣 UNIUSDT.P: Long-Term Trade
🔵 XRPUSDT.P: Entry Zones
🔗 LINKUSDT.P: Follow The River
📈 BTCUSDT.P: Two Key Demand Zones
🟩 POLUSDT: Bullish Momentum
🌟 PENDLEUSDT.P: Where Opportunity Meets Precision
🔥 BTCUSDT.P: Liquidation of Highly Leveraged Longs
🌊 SOLUSDT.P: SOL's Dip - Your Opportunity
🐸 1000PEPEUSDT.P: Prime Bounce Zone Unlocked
🚀 ETHUSDT.P: Set to Explode - Don't Miss This Game Changer
🤖 IQUSDT: Smart Plan
⚡️ PONDUSDT: A Trade Not Taken Is Better Than a Losing One
💼 STMXUSDT: 2 Buying Areas
🐢 TURBOUSDT: Buy Zones and Buyer Presence
🌍 ICPUSDT.P: Massive Upside Potential | Check the Trade Update For Seeing Results
🟠 IDEXUSDT: Spot Buy Area | %26 Profit if You Trade with MSB
📌 USUALUSDT: Buyers Are Active + %70 Profit in Total
🌟 FORTHUSDT: Sniper Entry +%26 Reaction
🐳 QKCUSDT: Sniper Entry +%57 Reaction
📊 BTC.D: Retest of Key Area Highly Likely
📊 XNOUSDT %80 Reaction with a Simple Blue Box!
📊 BELUSDT Amazing %120 Reaction!
I stopped adding to the list because it's kinda tiring to add 5-10 charts in every move but you can check my profile and see that it goes on..

#KDA/USDT
#KDA
The price is moving within a descending channel on the 1-hour frame, adhering well to it, and is heading for a strong breakout and retest.
We are seeing a bounce from the lower boundary of the descending channel, which is support at 0.1480.
We have a downtrend on the RSI indicator that is about to break and retest, supporting the upward trend.
We are looking for stability above the 100 moving average.
Entry price: 0.1515
First target: 0.1530
Second target: 0.1550
Third target: 0.1580

KDAUSDT 1WKDA ~ 1W Analysis
#KDA This is the lowest support for now, maybe you can consider to start buying back from here with a short -term target of at least 15%+ from here.

#KDA/USDT Ready to go higher#KDA
The price is moving in a descending channel on the 1-hour frame and sticking to it well
We have a bounce from the lower limit of the descending channel, this support is at 0.7788
We have a downtrend on the RSI indicator that is about to be broken, which supports the rise
We have a trend to stabilize above the moving average 100
Entry price 0.7956
First target 0.8427
Second target 0.8977
Third target 0.9515

KDAUSDT 1WKDA ~ 1W Analysis
#KDA Buy gradually from here with a short -term target of at least 20%+. This is the lowest support for now.

#KDA/USDT#KDA
The price is moving in a descending channel on the 1-hour frame and is adhering to it well and is heading to break it strongly upwards and retest it
We have a bounce from the lower limit of the descending channel, this support is at a price of 0.4450
We have a downtrend on the RSI indicator that is about to break and retest, which supports the rise
We have a trend to stabilize above the moving average 100
Entry price 0.4730
First target 0.4872
Second target 0.5036
Third target 0.5266

KDAUSDT 1WKDA ~ 1W Analysis
#KDA This is the lowest support block for now. Buy from here if you still have a Conviction on this coin with a minimum target of 20%+.

#KDA/USDT#KDA
The price is moving in a descending channel on the 1-hour frame and is expected to continue upwards
We have a trend to stabilize above the moving average 100 again
We have a descending trend on the RSI indicator that supports the rise by breaking it upwards
We have a support area at the lower limit of the channel at a price of 0.7940
Entry price 0.8066
First target 0.8320
Second target 0.8718
Third target 0.9149
