KDAUSDT Good PotentialKDAUSDT Technical Analysis Update
KDA's price is approaching the upper trendline of its descending channel and is currently trading above the 100 and 200 EMA. Trading volume is gradually increasing on the daily chart. If the price breaks out of the descending channel, we can expect a significant upward move in KDA.
Buy Level: Below $0.65
Stop Loss:0.54
Regards
Hexa
Kdausdtbuy


KDA showing a very impressive investment opportunityHi Everyone;
today we have one of the best risk to reward Investment opportunity
it is more than 1880 times the risk and the chart is look very promising.
I expect breaking the previous bear market key point will clear the way to the final target

Kadena (KDA) almost formed bullish Gartley for upto 21% pumpHi dear friends, hope you are well and welcome to the new trade setup of Kadena (KDA).
Previously we caught a nice trade of KDA as below:
Now on a 4-hr time frame, KDA with Bitcoin pair has almost formed a bullish Gartley move for another price reversal.
Note: Above idea is for educational purpose only. It is advised to diversify and strictly follow the stop loss, and don't get stuck with trade.

Kadena (KDA) formed bullish Gartley for upto 28% pump soonHi dear friends, hope you are well and welcome to the new trade setup of Kadena ( KDA ) with US Dollar pair.
Recently we caught nice trade of KDA as below:
Now on a 4-hr time frame, KDA has formed a bullish Gartley pattern for another price reversal move.
Note: Above idea is for educational purpose only. It is advised to diversify and strictly follow the stop loss, and don't get stuck with trade

KDAUSDT sk analysis buying 12/7/2022market almost reach our white correction LVL buying area and our target is the purple correction LVL

KDAUSDT analysis buy signal 28/11/2022Market is on our green WCL buying area for the green sequence , our target is blue correction LVL for the bearish move RR 6:1

KDAUSDT analysis buying signal crypto 11/8/2022the only buying setup available in this market is by breaking the orange corrective bearish wave and activate the white BC correction area for the white sequence

KDAUSDT analysis buying signal crypto Market in our green buying area (BC) area for the green sequence ICI sequence RR:2.9:1

KDAUSDT analysis crypto scenarioMarket in our orange target for the bearish sequence bearing in mind that market price is bo low so it is good zone for buyinfg setup also with the break (blue arrow ) we can repeat the buying setup again if the market move with our scenario

KDAUSDT analysis crypto scenariothe only buying setup for this market is to reach our blue circle area as this will apply the white sequence braking the red corrective bullish sequence

KDAUSDT sk analysis buying signalMarket on our way to BC red correction lvl our buying zone with good potential for bulls wave with RR :2.75:1 bearing in mind that the market respect the gray correction LVL for the bears wave

KdaKda is so great
for Scalpers enjoy.
Buy some and hold
your stop is when BTC breaks 19700
Goodluck

KDABTCKDA looks good and I think we can trust it and publicly we see a positive movement in the coming days

#KDA broke its 1h trendline Hello #SorooshSchool Guys ,
As you can see in the chart , #kadena broke the dynamic resistant and pumped more than 8%
targets are available in the chart after retest and confirmation
Do not forget like and share this idea if it is useful analysis for you
Have a perfect day

kda/usdt KDA i see the 1 $ - 1.2 $ The best buying zone you can accumulate from this lvl target 5.5- 7 $ Good luck everyone

KDA/USDT HAS POTENTIAL TO PUMP 120%!! Hi guys, This is CryptoMojo, One of the most active trading view authors and fastest-growing communities.
Do consider following me for the latest updates and Long /Short calls on almost every exchange.
I post short mid and long-term trade setups too.
Let’s get to the chart!
I have tried my best to bring the best possible outcome in this chart, Do not consider it as financial advice.
Welcome to this KDA/USDT update. KDA looks very promising here.
KDA is making this falling wedge pattern in a 3-day timeframe a currently retesting it.
Long KDA/USDT
Entry range:- CMP
Target:- 120%
SL:- $1.3
This chart is likely to help you in making better trade decisions if it did consider upvoting this chart.
Would also love to know your charts and views in the comment section.
Thank you

KdaUsdA quick analyze for Kadena
We can say we are changing our direction from down trend to up trend as the chart showing " breaking the down trend for RSI and Chart "
If You like Our Idea Please SHow Some Love " Like and follow me For More Signals "

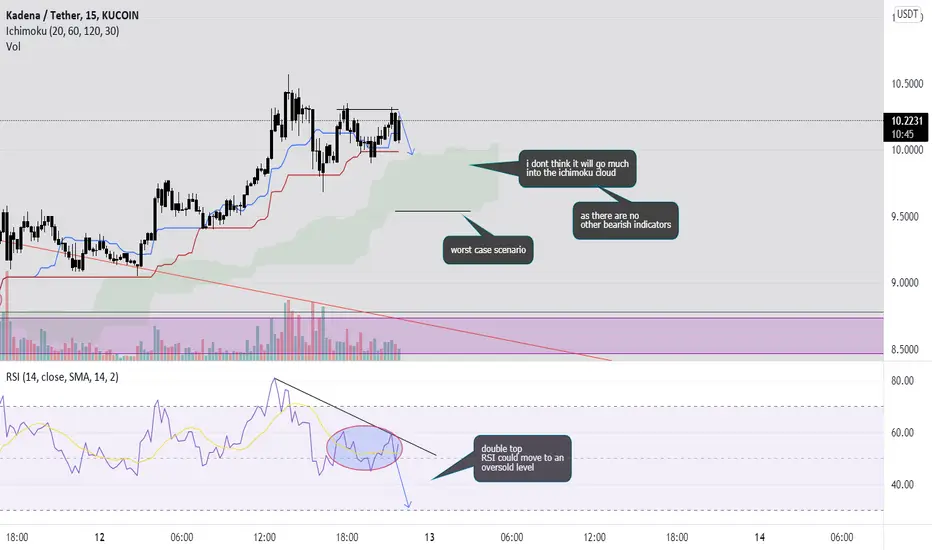
KDA/USDT 15m timeframe- double top on the 15m chart
- i dont think KDA will drop that much as there are no other bearish indicators
- worst case scenario is KDA drops to the bottom of the ichimoku cloud
- double top on the RSI, could move to an oversold level (below 30) which would be bullish
KDA/USDT on a 15m chart- double top
- bearish TK cross
- large gap in between the conversion line & base line = bearish
- support around $9.7 may break as its been tested a number of times in the past, however if this does break a support at $8.7 will hold
- thx to BTC for this retracement, also BTC to $42.5k


Kadena Longkda broke out its channel it retested my 78.6 fib my long term target is the -68 on the fib

#KDA $5 or $40 ?#KDA is in downtrend and try to break out the triangle and dynamic resistance at the area of 11-12. #KADENA needs to break out the strong resistance at the area of 14 to change to trend
Next important support and key levels of #KDA are 8 and 5.5
Of market drop and start correcting, you should pay attention to those two important supporting levels as entry points
Good luck
