USD/CAD FALSE BREAKOUT AND CLEAR DIVERGENCECanada's inflation rate stays at an 18-year high of 4.7% on Wednesday. The data point released by Statistics Canada on Wednesday morning was in line with economist expectations, tying October's level, which was the highest inflation rate since 2003. Inflation rates are soaring around the world right now, as the combination of record government spending, supply chain disruptions, and a surge in demand for consumer goods has caused prices to rise quickly.
USD/CAD is currently at a 3-month high level and on a key resistance level. Also, it is on a few spots before 1.3000. Yesterday the currency pair makes a fall breakout of the key resistance level and close below 1.2882. The traders' sentiment stays unchanged and more bulls on the market are prevail but the bears are waiting to see how the price will react from these levels. On a daily chart, they notified clear bearish divergence confirmed on MACD and RSI oscillator indicators.
If the price drop below 1.2754 it would be a clear signal that the bearish divergence is confirmed and probably more bears would be activated on the market. If the price starts to fall it can reach price levels around 1.2625 or lower to the key support around 1.2300. If this level doesn’t stop the price from falling we can see the drop to the key psychological support level around 1.2000.
If the bull sentiment on the market remains unchanged and the price break through the current price level again and stay above, it is possible to see the 1.3000 level be reached very soon.
Risk Disclosure: Trading Foreign Exchange (Forex) and Contracts of Difference (CFD's) carry a high-risk level. By registering and signing up, any client affirms their understanding of their own personal accountability for all transactions performed within their account and recognizes the risks associated with trading on such markets and such sites. Furthermore, one understands that the company carries zero influence over transactions, needs, and trading signals. Therefore, it cannot be held liable nor guarantee any profits or losses.
Keylevel

EURJPY Bullish swingEURJPY has been in a bearish correction as we can see on the WEEKLY time frame, breaking the the previous LL, where liquidity was located.
Price is close getting closer to our POI (Point of Interest) 126.300 where is the bullish institutional candle that concord with the weekly HL support zone.
If the bullish rally take place I would look to take Profit on TP1_136.700 or TP2_132.00

A divergence signal appeared with EURNZDH1 time frame.
Structure: Uptrend.
A divergence signal appeared with the MACD and Key level at 1.65000.
Wait for the price to break the Key level and have a signal to confirm the downtrend, then you can find a selling opportunity.
The profit target is the 1.63500 and 1.60500 price zone.
-----------------------------------------------------------------------------------------------
Wish you all have a good trading day!

Sell EURNZD nowSell EURNZD now after it has Right - Head- Shoulder model and broken the up trend line
EURNZD
TYPE : SELL
TF : H2
ENTRY PRICE : 1.6600
STOP LOSS : 1.6686 (86 PIPS)
TAKE PROFIT : TP1: 1.6580 TP2: 1.6540 TP3: 1.6480 TP4: 1.6400 TP5: 1.6325

Wait for a bearish reversal signal with USDJPYH4 time frame.
Structure: The uptrend was broken at Key level 113,000.
The price is retracing to the 50-61 Fibo zone of the previous down move.
At the price range of 114,000 - 114,400, waiting for a bearish reversal pattern to form, there may be selling opportunities.
Profit target is the price zone 111,700.
-----------------------------------------------------------------------------------------------
Wish you all have a good trading day!

BREAKDOWN ON THE NASDAQ100Whats up guys, I hope everyone is doing well. In this video I make a breakdown of possible opportunities on the nasdaq100 and we also take a look at how we can identify key levels also catch a trend as it unfolds. Hope you finds this content useful and I will see you in the next video. Stay tuned!
Good Luck.
God Bless!

Divergence and buying opportunity with CADJPYH1 time frame.
Structure: Downtrend.
At the support zone of 88.000, there is a divergence signal.
The current price has broken the Key level at 89.000.
Wait for the confirmation retest signal to appear, then you can find buying opportunities.
The profit target is the 90.500 price zone.
-----------------------------------------------------------------------------------------------
Wish you all have a good trading day!

Key level broken and selling opportunity with EURCADH1 time frame.
Structure: The uptrend was broken when the price broke the Key Level at 1.44000.
Wait for the price to retrace to form a retest at 1.44500 and give a sell signal, then you can find a selling opportunity with EURCAD.
The profit target is the 1.43000 and 1.41600 price zone.
-----------------------------------------------------------------------------------------------
Wish you all have a good trading day!

Avalanche Key Level To HoldWelcome to this analysis about AVAVLANCHE and the weekly timeframe perspectives.
AVAX is currently holding 80$ as supports on weekly time frame. But due to recent sell off in BITCOIN AVAX lost 1.272. I think we might another leg down Between 60-70$ zone.

Wait for the breakout signal and buying opportunity with EURCADH1 time frame.
Structure: Uptrend.
The price is currently moving in the sideway from 1.44000 to 1.45500 and retesting the Key level of the previous downtrend.
Wait for the price to confirm a rise above 1.45500 and appear bullish continuation candlestick patterns, then you can find buying opportunities.
The profit target is the 1.47700 price zone.
-----------------------------------------------------------------------------------------------
Wish you all have a good trading day!

XAUUSD Possible SHORT (30min TF)XAUUSD is trading downward
Its currently testing key level
Oscillator currently showing bearish momentum forming.
I'm entering shorts if price trades below level after retest.
SELL!

US30 Possible SHORT (30min TF)US30 is trading downward
It looks like its going in to retest key levels.
I'm entering shorts if candlestick trades below levels after retest.
SELL!

AUDUSD: BEARISH CHANNELING, SELL OPPORTUNITY ON AUSSIE?Hello Enthusiast Forex Traders! Here's long-term outlook for AUDUSD , Please give us the thumbs up and support the channel by Smashing the FOLLOW button :)
AUDUSD Created a wide rage bearish channeling. Afterwards, AUDUSD has broken out of the pattern that indicated a potential bearish movement.The MACD already crossed downward below the zero area, it signify a probability of potential bearish bias in the near future.
The roadmap will be invalid after exceeding resistance/target area.
DISCLAIMER:
This is only an outlook, not a recommedation to buy or sell the forex pairs.

A divergence signal appeared with CHFJPYH4 time frame.
Structure: Uptrend.
At the price of 122,500 CHFJPY formed a divergence signal with the MACD indicator.
Wait for the price to break the Key level at 123,700 and appear a confirmation signal, then you can find a buying opportunity.
The profit target is the price zone of 126,000.
-----------------------------------------------------------------------------------------------
Wish you all have a good trading day!

Wait for confirmation signal and sell opportunity with NZDCADH1 time frame.
Structure: Downtrend.
After forming a double top reversal pattern with divergence signal, the price broke the Key level at 0.87000.
Wait for a retest and a signal to confirm the return of the downtrend, then you can look for selling opportunities.
The profit target is the 0.86500 price zone.
-----------------------------------------------------------------------------------------------
Wish you all have a good trading day!

Wait for confirmation signal and sell opportunity with BTCUSDH1 time frame.
Structure: Downtrend.
After the price broke the Key level at 59000, there was a move to retest.
With the current retest zone, the price has formed a triple top reversal pattern and a divergence signal appeared.
Wait for the confirmation signal, then you can find an opportunity to enter a sell order.
The profit target is the 51000 price zone.
-----------------------------------------------------------------------------------------------
Wish you all have a good trading day!

LONG POSITION ON XAUUSD(GOLD)We are currently trading at key weekly demand or support zone. Coming into this level we see a falling wedge formation which is a bullish continuation pattern. So we go long upon breakout. Will update as time goes on, stay tuned!
Good Luck.
God Bless!

Wait for the buy signal to appear with EURCADH4 time frame.
Structure: Downtrend.
Key level at 1.44500 has been broken. The price is forming a retest of this support.
Wait for the continuation of buying pattern to appear, then you can find an opportunity to enter an order with EURCAD.
The profit target is the 1.47500 price zone.
-----------------------------------------------------------------------------------------------
Wish you all have a good trading day!

A divergence and key level break signal appeared with USDJPYH4 time frame.
Structure: Uptrend.
After showing a divergence with the MACD and a double top pattern, USDJPY price broke through the Key level at 112,700.
Waiting for the price to return to the 50-61 Fibo value zone of the strong down move at 114,500 and a bearish reversal signal will appear, then we can look for selling opportunities.
The profit target is the 112,000 price zone.
-----------------------------------------------------------------------------------------------
Wish you all have a good trading day!

Wait for the retest and buy signal to appear with GBPCADH4 time frame.
Structure: Downtrend.
Key level at 1.71000 has been broken.
The price is retesting and here waiting for the formation of a continuation pattern after clearly breaking the Key level, then looking for buying opportunities.
The profit target is the 1.75000 price zone.
-----------------------------------------------------------------------------------------------
Wish you all have a good trading day!

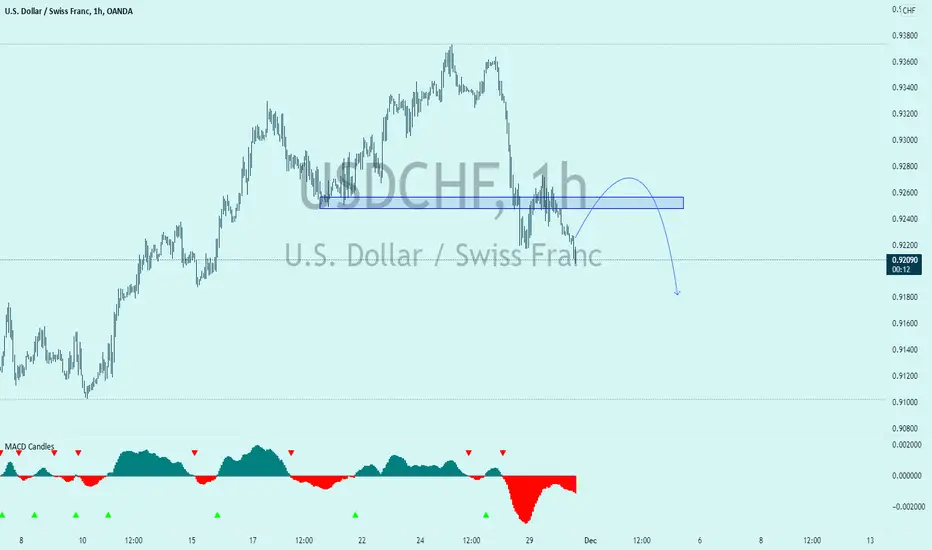
Wait for the retest signal and sell confirmation with USDCHFH2 time frame.
Structure: Uptrend.
Key level of short term uptrend at 0.92500 has been broken.
Here, wait for the price to return to the 0.92800 area to retest and appear bearish reversal patterns, then you can find selling opportunities.
The profit target is the 0.91800 price zone.
-----------------------------------------------------------------------------------------------
Wish you all have a good trading day!
AUD-CAD Will Go Down! Sell!
Hello,Traders!
AUD-CAD broke the horizontal key level
And because a daily candle closed below
The level, we consider it a confirmed breakout
Thus, we are now bearish on the pair
And I am expecting it fall
From the supply area toewards the target below
Sell!
Like, comment and subscribe to boost your trading!
See other ideas below too!

Buy EURAUD at the 5 wave elliotEURAUD buy dip now above key support level and expect the movement of 5th wave elliot
EURAUD
TYPE : BUY
TF : H2
ENTRY PRICE : 1.5780
STOP LOSS : 1.5690(90pips)
TAKE PROFIT : TP1:1.5800 TP2:1.5840 TP3:1.5900 TP4:1.5970 TP5:1.6050
