Short term LONG position on EURAUDEURAUD is currently trading at a key level creating both buying opportunities and selling opportunities. it most recently created a falling wedge of the back of a bullish trend. It broke out of the wedge and I am anticipating further buying pressure to complete the pattern mentioned previously.
Keylevel

Short position on USDCADUSDCAD is trading at a key resistance level on the monthly timeframe. As per technical analysis, I am predominantly bearish on the pair. This however is not a signal it is my personal opinion based off technicalities.

GBPJPY ShortGJ just recently breached it's weekly resistance area. Price action looked a little more interesting with the indicators on. Looking for a pullback of some sort and will be looking to short all the way to the next low and monthly support area.

Wait for break key level and sell signal with BTCUSDH1 time frame.
Structure: Uptrend appears divergence signal.
Wait for break key level and sell signal.
Target is next support at 42800.
-----------------------------------------------------------------------------------------------
Wish you all have a good trading day!

ETH USDT : Buy Trade setup @ 3161Hello guys, hope you are doing well.
Welcome to today's trade setup as a part of "Aglogains - Daily Trade Series".
As I have mentioned in the previous idea, I was waiting for ETH to close above 3200 and created new highs confirming the continuation of the uptrend.
We were waiting for a buying opportunities at 3160 - 3200.
On the 1H timeframe, we can see a double bottom is formed with a confirmation on the the lower timeframes.
Entry - 3161
Stop-loss - 3110 (51 points)
Take profit - 3240 (80 points)
1:1.57 RISK TO REWARD
Will keep you posted on the progress. Happy trading.

ETH seems so constructive structionSalaam
Here I share with you the daily chart that I see.
2900 was broken and serves as support now.
The violet ascending trend line (coincide with the middle line of the parallel channel) acts as resistance now intersects with 3170 key level.
Regarding the price action making 3 candles beside any key levels will lead to a break.
So I expect ETH to break 3170 and go to the next resistance about 3600.
Personally, I buy some here and will add after break 3170 and retest it as support.
SL: 2900
TP: 3600
Good luck

ETH USDT : Buy Trade setup @ 2923Hello guys, hope you are doing well.
Welcome to today's trade setup as a part of "Aglogains - Daily Trade Series".
After a massive rally to the upside reaching almost 3200, ETH USDT took a breather to pull back to the previous resistance turned support region of 3000 - 2900 level.
I was looking for buying opportunity at this level if I saw a bullish price pattern on the lower time frames.
On the 15 Min chart, we can see a double bottom is formed and then a bullish candle confirmation.
Entry - 2923
Stop-loss - 2843 (80 points)
Take profit - 3043 (120 points)
1:1.5 RISK TO REWARD
Will keep you posted on the progress. Happy trading.

Wait for Break Key level and Buy signal with USDCADH4 time frame.
Structure: Break downtrend, uptrend confirmed.
Wait for break Key level and retest at 1.26000 to a safe buy signal.
Target is next resistance at 1.28000.
-----------------------------------------------------------------------------------------------
Wish you all have a good trading day!

GOLD Bullish DivergenceGold is over sold and we can spot a Divergence on a support level at 1760, and MACD is giving a buy signal.
i think it may go up until 50-61 Fibonacci levels between (1780-1785) and then go down again or break above the resistance at 1785.

Downside with EURAUDH1 time frame.
Structure: Downtrend
Break uptrend and key level with H1 time frame.
Retest resistance at 1.60000 and down.
Wait for confirm and sell signal.
Target is next support at 1.59000.
-----------------------------------------------------------------------------------------------
Wish you all have a good trading day!

Wait for confirm and sell signal with GBPCHFH1 time frame.
Structure: Downtrend
Break Key level of Correction wave and retest at 1.26200.
Wait for confirm downtrend at a smaller time frame and sell signal to trigger order.
Target is next support at 1.25000.
-----------------------------------------------------------------------------------------------
Wish you all have a good trading day!

Wait for signal at support 36000 with BTCH1 time frame.
After divergence signal and price hit strong resistance at 41000, BTC made downtrend.
Target is support zone at 36000. Wait for bound or break at this price and signal to action after retest.
-----------------------------------------------------------------------------------------------
Wish you all have a good trading day!

Wait for confirm and buy signal with EURCADH4 time frame.
Structure: Uptrend.
Break Key level downtrend - retracement.
Wait for confirm uptrend and buy signal.
Target is next resistance at 1.51000.
-----------------------------------------------------------------------------------------------
Wish you all have a good trading day!

EURUSD 30m Short Position at 1.18899SL: 1.18950 (-5.0) | 5 pip stop loss
SE: 1.18899 (-0.1) | 0.1 pip slippage
TP: 1.18800 (3:1) | 3:1 risk-to-reward

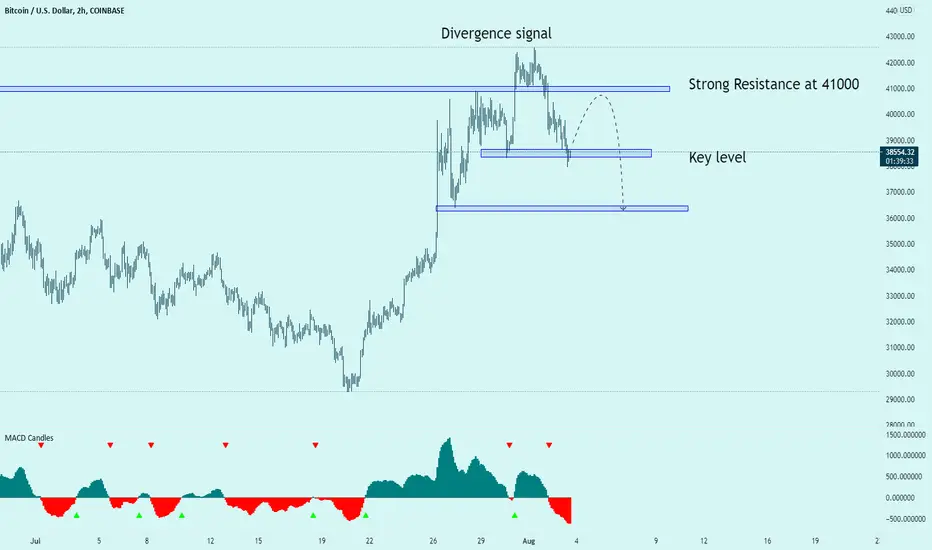
Wait for sell signal when retracement to 41000 with BTCH2 time frame.
Structure: Uptrend - Break Key level.
Divergence signal at 42500 and fake-out.
Wait for sell signal when retracement to 41000.
Target is next support at 36000.
-----------------------------------------------------------------------------------------------
Wish you all have a good trading day!
Short GBPUSD Off Key LevelSell GBPUSD 1.39000 SL 1.39130 TP1 1.38500 TP2 1.38000
Context:
- USD favorited news catalyst for Wednesday's ADP
- New Minor Structure downtrend identified
Confluence Details:
-Trading off key area 1.39000
- H1 0.382 Fib level at 1.38980 (beginning of new trend so expecting strong downside)
- H1 20MA dynamic resistance level at 1.39000
- H1 50MA dynamic resistance level at 1.39080
- Looking for a pin bar reversal off 0.50 fib level to confirm downtrend continuation at 1.39050 + 1.39000 new resistance level
- Entry confirmed once H1 price action identified: Either bearish engulfing or some sort of 3-bar variation pattern.

Wait for Break Key level and buy signal with EURCADH4 time frame.
Structure: Uptrend.
Divergence at support 1.48000.
Wait for break out key level 1.49000 and confirm signal to buy.
-----------------------------------------------------------------------------------------------
Wish you all have a good trading day!

Wait for retest and sell signal with GBPCHFH1 time frame.
Structure: Downtrend.
Correction wave with Ascending channel.
Breakout Ascending channel at resistance 1.26400.
Wait for retest at this point and sell signal.
-----------------------------------------------------------------------------------------------
Wish you all have a good trading day!

Buy EURSGD with Inside Bar setupDaily time frame.
Structure: Uptrend.
Break Key Level, retracement, and confirm uptrend with Inside Bar.
Buy order with this setup.
Target is next resistance at 1.63000.
-------------------------------------------------------------------------
Wish you all have a good trading day!

Wait for confirm sell signal with AUDUSDH4 time frame.
Structure: Downtrend with Correction wave ABC hit trendline.
Resistance at 0.74000.
Wait for the confirmation and sell signal.
Target is next support at 0.73000.
-------------------------------------------------------------------------
Wish you all have a good trading day!

🐮 NZD bulls back in action?NZDCHF has fakeout of an important support on the 4H chart, made a decent pullback to the 61.8% fib and is now continuing upwards.
On the 1D we have been supported and it seems that the bulls on NZD might be back in play.
Keeping this one short and sweet, long on NZDCHF

Wait for break key level and sell signal with EURJPYH4 time frame.
Structure: Downtrend, Triple Top pattern.
Wait for break key level and looking for sell signal.
Target is next support at 128.500
-------------------------------------------------------------------------
Wish you all have a good trading day!

Wait for Pullback and sell signal with USDJPYH1 time frame.
Structure: Downtrend.
Break key level of short-term uptrend.
Wait for pullback and sell signal at key level 110.000.
Target is next support at 109.100.
-------------------------------------------------------------------------
Wish you all have a good trading day!
