ADAUSDT: Scalpers key levelHello Traders!
This is the key level for scalpers for ADAUSDT.
Scalp with care. Find a pattern or strong candlestick pattern to enter the trade near these key levels.
Only Enter when you find a clear Pattern.
Levels are derived from some secret methods.
If you are scalping with the care then you will not lose any Trade.
Good luck traders.
Keylevel

LONG EUR/GBP.LONG EUR/GBP, ***IF there is a clear rejection around the current level, wich is around a monthly key level. Also, the market is over extended (seen on the RSI), wich indicates a possible retracement. IMPORTANT : I am only showing an analysis on one of the many timeframes that I use.

VETUSDT Scalpers Key LevelsHello Traders!
This is the key level for scalpers for VETUSDT.
Scalp with care. Find a pattern or strong candlestick pattern to enter this trade near these key levels.
Only Enter when you find a clear Pattern.
Levels are derived from some secret methods.
If you are scalping with the care then you will not lose any Trade.
Good luck traders.

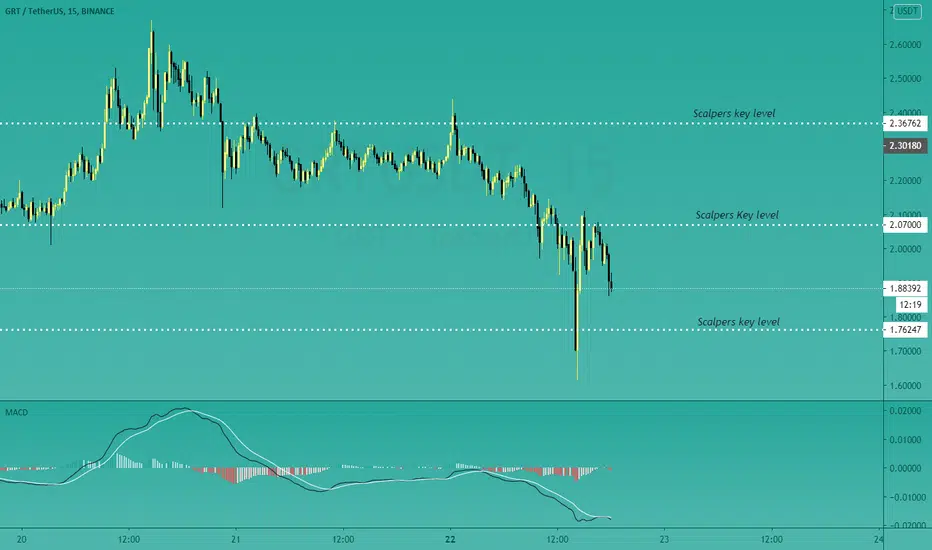
GRTUSDT: Scalpers key levels Hello Traders!
This is the key level for scalpers for GRTUSDT.
Scalp with care. Find a pattern or strong candlestick pattern to enter this trade near these key levels.
Levels are derived from some secret methods.
If you are scalping with the care then you will not lose any Trade.
Good luck traders.
USDCHFWaiting for the 4H to close above marked key level once it's done there is a higher probability that price can go up.

Break and Retest To The Downtrend Price has continued to push down on the higher time frames. Now price has broken below a daily and weekly key level a it is showing signs of retest of that key level. Most likely if it retest at that level it will continue going down.

GBPUSD BuyAfter breaking the consolidation, price is in a clear uptrend making Higher Highs and Low. I will be only looking for buys up to the weekly key level.

GBP/JPY - Simple Daily StructureWhy have we been looking for long positions on GJ for the past few weeks and months you ask?
Well, on the daily chart we can clearly see we have resided in an Ascending channel for some time now. However, we have now rallied up to the top of our ascending channel with a third touch.
You can see some key levels marked in on the right hand side. These are key levels on the lower time frames that we have been using to take long setups on the pair.
Where will price head next? We are right at the top of the range for this pair.
See our related idea for some long positions on this pair!

ETHUSD - Key LevelEthereum is at the key level of resistance, would you like to engage in a shorting opportunity?
RSI is at Overbought position which gives a good consideration, the conservative trader can wait for a candle confirmation before engaging the trade.

USD/JPY - Plenty of Upside PotentialPrice still respecting the key levels we marked in our previous descending structure. The break of structure is the first indication of a trend change.
We are at long term lows, price finding support at our key level and bulls looking to take price higher. Will we see a break of resistance next week with price moving higher?

EURCAD intraday looking promising between two key areasEURCAD BUY Intraday
start: 1.53778
stop loss: 1.53625
take profit: 1.54182

$CVS at 74 Key Level - Bullish Above74 has been a key level for the past few weeks. CVS is looking to break it and rally in the week before earnings. I've bought march dated options in anticipation of this.

GBP/JPY - Classic Simple SetupsA really simple analysis on GJ for you guys today!
More classic Break and Retest Setups on this pair - In line with the HTF bias we've been talking about for some time! Mark key levels - wait for breaks of these key levels - then wait for a retracement to test your marked key levels. See confirmation? Enter the trade?
If you don't know what this means, just drop me a DM!

2 big potentials looking for EURAUDDuring the last 2 months, we have seen price go in a bearish trend into the 1.56 support range, now we're seeing price repeat a similar bearish downtrend down towards that 1.56 support range. Currently waiting for a retest back downwards and an obvious reversal for my Long entry. (if we see price break support it doesn't mean look for short positions right away, wait for the retest, and find a good reversal for your position, look for TP with past supports)

🏛GBP_JPY RISING WEDGE AT KEY LEVEL↘️SHORT🔥
☑️GBP_JPY is very bullish at the moment
However, the pair has reached a strong resistance level
Which you can see on the 3 day chart on the left, which is a bearish signal.
Then, on the 3h chart on the right you can see a rising wedge pattern formed
Which is a bearish sign for us as well!
Therefore, we can expect a pullback from the strong level+pattern
Which is why we are waiting for the breakout of the wedge for confirmation
And then we will short the pair with 3 targets in sight!(IF breakout happens)
SHORT!↘️
✅Like and subscribe to never miss a new idea!✅

AUDCAD - BREAKOUT SOONThis is my personal view and i do believe the price will either break out the support area or resistance level, Wait for price action to make entry and trade at your own risk.

GBPJPY BuyPrice could break through the first key level before pushing back up, ideally id like to see multiple wick rejections at the key level on lower time frames before entering a buy.

NZD/JPY - Solid Break and Retest SetupNZD strength prevailed throughout the week as NJ pushed higher. We can see a break of our top key level here on the 4hr chart, a retracement before a strong bullish bounce off the level breaking previous highs.
What will we see next for this pair?

LONG EUR/NZD.LONG EUR/NZD, ***IF there is a clear rejection around the current level, wich is on the 1,66500 monthly key level (psychological level) and it is also on the -27,20% level of the fibonacci taken on the weekly timeframe. There is a divergence in the market (pink lines on the chart and on the RSI), wich suggests a possible move to the upside. IMPORTANT : I am only showing an analysis on one of the many timeframes that I use.

GBPAUD Swing Long PositionI am looking towards GBPAUD for a large swing long trade to the upside.
Based on the Daily market structure I anticipate GBPAUD will move higher towards 0.82000 in the mid to long-term. The market is clearly showing signs of reversal from a downtrend to an uptrend. After finding support on the 1.74500 Key level & demand zone the market has retaken some of the structure highs putting GBPAUD into the early stages of an uptrending move.
From here a healthy retracement is to be expected and I can see GBPAUD coming as far as 100-200 pips lower to re-enter the Daily demand zone between 1.76250-1.77250 for a reversal to then occur. We should be monitoring 4H structure within this zone for a shift from down to up. If the market can form some structural breaks and begin printing higher highs & lows out of this zone then we can expect it will begin to move higher from there, targeting the 1.8200 Key level resistance.
As always; be patient, trade logically & manage your risk in a professional manner.

GOLD Swing Long Trade | Next Stop 1950?Gold is providing a potential swing long trade setup towards some Daily key levels.
I a seeing potential here for the Precious Metal to make a significant move higher towards $1925 & $195 in the medium-term.
As you can see on the Daily chart, Gold formed a strong bounce from the $1810-$1815 demand zone printing a large wick and indicating that buying pressure is strong within that zone. From the bounce the market formed an accumulation phase and a bullish break of structure confirming the formation of new bullish orders. The commodity is now trading within the boundaries of the accumulation range and I expect it to move slightly lower before providing an opportunity to buy.
For my entry targets I am primarily focused on the 4H demand zone at $1828, but the doors are open for price to trade once again into the $1810-$1815 demand zone, so no entry should be rushed. As traders we are here to REACT not PREDICT so the best course of action for this Gold swing trade will be to wait patiently for 4H confirmations adopting a 'top-down' approach to the market at $1828. If no confirmations form you can continue to wait until the market gives you something to work with back in the $1810-$1815 range.
For my targets I am looking towards the $1925 Daily supply zone & Key Level, and the $1950 major resistance. I see precious metals moving considerably higher long term, but for this swing long 100% of my profits will be taken at the $1950 level.
As always, be patient, manage risk & trade logically.

Bullish top down analysis Smart Money over all trend is bearish . but price rejected M bullish ob in daily price action show aggressive buyer in market .. so looking for buying entry will be in m15 0r m5

EURUSD-Weekly Market Analysis-Jan21,Wk4EURUSD is back to a structure resistance, within the zone of consolidation hides 2 harmonic patterns, namely an AB=CD Pattern and Bearish Gartley Pattern.
A retest to 1.2187 would be ideal for a shorting opportunity, however, if it ends with a bullish engulfing candle wouldn't be ideal and an indecision candle is essential for any thoughts for a shorting opportunity.
