Bitcoin 4h Chart AnalysisWe have a massive h&s formation on 4h chart. Breaking down might take us down in 14k which will be backup cluster. I consider 183 as a keylevel for both parties (Bulls and Bears). If we get in uptrend i will consider this dip as a fakeout or glorius beartrap.
Keylevel


EURGBP LONG - Price is testing key support levelPrice is testing a key supply and demand level on the daily timeframe and has been moving correctively in a descending channel for a few weeks now. The market has now tested this area twice recently on the H4 timeframe and is showing signs of holding. If the market holds at this level, we could finally see a swing to the upside, breaking out of the descending channel and ending the corrective movement we have been having for EURGBP to see a test of a key daily resistance level above.

GBPJPY UPDATE - PRICE PUSHES PAST KEY LEVEL TO 138.6.GBPJPY UPDATE - PRICE PUSHES TO 138.6. Will be checking how price reacts from 138.6. Looking for a nice sell from that level

XAUUSD KEY LEVEL + WAITING ZONESXAUUSD KEY LEVEL + WAITING ZONES. Strong key levels and institutional orders in grey areas

GBPJPY KEY LEVEL + WAITING ZONESGBPJPY KEY LEVEL + WAITING ZONES. Entering only in grey areas and waiting in the red zones.

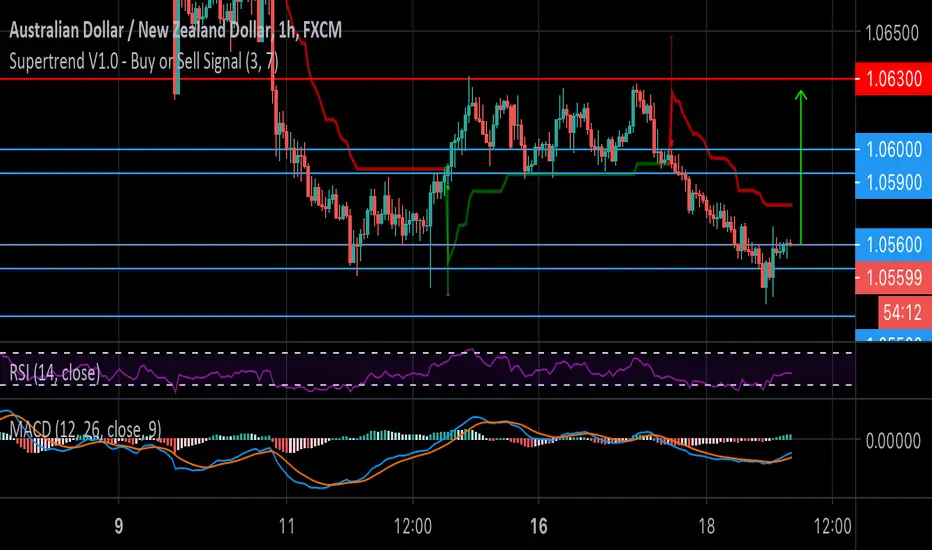
Key level breakout BuyWe got a candle close out above key level 1.05600. This is my entry point. We might see some consolidation before a push through the upper key levels I mapped out. TP will be 1.06250 if we can push through key levels.
Extremely effective scalping EURUSD strategy with key levels I am excited to present a very effective scalping strategy for this pair within these zones using the 4 hr and 1 hr charts. The blue lines represent strong resistance and red represent strong supports. This strategy is played within this high trading zone.
To find entry points using this strategy I will use the 4 hr chart. The 4hr chart with these key levels pinpoint reversal points. If you observe close you will notice strong pivots can be detected with a 4 hr long wick close out touching a support a support line. You can add confirmation of pivot reversal by observing RSI levels on 4 hr chart.
I use the 1 hr chart to monitor the momentum of the trend. The one hr chart is important because it helps determine key level breaks. If a 4 hr candle closes beyond a support or resistance, the 1 hr chart will help me determine the next key level of possible reversal.
Below is the 1 hr chart. You can see strong pivots on the 1 hr and 4 hr play out at 1.18300. Now that I have pivot confirmation I will observe the 1 hr chart to target 1.18940. Once this level is reached it will either close out with long wick or push right through 1.18940. If there is pivot confirmation we can target 1.18300 for a short scalp.
I am excited to use this strategy for the remainder of the week. The levels are clearly marked with channels and pivots made clear!. Let me know what you think!

BTCUSD SELLHello Traders! Congrats on the 11th victory.
BTCUSD just completed its target and now it triggered sell entry. I am expecting BTCUSD to fall from this key level and our target is the next key level.
For further confirmation, you can wait for your indicators to turn red and then go for the sell.
Good luck traders
Last BTCUSD post

XAUUSD KEY LEVEL AND DEMAND ZONE ANALYSISXAUUSD KEY LEVEL AND DEMAND ZONE ANALYSIS - Always read the price. Key levels and price action never lie - patience pays. Watch for these level to make good money in gold this week. You get paid to wait

GBPUSD-Weekly Market Analysis-Nov20,Wk3This week, GBPUSD we are looking for shorting opportunity. The market has now resisted at the key resistance area, a bearish engulfing candle would give a push for a shorting opportunity. 1.3106 will be the support level for me to observe if the candle manages to break and close below the level.

BTCUSD BUY + Nice sellHello Traders! We are 10/11 wins in BTCUSD in this fourth quarter of the year and will keep counting this record to check the accuracy of my strategy.
These two trades have aligned nicely according to the strategy. BTCUSD has broken the lower high and now it is expected that it will move up from the minor key level which is at 15900.
Also, Get Ready for a hard drop from the key level this drop can go as low as 10,000$. Check my previous BTCUSD trade to look at the analysis.
Good luck traders
Preview of Last 2 traders
This one is the failed trade after my 10 winning streak.

AUDCAD STRUCTURE ANALYSIS AUDCAD is in bullish minor trend within 2 key levels.
The growth is expected to the key level, where we will look for a reversal pattern.

LONG EUR/AUD.LONG EUR/AUD, ***IF there is a clear rejection around the current area, wich is on the 1,61500 monthly key level (psychological level). There is also a divergence (pink line on the chart and on the RSI), suggesting a bullish move. IMPORTANT : I am only showing an analysis on one of the many timeframes that I use.


SHORT EUR/JPY.SHORT EUR/JPY, ***IF there is a clear rejection around the current area, wich is on a weekly and daily key level, it is also on a trendline dated from August 31st. IMPORTANT : I am only showing an analysis on one of the many timeframes that I use.


