KHC

KHC, Kraft Heinz Co. - Potential Breakout on H&SNASDAQ:KHC
One of the best set ups.
Currently on Kraft Heinz is developing a classic reversing head and shoulders.
It is also one of the companies in the portfolio of the world's largest investor, Warren Buffett.
If we think about the potential recovery on the stock value, the Risk Reward becomes remarkable and the % of trade realization at profit remains as usual around 45%.
So we've set the alerts and we're waiting for a neckline breakout.
Stay Tuned!

KHC Trend ChangeBroke a downward channel, forming a mid-long term trend change if we can get above $32 gap fill way above here near $48, starting to add to this position while I scale out of my OXY calls.

KHC - Potential 5th Wave Long Swing Trading OpportunityUsing our Elliott Wave Indicator Suite for the TradingView Platform we have identified a potential Long 5th Wave Swing Trading Opportunity for KHC on the Daily time frame . The 5th wave move in an elliottwave sequence is the highest probability move.
The wave 4 pull back has found support in the Amber zone of our probability pullback zones, which represents an 80% probability that our automated 5th wave target zone, in blue on the chart, will be hit.
We see yellow dots formed in the overbought zone on our special False Breakout Stochastic indicator, which signals strong Bullish momentum. When, during a wave 4 pullback, the stochastic pulls back against these false break out dots and crosses in the oversold zone, there is a high probability the stocks price action will resume the overall bullish trend .
We also measure the wave 4 behaviour with our Elliottwave oscillator, which has pulled back within our pre-determined zone.
So overall we have identified, using our Elliott Wave Indicator suite for TradingView, a high probability long swing trading opportunity for KHC , Daily Time Frame , with the following entry strategy:
Long entry through $31.63
Stop Loss $29.98
Target $34.50
Giving a Risk to Reward of 1:1.6
Learn more about our Tradingview indicator suites by watching the video tours >>HERE<<

KHC Reversal?Christmas shopping might just be around the corner, waiting to see conformation will probably be a longer waiting game for this one. 180 EMA is looking better but we'll have to stay and see where this goes, dividend is good. Keeping on eye on this for now, bullish so far based on what it's show the past 3 months


KHCKHC’s innovation outlook is neutral based on a current score of 34 out of 99, underperforming sector average. Jobs growth over the past year has decreased and insiders sentiment is neutral. KHC is an Average Performer in terms of sustainability. It is most exposed to Mondelez International, Inc. as its supplier. Over the past 4 quarters KHC beat earnings estimates 2 times and it pays dividend higher than its peers.
For more analysis and articles visit our website .


KHC - Found Support & Accumulating Hi friends, It has been a long time I haven't updated KHC idea. Since that time price action printed several signs of bottoming process is taking place. I have shown them on the chart. As mentioned in previous idea the day price opened with 30% gap down a big buyer (could be Warren Buffet ;) ) showed up and absorbed all the panic selling. It was a first and immediate sign beginning of accumulation process. Since then price hasn't moved higher but consolidated for significant time.
Subsequent drop in price after accumulation and return with gap up is our second sign of bottoming process is real and in progress. It gave up a range of accumulation $27-$31.50. I believe price will keep accumulating within that range until it breaks up.
The worst case scenario is double bottom pattern.
The best case scenario is upward gap will be tested and holds without being broken down.
Any purchase within this range will be good for investment. Obviously try to get the lowest entry possible within this range. Good strategy is as usual split your entries into at least 5 and slowly scale in.
Good Luck!

Ascending Triangle Runs Out of Room Soon for SPY SPXIt's just a chart with some fibonacci levels and an ascending triangle with no where to go but down in my opinion. Looks like 2777-2775 is the first Fib level to revisit after topping out around 3,025-3045. Negative divergences also signaling running out of steam IMO. Don't hold anything for long, regardless of how strong it appears to be. Anything could change in one swift key-stroke of trumps fat fingers...Only thing that sends this higher in my opinion is a resolution of trade with China, and even then - Trump may start another trade war in it's place soon there-after IF we ever resolve China first... SPY SPX
I'm personally bullish on old school value plays that have been forgotten about that now have good dividends while you wait out the storm such as $CVS which has a .50 cent quarterly dividend, yielding 3.45% better than it's industry leaders like your UNH and ANTM which only yield 1.65% and 1.05%. Another one I'm long is $KHC Kraft Heinz which yields 5.22%, and last one that I'm watching is $GT goodyear tires, yielding 4.38%
All these growth stocks with sky-high valuations are going to begin to crumble at some point and I don't want to be holding long for that.
Good Luck!


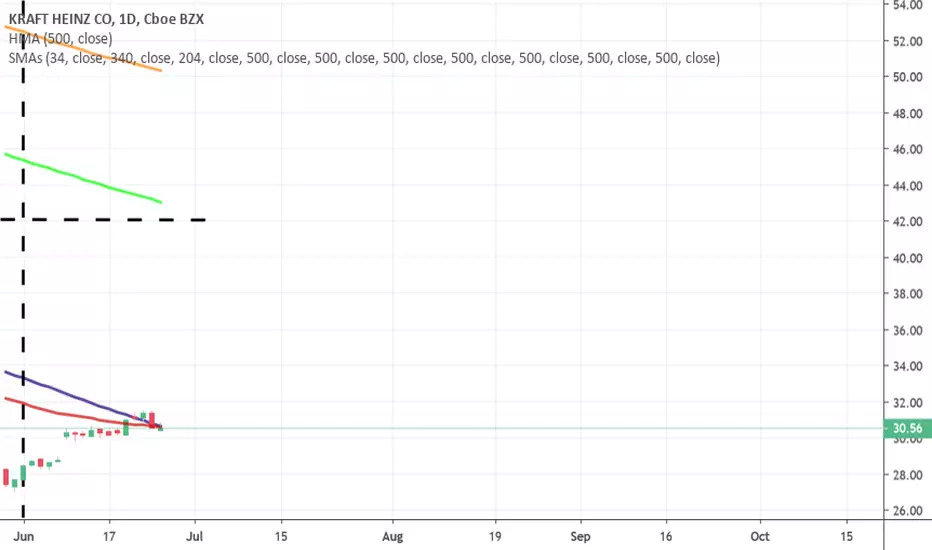
brschultz Rule#1: BUY 34 SMAx500 Hull, Profit Target 340 SMA=$48brschultz Rule#1: BUY 34 SMAx500 Hull, Profit Target 340 SMA=$48

KHC passes Daily 34 SMA x 500 Hull - Blue Skies???KHC passes Daily 34 SMA x 500 Hull - Blue Skies???

KHC Daily Testing 34 SMA v 500 Hull - What a nail biter!!!KHC Daily Testing 34 SMA v 500 Hull - What a nail biter!!!
KHC worth 34 Month SMA or $65 - I bought at $28.50 - You saw it!KHC worth 34 Month SMA or $65 - I bought at $28.50 - You saw it!

Kraft Heinz Big Test- Daily 34 SMA x 500 Hull -by Willie Makit??Kraft Heinz Big Test- Daily 34 SMA x 500 Hull -by Willie Makit??

KHC 204 Week SMA @ $70.00 - almost 2.5X dividend + 2.5x growthKHC 204 Week SMA @ $70.00 - almost 2.5X dividend + 2.5x growth

The Long Road to 340 Daily SMA 4 KHC -Nailed Bottom Perfectly??The Long Road to the 340 Daily SMA for KHC... Nailed the Bottom?


Astounding Results - KHC up 4% this morning after bottom callAstounding Results - KHC up 4% this morning after bottom call

KHC 4 Hr Interesting 340 SMA cross huge resistance @ my buy ptKHC 4 Hr Interesting 340 SMA cross huge resistance @ my buy pt
