NZD/USD was Underpinned After Better GDP DataNew Zealand Dollar is among the strongest majors following better than expected GDP growth. New Zealand GDP grew 0.7% qoq in Q3, above expectation of 0.5% qoq. Q2’s growth rate was revised sharply lower from 0.5% qoq to 0.1% qoq.
Technically, the next direction of the NZD/USD next sessions is likely to be determined by trader reaction to the 61.8% Fibonacci level at 0.6567.A sustained move there will indicate the presence of buyers. Also on a daily chart we have confirmed bullish cross on 50-day SMA above 100-day SMA. So, we prefer the bullish scenario until the pair keep trading above 200-day SMA at 0.6531. The first upside target is 0.6666. In that area we have the upper boundary of the daily Bollinger Bands, the resistance line of the bullish price channel and 78,6% Fibo level.
On downside, a clear break bellow 0.6567 will indicate that sellers have re-emerged. They are going to try to form a secondary lower top. If this move creates enough downside momentum then look for a break to the 11th Dec. low at 0.6522. Taking out this level will change the main trend to downward with 0.6497 the next major bearish target (50% Fibo).
Take in mind, that additionally, details of the US-China trade relations and US President Donald Trump’s impeachment voting will also entertain investors.
We're expecting to share with us your opinion in the comments bellow.
Kiwi

NZDUSDAsset: Kiwi
Trade: Short @ 0.6597
Stop Loss: 0.6606
TP1: 0.6567
TP2: 0.6547
Telegram Channel: t.me

NZDCAD Uptrend Exhausting?NZDCAD was a trade we took to the upside and hit our upside target.
From here, we talked about watching for a potential trend reversal, and we are very likely getting this now.
The uptrend with higher lows and higher highs is now exhausting. 0.8635 is the higher low we are working with and are awaiting the break and close below.
You can see we expect a lower bounce pattern here or some sort of head and shoulders pattern. This will confirm our first lower high with the lower low that would be made with the break and close.
Another confluence of course is where price reversed, was a big flip zone.
Watching for the break and close and we will then enter, with our target being 0.8560.

Kiwi short off median lineLong-term pitchfork has been in place dictating price movements since 2016, and the current rally could potentially have found resistance at the median line.
Other potential resistance levels alongside this:
Trend line off March-July highs
25% slope in new untested pitchfork

More Kiwi Strength? - NZD/USD Ichimoku Long TradeThis pair has been on a larger bullish run over the past few weeks and I am looking for that to continue.
We are down near kijun sen here and I am looking for a push back up and beyond price structure highs we saw last week.
I am looking for a good support candle to form to buy on for a chance to go ahead and get long to our targets I've drawn out.
If we fail to hold support or if our bullish confirmations change, this setup may become invalidated.

Can NZD Keeps its Gains Against USD? The New Zealand Dollar could be weakening on profit-taking and we can see a pullback into a support area at 0.6567, which is 61.8% Fibo retracement on the fall from 0.6790 to 0.6203.
But the pullback from 4.5-month high could be temporary, cause on the daily chart we may have a bullish crossover of the 50- and 100-day SMAs. Once its confirmed, this should attracted the buyers.
Additionally, NZD/USD printed a daily bullish engulfing candle yesterday, signaling the bullish momentum is not exausted yet. If the buyers pick up, the nearest bullish target is 0.6666 (78,6 Fibo level). In event we have a clear break there, this could extend the upside trend towards July 24 high at 0.6723.
And of course don't forget to keep a close eye on fresh developments surrounding the US-China trade talks. In case sides fail to reach a deal and the US ends up hiking tariffs on Chinese imports on Sunday, the trade-sensitive kiwi could start erasing this week's gains. Bellow 61.8% Fibo the next support is around 0.65 - 0.6475.


More Kiwi Strength? - Ichimoku NZD/USD Long Trade SetupThe kiwi has been on a rise for the past week and now I am looking for a drawback and support to hold for a chance to get long back into that trend.
We're close to entry here at market open which actually may give us a quick entry into this with the gap that formed.
I've drawn out price structure targets on our way to overall price structure resistance that I'm aiming for. If we fail to hold support or if our bullish confirmations change then this setup may become invalidated.


ORBEX: "Tariff-Man” Return Risk-Positive, PMIs Weighs on Dollar!In today’s market insights I talk about Trump’s latest tactical move to intimidate China into a partial deal!
With China having retaliated for the HK bills and manufacturing data confirming that the trade spat is now weighing on on the US economy, risk appetite returns with the Tariff Man!
Will tariffs against Brazil and Argentina push China in the corner, or the dollar itself?
Stavros Tousios
Head of Investment Research
Orbex
This analysis is provided as general market commentary and does not constitute investment advice.


EURNZD - Head and Shoulders topTrade Idea
A bearish Head and Shoulders has formed.
Negative overnight flows lead to an expectation of a weaker open this morning.
Selling posted in Asia.
We look for a re-test of the downward trending resistance.
Further downside is expected although we prefer to set shorts at our bespoke resistance levels at 1.7325, resulting in improved risk/reward.
We look to Sell at 1.7325
Stop: 1.7375
Target 1: 1.7150
Target 2: 1.7100

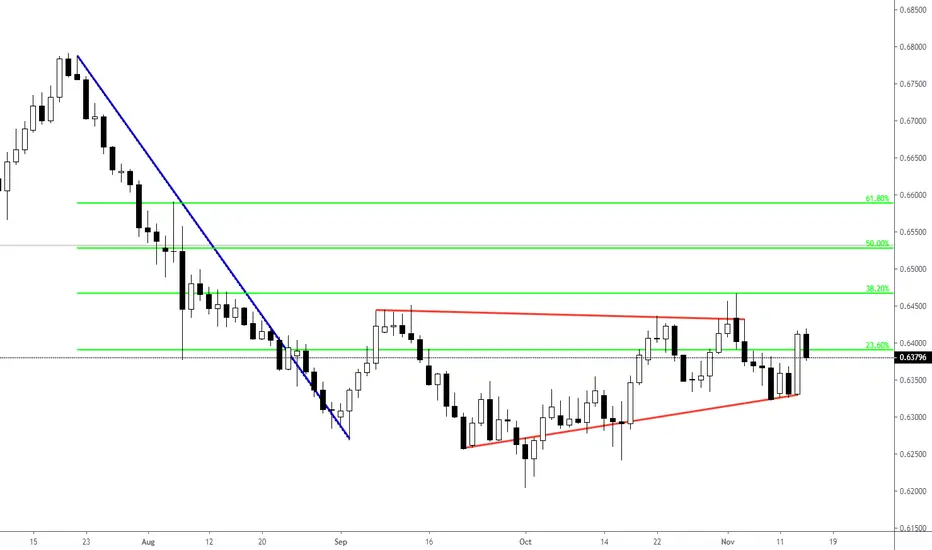
NZDUSD Facing Major ResistanceNZDUSD is facing a major resistance at the current levels - $0.6430s. The bulls are bracing for a fight with the 100 DMA and the down-slipping trend line that connects recent highers lows. A break of this zone will likely trigger a move above $0.65 cents where the ascending line meets the 200 DMA.

Kiwi may take a turnThe kiwi is gaining against the loonie as oil prices fall over fears of a demand slump due to continued trade disputes between the US and China. As the New Zealand Dollar rise we might see a turn from 0.8510. In the following fall, 0.8430 and then 0.8400 can be watched.

NZDUSD TO MOVE HIGHER?In this video update, we take a look at the NZDUSD as the price
has recent burst through the Monday candle high suggesting we could
see a continued move to the upside. Looking at the lower timeframe the key moving
averages are lining up in line with a long bias.

Kiwi sees correction to the rate surpriseThe US dollar pushes back against the surprise jump the Kiwi saw after the RBNZ left the rates unchanged at 1.00 percent. The pair price has entered into and continues a correction to that move. A potential acceleration to the fall could take us back to 0.6350 and later 0.6330 where at the lower line of the slightly straight channel where the upwards move started.
WOL3.0 #32AUDNZD sell stop 1.07907
SL 1.0849
TP 1.06739
R= 58.3 pips
Si el precio llega a 1.07322, mover SL a 1.0779

Kiwi underperforms as investors bet that RBNZ will cut rates oveExpectations at time of writing, drawn from short-term rate futures, imply an 80% chance that the RBNZ cut of a -25 bps on Wednesday, with the rest of the 20% attributed to a hold. Although inflation has subsided, the softening employment situation and weak business confidence suggest that further easing is warranted, a decline in NZD and an improvement in the housing market may allow politicians to stay out this month. We believe that even if RBNZ leaves interest rates unchanged, the continuing uncertainty in the region should keep the bank dovish and the risk for NZD is downside.
After that though, the currency’s direction will depend on the signals about future easing.
If the RBNZ holds the interest rate, it can catch many people unprepared and this would probably be the most bullish scenario for the NZD pairs. In that case we can see NZD/USD to test 0.6400 resistance. If the interest rate is reduced (as expected), but still the bank refrain from being overly dovish, then it could print a minor rebound. With a dovish cut, we can see a break below $ 0.6320.
Purely technically, NZD/USD has been trading in a downward price channel since early November on the four-hour chart. The channel model was formed on November 4. Earlier this morning, the NZD tested the 0.6365 resistance zone formed by the upper trend line of the bearish channel and the 200-day EMA on the four-hour chart, but stepped back.
If this resistance area continues to hold, then intraday signals remain in favor of the bears and we can watch the trade continue within the downside channel before the decision tomorrow.

ORBEX: NZDUSD, USDJPY: Traders Taken By Surprise #RBNZ #TrumpIn today’s #marketinsights video recording, I talk about NZDUSD and USDJPY FX Majors
Not only markets expected with 80% chance that RBNZ will cut rates which they never got, but the central bank also said that kiwi is expected to be supported in the medium term by the low exchange and interest rates.
USDJPY on the other hand, remained somewhat muted as Trump didn't provide any insights on the trade war situation. Despite the dollar's early gains, yen managed to win back some strength following a report that the US is considering imposing tariffs on EU automakers!
Stavros Tousios
Head of Investment Research
Orbex
This analysis is provided as general market commentary and does not constitute investment advice.

EURO VS KIWI (EUR/NZD) Mid Term Trade Strategy & PlanRBNZ Expectations Survey , which featured downgraded official cash rate and inflation estimates, the Kiwi gave a fresh bearish trigger in the Asian trading session.
Real interest rate cut for the RBNZ decision this week has been boosted by this report, so it wouldn't be shocking if London session traders were to start positioning by today.
Earlier on, the pair bounced off the support at their ascending channel and distance, but might still have some bullish momentum higher for another split. Nonetheless, a step past the top of the channel could see a limited upside at the resistance level of 1.7500
The economic schedule shows that the eurozone has ZEW Economic Sentiment figures up for release, and forecast expected good from Germany and the entire region. If it's for real then this cross-currency could fly higher, especially with risk aversion creeping in ahead of Trump’s trade speech.
Moving averages reveal that EURNZD is safely in the bullish territory in short terms. Talking about the average volatility over the past 30 days that tells pair moves around 110 pips per day.
Dip back to the channel support around 1.73313 could be a good long entry area, with a stop below the weekly S2 of pivot 1.72767 (around the previous low of Nov 4). I have a bullish bias and have a plan to enter (if we get chance) from the bottom of the ascending channel but as we can see there some levels which our arrows in the chart pointing out for potential reversal zone (PRZ) and one can jump in and out of the trade depending on how the market news which are concerned to this two currency releases and how it shifts in sentiment and price action for this cross pair throughout the remaining days of the week. Happy Trading!

Call me crazy, later.... GBP/NZD swing trade to the moon!Based on the weekly double bottom that has been pushing price since around 2016, the market has ultimately predicted the out outcome of Brexit, or any positive or negative news that is to come. If we can stay in tune with the weekly formation, price needs to get up to the next weekly selling zone. FX:GBPNZD
side note: I did hedge this position with a sell at the top of the weekly zone on the short term reversal, but I can't not buy on the news sell off into liquidity.
