Build up volume and momentumPrice action breaking up a long term downtrend resistant line with building up volume .
Construction sector will have a short/mid term rebound.
Targeting +10% - +50% profit from current RM1.11
Risk Reward ratio: 1.5
TP1: RM1.25
TP2: RM1.45
TP3: RM1.65
Cut loss : -10% (RM1)
Like my works? Please hit the Like, Follow and Share or tip me a few coins :)
Thanks!
Disclaimer
This information only serves as study references, does not constitute a buy or sell call.
Klci
FKLI 4Yr Plan (2022-26): Retest ATH by 2026 *if no USD Collapse*$FKLI
FKLI recovery map (2022-2024/26)
Dec'22:
Bounce continue post-GE
mid'23: reclaim 1,598
end'23: reclaim 1,698
mid'24: retest 1,600 from 2023 peak
mid'24-early'26: reclaim 1898...
@ 2026, what's next?
case A: Fed cont QE, ATH or new ATH on inflation
case B: Dollar collapse, world plunge into abyss.
thanks for reading my crystal ball analysis lol 🔮
see you in 2026! 💫
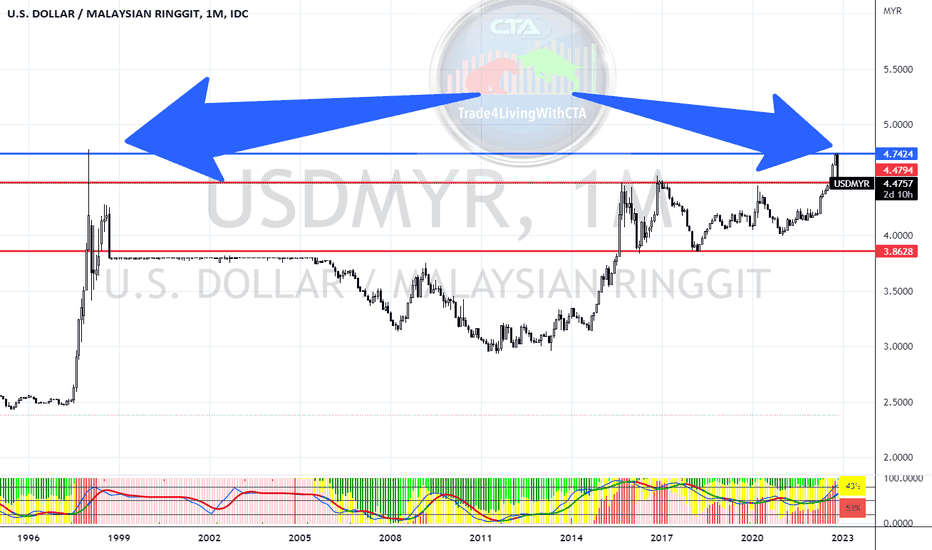
USDMYR Simple Chart AnalysisUSDMYR - This chart can use to monitor our country economy too, hopefully the double top here can indicate that our MYR can continue to be strengthen under the unity government.
How to view the guidance via chart ( Refer back to pin message guidance if to trade )
Red Line = Support
Blue Line = Resistance
Light Blue = bullish/bearish pattern
Arrow = Double/Trip top/bottom
Red Chip = $$
Green Chip = XX
KLCI On Going To $1206 Price | Bearish Movement | 111022 | It has been an excellent rollercoaster for KLCI Indeks.
We are in the midst of a downturn in pricing when the price of Ringgit will not stand a chance to recover in the next 2 years.
While we are in the midst of dissolution in Malaysia. We do not have any current prime minister running for management.
While this dissolution only makes the settlement in not go in order. While all the companies in Malaysia are still having a downturn in profit.
In order for the index KLCi on going to the trend, I can't see anything on the clear road except bearish.
The CPI index accumulates and all the housing price is on the going rising to make the purchasing powerless.
The breath and health of the current demand is not in favor.
I predict the price of KLCi bearish to $1206.
KLCI - Malaysia Composite Index Expected to Fall !!!!Based on the early analysis, KLCI is expected to fall to 1008 if it closes below 1270 on the monthly candle. Keep track of the monthly levels, the market is expected to be volatile due to the upcoming elections and the associated outcomes from the election.
KLCI & TOPGLOV: Pure speculationPure speculation for fun. Don't make important decisions based on this.
Gloves tend to lead KLCI recovery after a crash.
SPX mid-term seasonality likely sideways at best before Q4 or with a bottom in September before rising towards mid-term elections in November.
If KLCI were to "crash" and follow this pattern, it will start in August and bottom in September/October.
OPCOM going to BULL ?OPCOM stock already make double bottom let see stock can break strong resistant BULL or make or find PULLBACK
FINANCE: Possible End of CycleFrom 2003 to 2018, each cycle from peak to peak for FINANCE index lasts between 36-46 months. Recent high in early May 2022 is equivalent to 49 months.
Other indicators:
- Negative divergence on monthly chart (CCI)
- Similar negative divergence also appear on the monthly chart for big caps like PBBANK, MAYBANK, HLBANK, CIMB.
KLCI Cycle & elliotwave analysis. 11/July/22.KLCI “based” on its cycle analysis. KLCI is still forming its expanding flat pattern in (A)(B)(C)(cyan) in wave 2 ( Red Circled) which probably ONLY completed by end of 2022 as long term cycle 8 (purple) alway reached near by the red vertical line. (Year end).
KLCI “Finally” reached 1490. 10/June/22KLCI Finally break below 1500 and reached 1490 as last wave e or last leg of bullish triangle as previous ideas. But “maybe” still having some “space” for downside until around 1480? As its “big brother” composed “stock” which is Tenaga still waits to break RM8.570 before “bottoming”?..
KLCI index probably done bullish triangle. 29/April/22KLCI possible have completed its bullish triangle pattern ABCDE (Red Circled ) (Highlights Zone). Price now in consolidating stage building a “Rocket” “Base” @ : - 1) Volume Profile POC ( Red Thick Horizontal line) , 2) Volume Weight Average Price ( yellow thick line 3) Price at Previous Supply Zone Flip to Support..AND before launching to the moon! Possible breaking 1620 and ATH @ 1900! Within 3-5 years...


