$KMD : accumulation for a great bounce ?We already speak about $KMD
Breaking long term descending trendline
Now in accumulation phase
Testing the low range
Volume increasing
Bullish divergence
If support breaks on 3D chart, we go away
KMD

KMD/BTC potential in sideways================ BINANCE:KMDBTC ================
KMD BTC in side ways
1.hold in major support now
2. RSI DIVERGENCE
target in chart
potential Long maybe in midterm until longterm
==============================================
Trading Involves High Risk
this is Not Financial Advice
Please use Risk Management
==============================================
If You Like My Ideas
please Supporting My Channel
Through Leaving A Thumbs Up, Comment & Follow
Happy Trading make a profit ! --> Thank You! :)
==============================================

KMDBTC medium-long termKMDBTC has been repeating a pattern as we can see in the chart.
It will be most likely repeat itself now since it is at the bottom of price action with volume decreasing, showing a potential bullish divergence.
We could wait for MACD crossing for buy signal.

Komodo buy point.Hello, Traders!
KOMODO seems that is going to test the important support level of 0.0000540.
That is a great place to buy this asset, we must watch the price behavior on this support level test.
Push like Buttom and follow us on trading view.
Best regards.
Sandro and Gustavo.


THE RETURN TO GLORY!KMD has broken out of the (861 days) downward trend line and is currently testing support on the 4 hour chart. This thing has been coiling forever and an increase in volume has been occurring at KMD's bottom since October 2019. There is naturally some resistance points (red squares) but as momentum gets going I do not expect they will be to difficult to bust through (except for the ATH). What goes up must come down; the next year should be fun to watch.
THIS IS NOT FINANCIAL ADVISE; Y'ALL ARE ADULTS! CRYPTO IS HIGHLY VOLATILE.

✳️Komodo [KMD/BTC] on Aug-22 #KMD $KMD #KMDBTCKMD has just broken out of the downtrend and is heading to the 900-950sts and 1250-1300sts zones this September.
Private Idea :


$KMD, Showing really nice volume levels as it flips ~6300sats$KMD
Showing really nice volume levels as it flips ~6300sats back to support w/ UCTS indicator showing a Buy signal on the 12H Timeframe
Aim for an entry as close as possible to support or wait for another Flip/retest to minimize your risk.
Targets: ~7200/8000/8800sats
#KMD

moving 200 & fib div & ichimokuHello friends
Good time
I came up with my own strategy.
For several days now, many currencies have broken their 200 moving average upwards. My choice now is kmd. Have fun
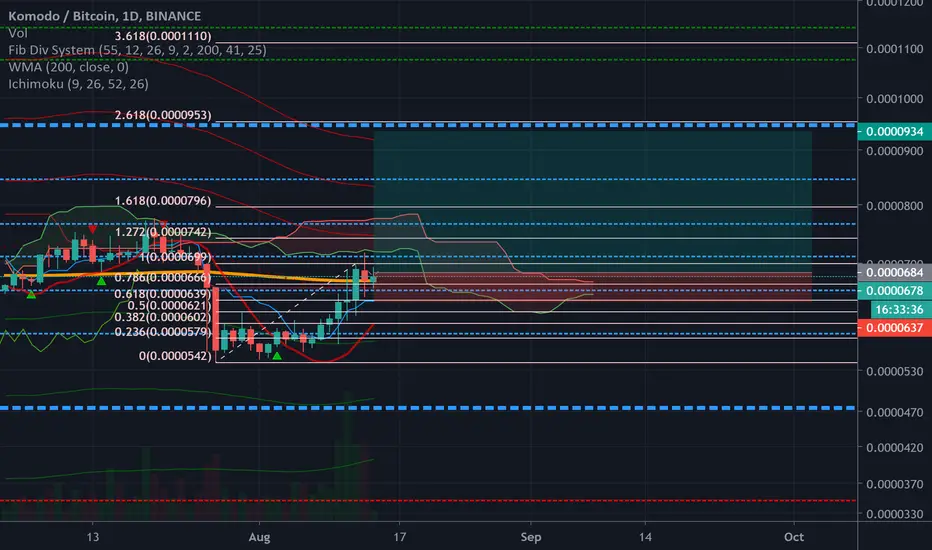

KMD/BTC 12h (Binance) Descending channel & triangle breakoutTA: Komodo just broke-out that ascending triangle and got rejected on upper-line channel.
I'm expecting a pull-back to retest support then a new attempt to break higher, better wait for entry.
Current Price= 0.0000665
Buy Entry= 0.0000636 - 0.0000612
Take Profit= 0.0000680 | 0.0000771 | 0.0000839
Stop Loss= 0.0000568
Risk/Reward= 1:1 | 1:2.63 | 1:3.84
Expected Profit= +8.97% | +23.56% | +34.46%
Possible Loss= -8.97%
Fib. Retracement= 0.382 | 0.5 | 0.786 |
Margin Leverage= 1x
Estimated Gain-time= 480h

KMDBTCPRICE ABOVE WEEKLY SUPPORT 590
MAYBE PRICE GO DOWN AGAIN & RETEST THE AREA AND GAIN SOME LIQUIDITY
IN GENERAL PRICE MAKING WELL IN THE DAILY & WEEKLY TIME FRAME


LONG KMD/BTCStrong support is getting touched and a nice risk/reward trade is possible here.
Let me know if you've got feedback! Always eager to learn!
Thank you.

KMD/BTC is in a BIG BULLISH TRIANGLE!!KMD/BTC is in a BIG BULLISH TRIANGLE!!
There is also news coming up:
Komodo (KMD)
30 September 2020
LibnSPV Upgrade
A good entry would be inside the green target if there is a pullback or retest of the lower trend line of the triangle..
This may be a mid term hold - give it a month or two.
Please keep an eye on BTC, an irrational move from Bitcoin could change this chart dramatically.
Trade safe my friends....
BINANCE:KMDBTC

KMDBTC: Falling wedgeFalling wedge
Finds a long time in accumulation
1 - 0.0000774
2 - 0.0000871
3 - 0.0001040
4 - 0.0001200
5 - 0.0001380
f you like what I do, put 👍 and subscribe
Waiting for your comment, what do you think about this?


KMD Weekly Breakout Setup1 Day price trying to break 200 EMA
Buy Below 740 and hold this is weekly breakout Guys
Stop : 650
Target : 800 , 950 , 1100 , 1300

Nice Head and Shoulders forming at KMD/BTCA clear Head and Shoulders is forming, causing a great LONG oppertunity.
The strong support and resistence are very clear as well and could be used as stop/loss indicators.
Let me know if you've got feedback! Always eager to learn!
Thank you.

KMD / BTC Channel 111%. Reversal zones. Work on a coin.After the price exited a descending wedge, a horizontal accumulation channel formed. External channel width 111%. Domestic about 50%. Liquidity is average.
The channel and pivot zones are shown on the chart. Price fixing above the channel resistance level (yellow zone) may serve as confirmation of further growth. Not overcoming this zone can serve as a price reduction to the indicated important channel support zone. Further, how the price will react to this support zone.
Now is not a good entry point, as there is uncertainty in the further price movement. Tool for observation.
Good potential entry points:
1) When fixing the price above the resistance of the current channel (yellow zone).
2) Entrance from the bottom of the active channel upon confirmation of support.
Stop loss
Set Stop Loss value with calculation of your trading strategy and money management. Stop Loss percentage should be adequate. What matters is not the Stop Loss value itself, but the entry point and your system of work.
The first potential target showed on the chart.
1) From channel resistance in case of consolidation + 60% and if the uptrend will develop even higher.
2) From the bottom of the channel about + 111%.
The previous trading idea for this coin gave + 55% from the moment of breaking the resistance of the downward wedge.

KMD/BTC could be pushing higher soon#KMD / BTC ( Binance )
Buy Range : 0.0000708
Stop Loss : Daily close candle below 0.0000660
Target 1 : 0.0000890
Target 2 : 0.0001100-1250 area
After almost a year of consolidation, many of the altcoins are starting to outperform Bitcoin.
We have already seen how ADA, DOGE or LUMEN among many others have provided many benefits.
I think Komodo is a currency that has historically increased its price very well in periods when altcoins have dominated
In the technical section, the price action has resisted the support of 500 sats. Now it appears to be forming an ascending triangle pattern.
The first logical objective to take profit is resistance that has already been tested several times. From there, we could see how it reaches the next FIBO point after testing the support if this coin is able to maintain strong pressure.
As for the technical indicators and the price, just to say that they are Bullish in all the timeframes, and that there should be no major problems while the price holds the support.
Good luck !
More trading signals in my telegram channel.
