KMDBTC


#KMD Chart is following the right path#KMD is also doing great steps. Printed +8% profit since I’ve published this update yesterday. Took some profit and move stop losses into break-even.

$KMD update! +10% since yesterday's post/discussion.
$KMD update! +10% since yesterday's post/discussion. Did make a beutiful +10% move after bouncing nicely from the 200MA on 4H. Unfortunately it got rejected close to the 200MA on 1D & from the resistance at the previous range high.
Price currently consolidating and rying to get back into the ascending channel. Secured profits and observing if the price rejection was not just a reaction to the slight $BTC dump from earlier today.
#KMD waiting for the breakout !!#KMD - beautiful and clear triangle. Waiting for the resistance breakout, the the price will pump.

$KMD has just bounced. Now we are looking at 730 & 755 sats ++ $KMD has just bounced. Now we are looking at 730 & 755 sats ++

KMD/BTC 12H (Binance) Falling wedge brokeout & pulled back: Fib.Komodo pullback looks like is done, now the way up is free to go :
Entry range= 0.0000675 - 0.0000715
Take Profit= 0.0000871 | 0.0000950 | 0.0001029
Stop Loss= 0.0000519
Risk/Reward ratio= 1:1 | 1:1.45 | 1:1.9
Fib. Retracement= 0.382 | 0.5 | 0.618
Expected Profit= 25.32% | 36.69% | 48.06%
Possible Loss= -25.32%

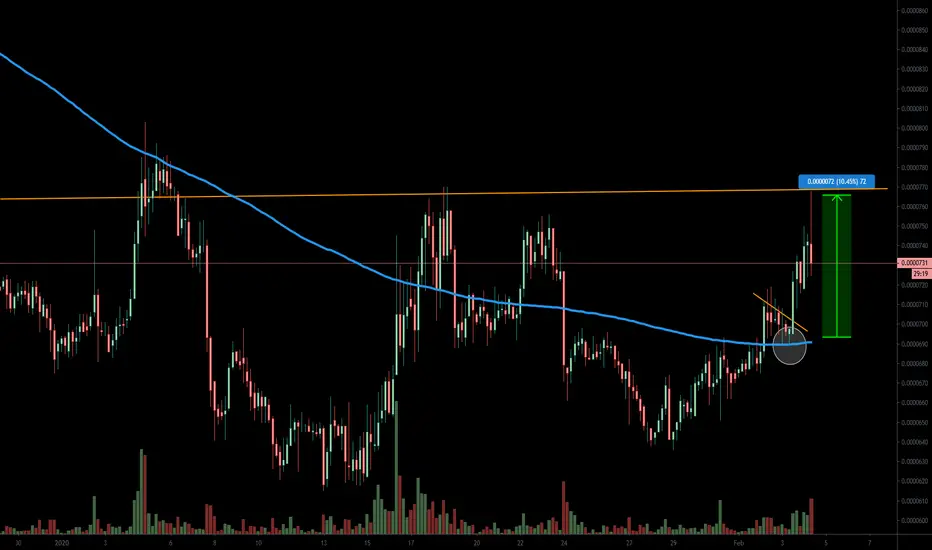
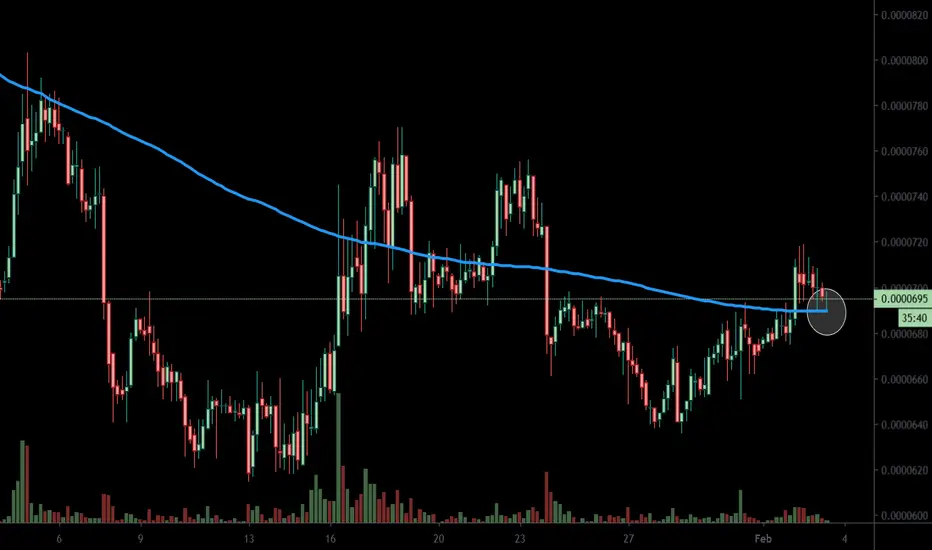
$KMD to bounce soon from the 4h 200MA.$KMD to bounce soon from the 4h 200MA. $KMD tends to have explosive moves up, so if we do indeed bounce I'd expect a anything between +8% to + 15% move up.
komod big moon soonish secret of being a smart trader?
- find a group of coins that are trending
(current trend is OG coins)
- check if the certain coin's made a base and could stay above it
- is structure bullish? (duh, just made a HL)
- got a proper risk mngmt? (SL below latest HL)
send tweet
$kmd

KMDBTC 4HKomodo; there is the Bat Pattern and with the probable breakout, looks like the Bullish.. Good luck!

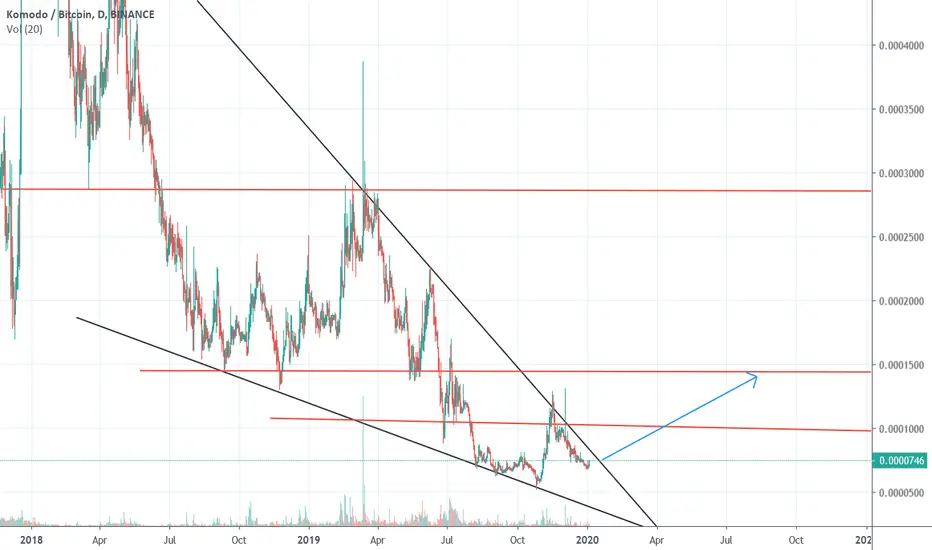
KMDBTC To the moon??Breakthrough of a falling wedge daily TF (bullish sign)
Candles are becoming bullish!
Pulling to the resistance level!
Volume accumulation

$KMD, Crossing above ~7200 sats resistance level w/ Volume!$KMD
Crossing above ~7200 sats resistance level very good volume levels..
Currently against EMA50 on the 1D chart & UCTS Buy signal active..
If continuation happens from here (R/S flip or straight leg up 🙆♂️), then aiming for ~8500sats as 1st target (~15%)
#KMD

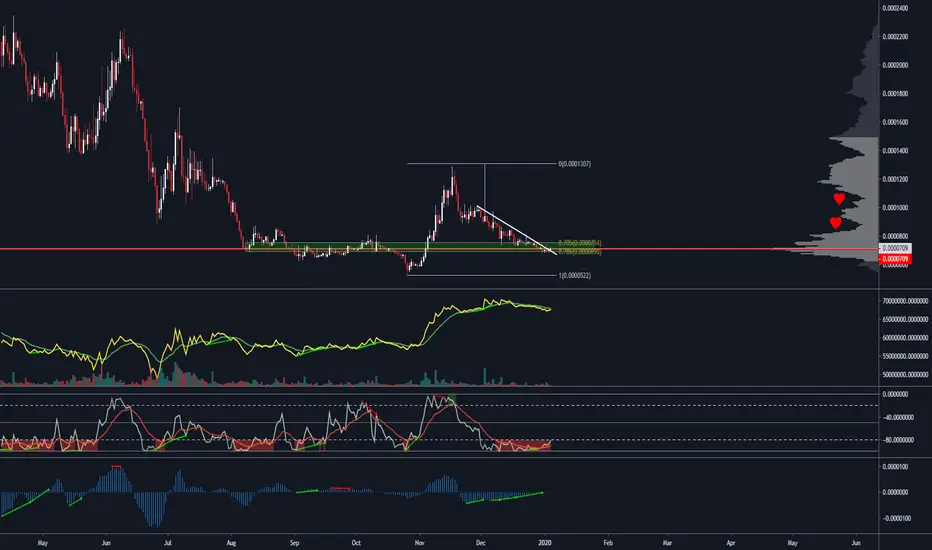
KMD/BTCKMD/BTC saw a bullish engulfing close above our 0.236 fib yesterday and is now seemingly breaking out of this falling wedge; oscillators have also crossed bullish. We can anticipate this Fibonacci level@700-680 sats to provide some solid support for the short term, while the 800 sat zone should be respected as immediate resistance. Given the volume build up and technicals, we are bullish on this pair for the short/mid-term. I have indicated some additional resistance levels on the chart that you can use as take-profit levels.\
- Happy Trading , Fat Pig Team

komodo breakout komodo breakout here and this is one of the best investment for short time ( choppy market )
Buy : 715 - 730 #hold
Stop : 7%
Target : 800 , 850 , 900

kmd chart update now kmd try to break fallen wadge ..
target
1) 0.00001000sats
2)0.00001400sats
3)0.00002800sats
KMD/BTC - Sitting on the runway (awaiting take off)As one of the older Binance coins, Komodo takes a bit more time to rock and roll than some of the newer listings. However, don't let that deter you at these levels! We know from previous rises in price that when this one goes, it really flies.
My reasoning:
Location: Reload zone
Structure: Double bottom off the 786 fib.
Divergence: Confirmed histogram div and stupid willy. Want to see a stronger move from the bulls on the daily OBV as we're still trading under its 13EMA.
Trend: Broken through the bearish trend line , entering a brief accumulation period.
VPVR: Holes in volume above 816 sats and above 1000 sats. Sitting at the POC.
Hit the LIKE button if you like my analysis and want to support my channel. Follow to make sure you don't miss any future trade ideas.
KMDBTC formed bullish BAT | Upto 80% move expectedPriceline of world's 66th ranked cryptocurrency Komodo (KMD) has formed bullish BAT pattern and entered in potential reversal zone.
This PRZ area should be used as stop loss in case of complete candle stick closes below this zone.
Lets have a look on the move of price action to see how perfect this pattern is driven:
After initial leg (X to A) the A to B leg is retraced between 0.382 to 0.50 Fibonacci and then B to C leg is projected between 0.382 to 0.886 of A to B Fibonacci projection area and last leg (C to D) is retraced between 0.786 to 0.886 Fibonacci and now the price action is moving in potential reversal zone of this bullish BAT and now we can expect bullish divergence at any time which will lead the priceline between 0.382 to 0.786 Fibonacci projection of A to D leg , but if after this bullish divergence the candles sticks will be closed above the 0.786 Fibonacci projection area of A to D leg then it can also lead to the long term bullish move.
As per Fibonacci sequence method we can set our targets as below:
Buy between: 0.0000685 to 0.0000609
Sell between: 0.0000867 to 0.0001138
So thi chart would be a good long opportunity for upto 86% bullish move.
Regards,
Atif Akbar (moon333)

$KMD R/S flip w/ MACD cross on daily. $KMD looks ready for a good 30%+ run if we get a bounce here. Broke out of accumulation range a few weeks ago; this is a good spot for a retest entry. R/S flip w/ MACD bull cross on daily.


KMD breakout retest This is a nice s/r flip and reclaim of previous supply turned demand - looking for KMD to break higher from here
Trading.Associates for mentoring/TA

KOMODO: KMD will unmet expectation pull the price higher?Monthly:
1)Huge expectation from early 2018 never fulfilled. 2)Resistance drop was stronger than support drop. 3)Different green Setups - 2nd initiated a Countdown(bearish). 4)Price drop below the expectation last month(Nov). 5)This month(Dec) we have another support drop and in case of red 1 a potential to test resistance(0.0002833). 6)In case of trap will fail to close above the previous median(0.0002165). 7)21 months failed to close above arithmetic mean. 22 could potentially move above. 8)Global Oversell Support(red dotted line on 0.000239) is close to the point of current arithmetic mean. 9) Global Overbuy Resistance(green dotted line) significant drop.
Weekly:
Strong expectation pull the price higher few candles after the drop in a), b) and now we have same potential for c)
