CarMax, Inc.Key arguments in support of the idea.
Q1 results have room to surprise on the upside, supported by the rebound in U.S. used car prices.
KMX is trading below its historical valuation averages.
Investment Thesis
CarMax, Inc. (KMX) is the largest used car retailer in the U.S., with 789,000 vehicles sold in the 2025 fiscal year alone. KMX runs two primary segments: the sale and servicing of used cars, offered both online and in-store, and a financing arm that provides customers with credit options for vehicle purchases. CarMax, Inc. is one of the top three largest auto dealerships by market cap and a prominent player in the S&P 500 index.
U.S. auto prices are revving back into growth mode after the rollout of industry duties, potentially turbocharging KMX's revenue volumes. Used car prices in the U.S. saw a sharp rebound in April. The Manheim Used Vehicle Value Index jumped 2.7% month-over-month and 4.9% year-over-year to 208.2 — the highest reading since October 2023. We attribute the price surge primarily to industry-wide tariff restrictions that took effect on April 3. A 25% tariff on imported vehicles has now been in place for nearly two months, while additional duties on imported auto parts have been in effect for over three weeks. While U.S. automakers were granted some relief on parts imports, finished vehicle imports continue to face the full brunt of the new tariffs. Tariffs could tighten the supply of new vehicles, pushing their prices higher and potentially driving increased demand for used cars. CarMax's revenue shows a strong correlation with wholesale prices of used vehicles, as reflected by the Manheim Index. Consensus forecasts predict a 6.3% year-over-year revenue growth for Q1 of fiscal 2026, reaching $7.56 billion. However, we believe the actual result could come in at $7.70 billion, reflecting a more robust 8.3% year-over-year increase.
Higher sales volumes could drive stronger net profit growth through operational leverage. The company has consistently maintained a gross margin of 10%-11% in recent years, while its operating expenses have been more stable and less impacted by changes in sales volume. In the past two years, as CarMax’s revenue has dropped due to falling used car prices, the fixed nature of its operating expenses has weighed on its net profit. This year, we may see a reversal of that trend. With revenue and sales volumes on the rise, KMX's net profit could accelerate at a faster pace. Consensus estimates forecast CarMax's net profit for Q1 of fiscal 2026 to reach $190 million, marking a 25% year-over-year increase. We also believe there is a strong chance that the company’s net profit may exceed consensus expectations.
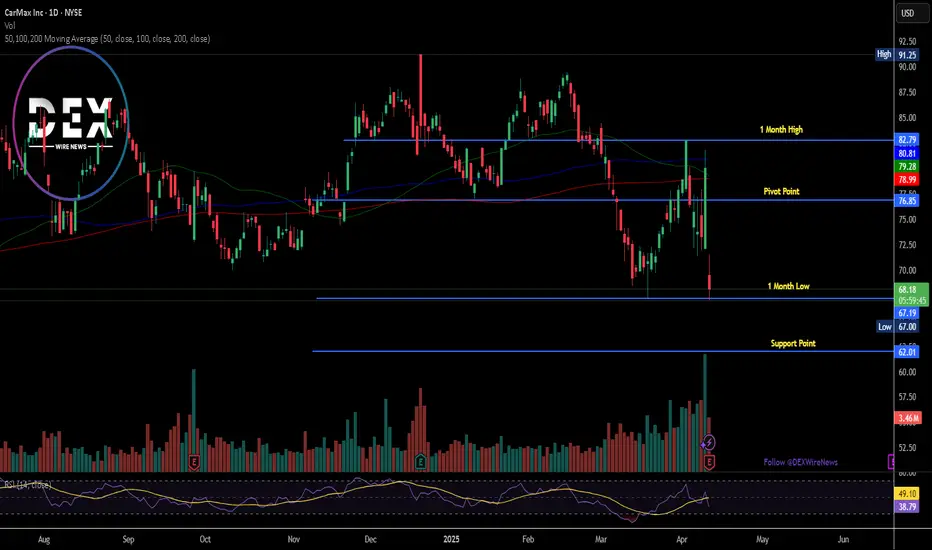
KMX’s valuation remains below its historical average. CarMax's average P/E multiple over the past decade has been 20x, compared to its current forward P/E of 18x. Since 2023, KMX shares have traded within a stable range of $60 to $88, and currently, the stock is positioned closer to the lower end of this range.
CarMax, Inc. shares might be gearing up for a bullish run in the near term, fueled by anticipated robust first-quarter results for fiscal 2026, expected to be released around July.
Our price target for KMX shares over the next two months is pegged at $77, with a "Buy" recommendation. To manage potential downside risks, we advise setting a stop loss at $59.90.
KMX

Breaking: CarMax, Inc. (NYSE: KMX) Shares Down Nearly 15% TodayShares of CarMax, Inc. (NYSE: KMX) tanked nearly 15% today amidst missing Fourth Quarter Profit expectation.
CarMax (KMX) shares dropped in premarket trading Thursday after the used-car retailer's fiscal fourth-quarter profit and used-vehicle sales came in below analysts' expectations.1
The Virginia-based company reported earnings per share (EPS) of $0.58 on net sales and operating revenue of $6.00 billion, both up from $0.32 and $5.63 billion a year ago.2 Analysts polled by Visible Alpha projected $0.68 and $5.99 billion, respectively.
CarMax sold a total of 301,811 used vehicles, including 182,655 retail and 119,156 wholesale units, each below consensus. Analysts were looking for 312,800 units of combined sales, consisting of 185,900 retail and 126,900 wholesale vehicles.
A year ago, CarMax said it expected to reach 2 million annual vehicle sales between fiscal 2026 and 2030. It said that before it reached that unit figure, it expected annual revenue to reach $33 billion and market share of up to 10-year-old used vehicles to hit 5%.
Analysts have said both new and used cars are likely to become thousands of dollars more expensive as a result of the Trump administration's tariffs.
CarMax shares, which entered Thursday down 4% over the past 12 months, were down 8% immediately after the report. Last quarter, the stock surged as CEO Bill Nash said the better-than-expected results were helped by "a more stable environment for vehicle valuations.
KMX CarMax Options Ahead of EarningsIf you haven`t sold KMX before the previous earnings:
Now analyzing the options chain and the chart patterns of KMX CarMax prior to the earnings report this week,
I would consider purchasing the 70usd strike price Puts with
an expiration date of 2025-1-17,
for a premium of approximately $4.15.
If these options prove to be profitable prior to the earnings release, I would sell at least half of them.

CarMax Hits Speed Bump: Shares Drop 13% Amid Delayed TargetsCarMax ( NYSE:KMX ), the pre-owned vehicle giant, faces a bumpy road ahead as it misses analyst expectations for its fourth-quarter results and pushes back its long-term financial targets. The company's shares took a nosedive, plunging as much as 13% in premarket trading.
Blaming ongoing vehicle affordability challenges and inflationary pressures, CarMax ( NYSE:KMX ) now expects to reach its target of selling over 2 million combined retail and wholesale units annually between 2026 and 2030, a delay from its previous goal of achieving this milestone by 2026.
The ripple effect of CarMax's disappointing performance extended to other auto retailers like Carvana and AutoNation, which also saw declines in premarket trading.
Analysts express concern over the company's future prospects, with Truist Securities' Scot Ciccarelli cautioning that the recovery may not be as robust as anticipated. CFRA Research's Garrett Nelson highlights the impact of "higher-for-longer" interest rates on car sales volumes, exacerbated by inventory overhang on pricing.
The pandemic-induced surge in vehicle inventories has led to fierce competition among pre-owned retailers, driving down prices and squeezing profit margins. CarMax ( NYSE:KMX ), like its counterparts, now faces the challenge of balancing inventory levels and navigating the turbulent waters of inflation.
With CarMax ( NYSE:KMX ) warning of further profit-sharing revenue hits due to inflationary pressures, investors brace for continued turbulence in the used-car market. As the industry grapples with evolving dynamics, CarMax's ability to steer through these challenges will be closely watched by investors and industry observers alike."
Technical Outlook
CarMax ( NYSE:KMX ) stock is trading within the overbought region with a Relative Strength Index (RSI) of 27.23. The stock is trading below the respective Moving Averages further validating to the Bearish thesis.

KMX CarMax Options Ahead of EarningsIf you haven`t sold KMX before the previous earnings:
Then analyzing the options chain and the chart patterns of KMX CarMax prior to the earnings report this week,
I would consider purchasing the 80usd strike price Calls with
an expiration date of 2025-1-17,
for a premium of approximately $13.40.
If these options prove to be profitable prior to the earnings release, I would sell at least half of them.

KMX CarMax Options Ahead of EarningsAnalyzing the options chain and the chart patterns of KMX CarMax prior to the earnings report this week,
I would consider purchasing the 79usd strike price in the money Puts with
an expiration date of 2023-9-29,
for a premium of approximately $4.00.
If these options prove to be profitable prior to the earnings release, I would sell at least half of them.
Looking forward to read your opinion about it.

KMX CarMax Options Ahead of EarningsAnalyzing the options chain of KMX CarMax prior to the earnings report this week,
I would consider purchasing the 78usd strike price in the Puts with
an expiration date of 2023-6-30,
for a premium of approximately $3.30.
If these options prove to be profitable prior to the earnings release, I would sell at least half of them.
Looking forward to read your opinion about it.

KMX - Triple Bottom ReversalKMX has formed a triple bottom and is looking for another bull move towards the upper trend line in white.
A triple bottom is a very bullish pattern and i have shown the results with the bars pattern tool.
I expect a move up towards the white line.

KMX, 10d+/-48.81%falling cycle -48.81% more than 10 days.
==================================================================================================================================================================
This data is analyzed by robots. Analyze historical trends based on The Adam Theory of Markets (20 moving averages/60 moving averages/120 moving averages/240 moving averages) and estimate the trend in the next 10 days. The white line is the robot's expected price, and the upper and lower horizontal line stop loss and stop profit prices have no financial basis. The results are for reference only.

All set to hi 90?Once it stays above 60, in next 3 months it could hit 90. Its oversold and getting ready to bounce back.

KMX Carmax Slamming Into Multiple Supports Carmax is slamming head first into hidden support. Rainbow Theory is pointing out multiple items that should be noted.
RAINBOW PIVOT ORDERBLOCK SUPPORT
RSI X'S COLOR ROTATION
COLOR CANDLE ROTATION
RUNNER BOT BOTOM SIGNAL
Keep an eye on this setup and let us know what you think!

KMX - Major Uptrend RetestPrice briefly dropped below the uptrend line, just to sharply recover and allow further support to form along the upper trend line in white
Rectangles in green are zones where price moves along the Trend Line

VRM 35K calls block expiring soon! Extremely Bullish !!Yesterday i was amazed to see a block of 35K calls worth of $525K on VRM expiring May 20.
And i will explain to you why they might be extremely profitable!
Since its highs, VRM lost 97.76% of its value and it`s not a crypto, by the way, it`s a company that makes billions of dollars.
The calls are related to the first Quarter earnings on May 9, so they expire 11 days after the results.
What should we expect from the earnings?
- revenue growth! last quarter their Ecommerce revenue was $738.7 million, up 159% year over year; gross profit was also up a lot, 64% YoY!
- a strong financing business! On February 01, 2022, Vroom announced the successful completion of its acquisition of United Auto Credit Corporation (UACC), a proven leader in automotive finance for $300 Mil.
Soon after the news above was released, on 2/3/2022, Bank of America set a price target for VRM of $30.00
So how come it is trading at $1.62???
Well, 27.11% of the share float is Shorted!
Big institutional owners like Vanguard, Blackrock, Morgan Stanley, JPMorgan Chase have average entries at $40!
And many of them had recently averaged down their investment, like Goldman Sachs which reported on 2/17/2022 an increase of 104.5% in their ownership in VRM, respectively 1,753,977 shares worth $18.93Mil for a total of 1.281% of the company. Their average is now $22.55.
So if they are happy with a 22 average, how come we don`t we buy it at $1.62?
VRM has a Price to book ratio of 0.24 now.
A P/B ratio less than 1 means that the stock is trading at less than its book value, it`s way undervalued!
the Price to Sales ratio is only 0.07! By comparison, its rival, CVNA (Carvana), has a P/S of 1.16.
Based on Q4 Financials, If they liquidated the inventory, cash in on all receivables and pay off the
$600M senior note, each shareholder will receive approximatively $6.5 per share.
If we look at the daily timeframe, VRM formed a falling wedge pattern which is extremely bullish as you know, on an oversold area, 25 on the RSI.
Institutional ownership in VRM is high, 92.19%
52 Week Range 1.58 - 48.80
Market Cap of only $235.47Mil! Can be a buyout at this point!
2021 Revenue: $3.18Bil
All things considered, fundamental and technical analysis, i think that the 35K calls will be in the money, extremely profitable, by the time of expiration.
My short term price target for VRM is $5.5, i think it`s trading so low because it`s heavily shorted by the hedge funds, to have a better average on their entry.
Looking forward to read your opinion about it!

Buy KMX 3/1/2022You can buy KMX target 142.11 stop loss 121.93
Money management your responsibility.
I recommend entering a maximum of 10% of the portfolio.
Good luck

Possible Swing Idea On Carmax or #KMX.I spotted a potential Swing Idea on KMX. I'm eyeing 140-145 calls. I haven't determined an expiration date yet, but I'm aiming for next month, maybe even Dec. depending on the contract prices.
I also have a 1hr markup which is showing me a possible bounce coming off the 200MA. WIll this happen anytime soon, that I don't know.
However, I'm liking the pullback to support on the Daily, with the 1hr chart confirming that area of Support as well. Still, I'll be patient and wait for a clean entry above 138.55, which will be the confirmation bar on the Daily Chart and will trigger my entry for the 140-145 calls for a Swing Play.
On management, I plan on watching for price reaction at 140(psychological level). If price continues that sequential move back up, just as price sold off in a sequential manner, I will hold for the completion of sed move back to 143-145. If price stalls at 140, I may look to reposition and wait for a break over 140 for the next possible leg up. Granted this is all theory, but a TRADING PLAN as well. My thought process in looking for plays is: Look for reasons not to take a trade..If there isn't one, get prepped!"
If this play dies & never alerts my entry, then I keep it moving. No harm no foul. The beauty of Swing Trading, if you can read the chart, you can sometimes see the move coming a mile away, you just NEVER jump the gun.
Entry- IDENTIFIED
Stop Loss- IDENTIFIED
EXIT(s)- IDENTIFIED
Risk Management/Risk To Reward Ratio- IDENTIFIED
There goes FOMO, GREED & FEAR & here comes the thought process of a calm & confident Trader. Win, Lose or Breakeven..I Identified my play & built a plan around it. All that's left to do now, is manage the trade when it becomes time to manage the trade, & not profit watch!

How CarMax could reach it's estimated 6.5% move into earningsAccording to the option market, KMX is looking to make a 6.5% move based off of $133. This meaning 6.5% to the upside or downside is expected.
Due to the current set-up, in my opinion CarMax could reach that 6.5% before earnings rolls out on Thursday.
Demand above $134 could trace a realistic move to test $138-$139 by earnings, and has room to even create a healthy shot above $140 before a pullback.
$132 downside confirmation is set for current stop loss (current lower-side demand)


KMXI WOULD GO SHORT UNDER 92. LEVELS BELOW ARE 89, 85
GO LONG OVER 100
TRADE IDEA: 90P 10/2. BID/ASK: .65/.85

Bearish looking Upward wedgeIf you look at the 1M and 1W, you will see solid resistance and at the 1W you can see kind of like an upward wedge and a red inverted hammer wick. Zoom in a little to 1D and we will see kind of like an upward wedge formation going on, and that it is currently retracing from resistance, but some consolidation here could happen. From here on we will need to wait a few days, perhaps until next week or so to see what will happen next because nothing is guaranteed.
I am looking for a nice short entry at the 1H...

KMX - DAILY CHART Hi, today we are going to talk about CarMax and its current landscape.
CarMax is poised to receive increasing attention from the market as relevant events are taking place. The company reports its earnings on Friday before the opening bell.
With a good year, this report could be an event that will boost its positive momentum. The auto retail company has been the sector spearhead. With solid fundamentals, the company can continue to be benefited from the changes that e-commerce has inflicted on the automotive retail industry, which has been responsible for a small percentage of the sales, holding them a huge potential of growth.
Thank you for reading and leave your comments if you like.
To have access to our exclusive contents, join the Traders Heaven today! Link Below.
Disclaimer: All content of Golden Dragon has only educational and informational purposes, and never should be used or take it as financial advice.

Three Percent Trade Idea: Go long KMXHere is a great opportunity to pick up KMX .
At Three Percent Trades we have a price target of $96.00 / share, which is a potential upside of 9.9%.
We use a combination of fundamentals & technical analysis to trade high probability set-ups, and believe this is a great opportunity to take advantage.
