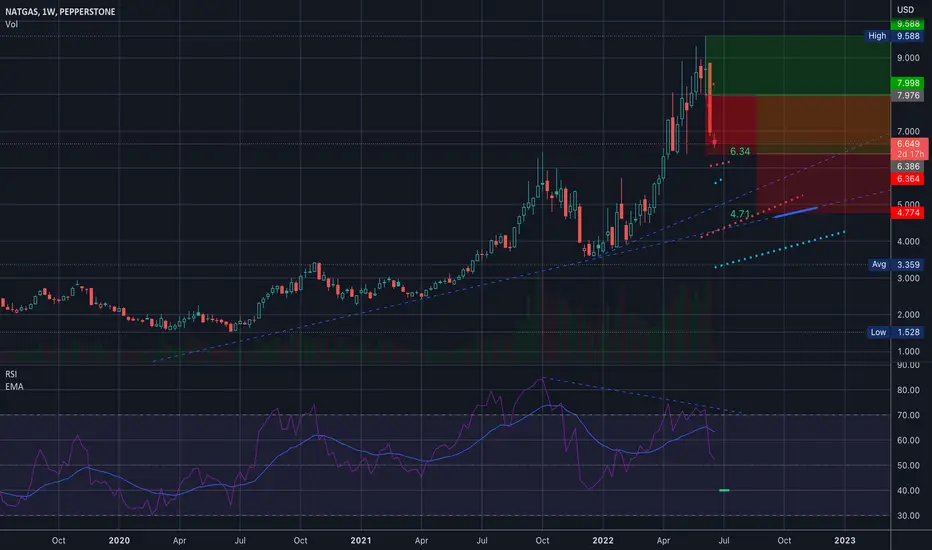
Natural Gas NG
Wait for a serious pullback, we need to respect the fact that this entire move is being retraced....
KOLD

XNGUSD ready to reverse recent downtrend LONGGLOBALPRIME:XNGUSD
XNGUSD a few weeks back downtrended afer breaking the neckline of a head and shoulders pattern down to
the support of a double bottom formed in early August. Volume profiles are added to the 30 minute chart.
I see an uptrend retracement of the recent downtrend and accordingly the following:
Stop Loss at 7.64 just below the recent swing low
Target 1 8.59 the bottom of the high volume areas and near the Fib 0.382
Target 2 8.84 just under the Fib 0.50
Target 3 9.15 just under the POCs of the volume profiles and the neckline of the head and shoulders pattern.
Fundamentals: decreasing DXY will cause a relative rise in commodities; winter is coming storage of compressed NG
is underway and increasing demand.
All is all, this forex pair is ready for a long trade.

BOIL beginning a round bottom reversal LONGAMEX:BOIL
BOIL a triple leveraged ETF based on natural gas as a commodity and its futures
on the 15-minute chart has begun a round bottom reversal into an uptrend. The AO / Candle indicator
confirms this as does the curve of the accumulation /distribution indicator. Fundamentally, natural gas price
is rising especially with the DXY dollar value in a mild correction. Winter heating season is upcoming and the energy
crisis in Europe accelerating with Russia shutting down ( for now only ?) its remaining active pipeline.
Right now long BOIL looks to be an excellent setup.

BOIL Leverage 3X Natural Gas ETF Cup and Handle LONG AMEX:BOIL
BOIL is showing a cup and handle pattern at present
lending increased probability of a bullish continuation
that could yield a 50% price rise over the 45-day width of
the cup. Macro and fundamental factors support ongoing
natural gas price escalations including the supply issues
in Europe, the heat wave from climate change causing
and so on. The cup and handle on a relatively long time
frame increases both its reliability and the time period
for which the pattern to play out.

BOIL / GUSH RATIO- Leverage 3X Natural Gas ETFsAMEX:BOIL
BOIL is the #X leveraged ETF for Natural Gas while KOLD is it inverse.
On this 30M chart I setup the ration between BOIL and KOLD.
This is to find precise swing entries without a lot of work for those only trading part time like myself.
At the highs, BOIL has peaked relative to KOLDAccordingly, this is the time to exit BOIL and enter a position
on KOLD. Conversely, when the ratio is at an inflection bottom, a trader should exit KOLD
and enter a BOIL position.
This chart shows several patterns including:
a double or triple top which may breakdown as there is a newer cup and handle potentially breaking
out above the handle in continuation of the prior uptrend. It the present chart, the Bollinger Band basis line
the uptrending of its boundaries and the MACD all favor the probability of an uptrend., the spot markeri
All in all, I am waiting to buy BOIL since natural gas is being liquified and shipped to Europe to
make electric power to supply to air conditioner for the long hot summer. XNGUSD has had dramatic
action in the past couple of months, all good for BOIL's price action.
Three evening stars or three-bar plays marked with red down arrows.
If not in a position at present, the chart should be observed for the cup and handle pattern completion
towards a resumption of the uptrend. IF so, a BOIL position could be entered.
If it fails the triple top controls the price action and
a KOLD position could be entered.
This chart demonstrates the importance of looking for patterns to help guide
higher probability setup.

$NATGAS $KOLD $BOIL Analysis, Key levels & Targets$NATGAS $KOLD $BOIL Analysis, Key levels & Targets
No game plan yet… but I’m looking…
Short Opportunity in NG1!Little updates on Natural Gas...
Forming Rising Wedge - Bearish Pattern
RSI Divergence - Bearish
PPO Divergence - Bearish
Waiting for the break of the Trendline!

UNG Short SetupUNG is forming Rising Wedge
Long term we can see its forming a perfect Bearish Head and Shoulder pattern
Short term target is at $23
Mid Term target is $21
Long Term target is at $12

XLE XES Bearish Pattern in Play (Bearish)Clearly there is a Bearish Divergence on XLE and XES on RSI and PPO
On Weekly time frame as well, there is negative divergence
Risk to Reward clearly favors Short Opportunity

NG1! Head and Shoulder Bearish PatternA little updates on Natural Gas for those who are following NG1! and UNG closely
Now we are seeing tons of Bearish pressure on Nat Gas on Weekly, Daily and Hourly TF.
Chart shows a possible Bearish Head and Shoulder pattern for NG1!
Also we are seeing tons of Bearish Divergence on RSI and PPO

Bearish if no one buys at 8 I personally believe it will fall next week to $6.9.
Even with 2.5% or 5% equity risk with 2 or 3 leverage, this is a good trade to be on the short side.
What do you think?

Short Setup on NG1!, UNG, BOILExcellent short setup on Natural Gas!
Waiting for the 7.5 Level to Short!
Also SUMMER is here in USA and across the Globe...

Short Setup for Natural GasNatural Gas Short Setup in hourly time frame
Fundamentally also in aligns with the technical analysis
Its about time and Summer is very close.

$UNG $KOLD $BOIL Key Levels, Analysis, & Targets$UNG $KOLD $BOIL OMG Key Levels, Analysis, & Targets
Try it, Natty… hit 40 (ung) and I’ll short the hell out of you…

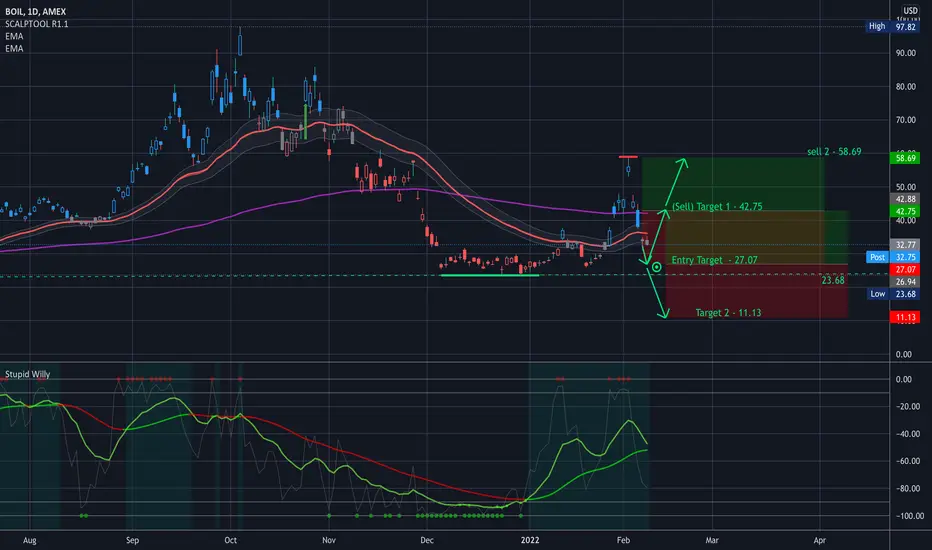
WATCHING $BOIL for entry at 27.07WATCHING $BOIL for entry at 27.07
Watching Natgas on the pullback… If it retraces back to the entry… I will take a position, for a potential 58% upside to sell target 1…
Support is slightly under, and double target at 11.13
Let’s see what happens…
——————
I am not your financial advisor, but I will happily answer questions and analyze to the best of my ability but ultimately the risk is on you. Check out my ideas, but also do your own due diligence.
I have a huge tolerance for volatility so please know that. If you’re new to my trade setups please try them on a small scale first. Then go in with a risk you’re comfortable with.
I am not a bull. I am not a bear. I just see what I see in the charts and I don’t pay too much attention to the noise in the news.
If you want me to analyze any stock or ETF just leave me a comment and I’ll do it if I can. (If I have time)
And most importantly… Have fun, y’all!!
(\_/)
( •_•)
/ >🚀
KOLD bounceKOLD bouncing exactly from my support box (.66, s/r, bottom of channel, POC, anchored VWAP) back into low volume area. Looking to trade up to last consolidation zone.

Gaslights OutIn the beginning, of the year, it was time to buy for the Summer.
Now, Summer is here and here we are.
Price has overshot and with plenty of gas in storage, it's time for me to short the Summer contract here.
Short August(Q)
Long NG Equities

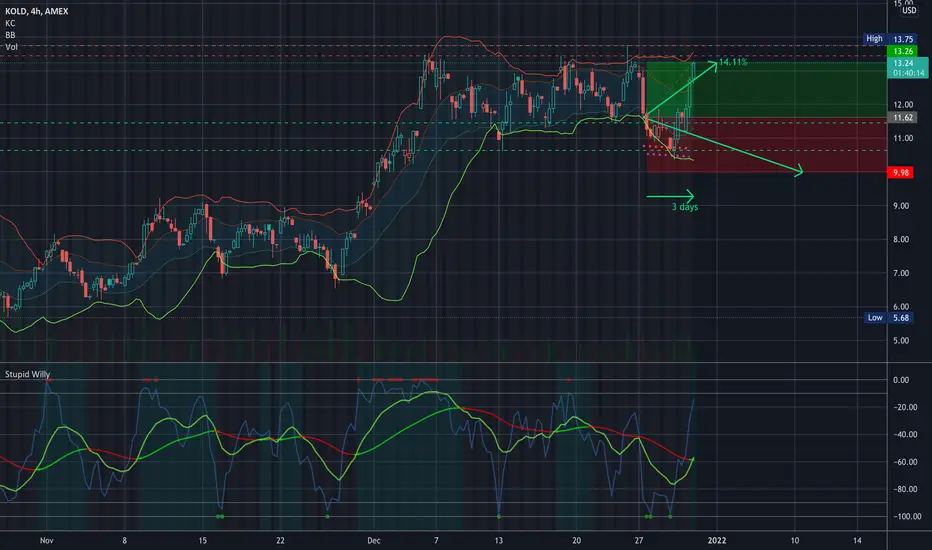
BOOOOM - Target Hit $KOLD in 3 days for 14.11%BOOOOM - Target Hit $KOLD in 3 days for 14.11%
Wooooot!!! That is all…
KOLD - Our Biggest Bet YetWhat is KOLD?
KOLD is 2x bear Natural Gas ETF that moves based on the price of Natural Gas futures.
Natural Gas futures shot up to insane levels this year, and we believe that natural gas prices will drop very quickly.
Natural gas futures usually rally 3-4 months before winter starts.
This is because energy providers across the world are trying to price in a good deal for when the winter season comes.
Now that winter is here and will be over quickly due to global warming, Natural Gas prices are dropping fast.
Making KOLD gain quickly.
We've been buying KOLD since it was $7, and slowly adding in at $8,$11,$12.
We will be adding more as this is one of our biggest positions.

𝗡𝗮𝘁 𝗚𝗮𝘀 𝗨𝗽𝗱𝗮𝘁𝗲: $NG_F Daily. H&S into NovemberFirst week of November has been the short past two years. Have been patiently watching this one and can see a H&S setting up. Major down TL on monthly ~6.5 otherwise large breakout
$UNG $BOIL $KOLD #NatGas #OOTT #Commodities #Trading

KOLD LongLooking like this could be the bottom if prices hold. Will be a good position to hold for a couple years. Could get ugly if NATGAS gets above $6 again.

KOLD - I'M BACK. Ok... so I started a 3% position here 😬
Look... I've made so much trading NatGas and lost most of it... LOL... so follow me at your peril... LOL
BUT... I feel that this might be a great place to start a position.
——————
I am not your financial advisor, but I will happily answer questions and analyze to the best of my ability but ultimately the risk is on you.
My average is in Grey
Red = Resistance
Green = Support
Blue = trendlines
Have fun, y’all!!

𝗡𝗮𝘁 𝗚𝗮𝘀 𝗨𝗽𝗱𝗮𝘁𝗲: $NG_F Weekly. Breakout ... If closes over ~4.93 resistance we'll have a breakout that suggests it'll run to 6.10-6.30 area. Has peaked first week of November the past two years
$UNG $BOIL $KOLD #NatGas #OOTT #Commodities #Trading
