KMD possible inverse H&SOpium for Komodo with this possible inverse H&S.
Komodo is a tech monster, slowly starting to gain more and more attention with ambitious objectives like 1 million tx/sec on its blockhain. One of my favorite altcoin.
Komodo

KOMODO: 1 MILLION TPS & Z-K PROOFS - PROFIT = 32.50% !!!Our "Crypto Bottom" Trade Indicator has correctly identified a buy in point on the 3rd of August 2018 .
Using this buy in point and selling at today's peak price as identified by our NEW "Crypto Peak" Trade Indicator , you would have expected to net 32.50% PROFIT!!!
The increase in price may also be explained by positive developments including:
February 23 2018: Komodo announces that it has performed an atomic swap between Ethereum and Dogecoin using BarterDEX, Komodo’s decentralized exchange. BarterDEX features 100+ coins and will grow to support 1000+ cryptocurrencies once we fully integrate the ERC20 tokens into the DEX.
March 16: Komodo announces that its BarterDEX supports 95% of All Coins in Existence.
March 27: Komodo Platform, a blockchain industry leader and pioneer of the innovative atomic swap technology, is entering a strategic partnership agreement with ValueNet Capital, a venture capital fund based in Beijing. The agreement is focused on decentralized initial coin offerings (dICOs). Komodo Platform is one of the world’s first platforms to allow entrepreneurs and business owners to launch completely independent blockchains. Business leaders who launch an independent blockchain on the Komodo Platform may subsequently sell their blockchain’s coins to the public via a dICO.
May 22: China’s Blockchain Rankings Puts Komodo in the Top 5 Blockchain Platforms.
June 7: BarterDEX, Komodo’s decentralized exchange, has recently been added to Blockfolio.
(NEW) July 7: Komodo announces it plans to reach 1 million tps using its Federated Multi-Chain Syncing technology. This aims to increase the scalability of the blockchain.
(NEW) July 9: Komodo announces plans to add Cross-Chain Smart Contracts functionality to it's blockchain. This aims to increase the interoperability of the blockchain.
(NEW) July 11: Komodo announces plans to Zero Knowledge Proofs functionality to it's blockchain. This aims to increase the privacy of the blockchain.
The price increase is the result of the positive developments outlined above and a recovery in the crypto markets.
***The "Crypto Bottom" and "Crypto Peak" crypto trading indicators used in this analysis is included as part of the Crypto Trade Signals subscription (check my signature for more information)***


Komodo is also a bargain buy right now, 200-300%?Hello people,
As already explained in the BTC post on TradingView, I'm assuming that the G20 event is going to trigger another run on the fields for the altcoins and the whole crypto market. Why? We've seen a huge run up with the futures earlier (BTC 20k). The scenario is called: buy the rumour, sell the news. Currently we see a huge dump going in to a significant big event for the market (and a small dump after): sell the rumor, buy the news.
Right now one of my favourites: Komodo.
Against BTC it's approaching a very important support zone (posted on Twitter). On USD the same applies here. Depression phase with strong falling wedge and in the last drops some more falling wedges created + support area in USD from the rally before the rally initially started.
Also. This is against USD. If you assume that Komodo is going towards $4 from here, without moving in BTC value, then BTC has to go to $22.300 from here, unlikely, right?
Indicators:
WAN/USD:
1 Day: Strong bullish divergences on RSI, Stoch, MACD and histogram.
2 Days: Very strong on the 2 days as well.
3 Days: Bullish divergences everywhere too.
4 Days: Bullish divergences Histo, Stoch, MACD and RSI.
5 Days: Histo bullish divergence, MACD postivie cross. Stoch bottomed out.
1 Week: Same as on 5 Days.
Same conclusion on KMD/BTC. 3 Days RSI no bullish divergences, but turning here in the next few days creates one on the Stoch. RSI on 3D is <20.
Concluding from here we can combine the two charts and state that not only BTC is moving upwards, but the altcoins will follow in the next few weeks.
Main target zone for the disbelief phase for me is first around $3,50-4,00.

Komodo is also a bargain buy right now, 200-300%? Hello people,
As already explained in the BTC post on TradingView, I'm assuming that the G20 event is going to trigger another run on the fields for the altcoins and the whole crypto market. Why? We've seen a huge run up with the futures earlier (BTC 20k). The scenario is called: buy the rumour, sell the news. Currently we see a huge dump going in to a significant big event for the market (and a small dump after): sell the rumor, buy the news.
Right now one of my favourites: Komodo.
Against BTC it's approaching a very important support zone (posted on Twitter). On USD the same applies here. Depression phase with strong falling wedge and in the last drops some more falling wedges created + support area in USD from the rally before the rally initially started.
Also. This is against USD. If you assume that Komodo is going towards $4 from here, without moving in BTC value, then BTC has to go to $22.300 from here, unlikely, right?
Indicators:
WAN/USD:
1 Day: Strong bullish divergences on RSI, Stoch, MACD and histogram.
2 Days: Very strong on the 2 days as well.
3 Days: Bullish divergences everywhere too.
4 Days: Bullish divergences Histo, Stoch, MACD and RSI.
5 Days: Histo bullish divergence, MACD postivie cross. Stoch bottomed out.
1 Week: Same as on 5 Days.
Same conclusion on KMD/BTC. 3 Days RSI no bullish divergences, but turning here in the next few days creates one on the Stoch. RSI on 3D is <20.
Concluding from here we can combine the two charts and state that not only BTC is moving upwards, but the altcoins will follow in the next few weeks.
Main target zone for the disbelief phase for me is first around $3,50-4,00.

$KMD, Weekly Wick Fill To 18000
Weekly
Looking at our trend timeframe we see price has came up to 28000 to test for resistance, and has since been retracing towards the downside. Stochastic RSI showing momentum in favor of the bears, next major support level at 15000. Expecting KMD to fall to 18000 at the bare minimum because of last week’s wick needed to be filled.
Daily
Shifting over to our pattern timeframe we see price respecting a bearish parallel channel, now looking to find support at the bottom of our channel. Stochastic RSI showing momentum has peaked and we should see momentum temporarily head towards the downside.

There is a possibility for the beginning of uptrend in KMDBTC Technical analysis:
. KOMODO/BITCOIN is in a downtrend and beginning of uptrend is expected.
. The price is below the 21-Day WEMA which acts as a dynamic resistance.
. The RSI is at 30.
. While the RSI downtrend #1 and the price downtrend in daily chart is not broken, bearish wave in price would continue.
Trading suggestion:
. The price is in a downtrend and we forecast the uptrend would begin.
. There is a possibility of temporary retracement to suggested support zone (0.000226 to 0.000178). if so, traders can set orders based on Price Action and expect to reach short-term targets.
Beginning of entry zone (0.000226)
Ending of entry zone (0.000178)
Entry signal:
Signal to enter the market occurs when the price comes to "Buy zone" then forms one of the reversal patterns, whether "Bullish Engulfing" , "Hammer" or "Valley" in other words,
NO entry signal when the price comes to the zone BUT after any of reversal patterns is formed in the zone.
To learn more about "Entry signal" and the special version of our "Price Action" strategy FOLLOW our lessons:
Take Profits:
TP1= @ 0.000278
TP2= @ 0.000325
TP3= @ 0.000400
TP4= @ 0.000472
TP5= @ 0.000551
TP6= @ 0.000660
TP7= @ 0.000880
TP8= Free


$Komodo W/ Wings...Wait... $KMD
Weekly
Looking at our highest timeframe we see KMD has been in aggressive downtrend since December 2017, lower high recently formed back in April 2018. Stochastic RSI showing us momentum is heading towards the downside. Potential double bottom formation at 35000.
Daily
Shifting over to our pattern timeframe we see price has broke out of its descending wedge, only to find resistance at 45000. Lower highs were formed at 44000 and slightly above 40000. Stochastic RSI showing sun momentum looking bullish. A daily close above 35000 activates our trade.
Conclusion
After daily close above 35000

KMD got me ALL bothered. if you aren't bagging up Komodo right now, you are playin yourself! not only does KMD reward you for holding, its also gonna go up in value. double whammy. 10. 20. 40% gains possible short term like week or so.
15,644% gains for hodl masters
HYPERDEX GONNA BE AWESOME. CHECK IT OUT.
i probably wont sell what i buy until the end of the year fiasco. and then only to BUY MORE AT THE DIP. HODLLLLL

KMD KOMODO- simple chart short term bearish, long term bullish5/22/18
- KMD currently bound in this symmetrical triangle and heading to logical support levels at 3350-3100 (entry point)
- then we'll need to see a break above the symmetrical triangle to consider a bullish reversal pattern
* This is not financial advice, I am not a financial advisor. Just a noob learning about charting*

KOMODO_1D_BINANCE* One of the few that hasn't had a decent run yet
* Reaching end of triangle
* About to break RSI-14 downtrend
* Volume increasing
Targets going in to June:
T1: 67580 sats
T2: 79500 sats
T3: 96490 sats

KOMODO: NEW DEVELOPMENTS 24 HOURS = 42.15% PROFIT!!!Our " Crypto Bottom" Trade Indicator has correctly identified a buy in point on the 11th of May 2018.
Using this buy in point and selling at today's peak price, you would have expected to net 42.15% PROFIT!!! IN 24 HOURS!!!
The increase in price may also be explained by positive developments including:
March 8: Komodo announces first dICO with it's partner BlocNation.
March 16: Komodo announces that its Atomic Swaps cover 95% of All Coins in Existence.
March 27: Komodo Platform enters into a strategic partnership agreement with ValueNet Capital, a Chinese venture capital fund.
May 4: Komodo announces first batch of the swaps made with the web dICO app have been processed.
May 6: CryptoLark reviews Blocnation a token distributed on the Komodo Platform.
May 7: Komodo announces the World's first Atomic Swap between RLTYtoken (RLTY) and Komodo Platform (KMD) completed and added on BarterDex
May 9: Komodo Platform announces release of BarterDEX. It has added the following coins: $CIX $RLTY $PCL $GAME.
May 9: GameCredits (GAME) has officially been added to Komodo Platform's BarterDex.
May 10: Komodo announces that BarterDEX (their decentralised exchange) has hit 100,000 atomic swaps.
May 11: AltcoinBuzz (Youtube Personality) publicises Komodo Platform's use for ICOs and DICOs.
May 12: GameCredits ($GAME) has officially been added to BarterDEX.
May 12: Utrum Raises 12% of ICO Soft Cap in First 24 Hours using the BarterDEX.
May 12: Announcement of imminent release of HyperDEX which useses the underlying Komodo Platform BarterDEX protocol.
May 12: China announces that the Komodo Platform will be among 28 projects to be rated by China's new rating system.
Analysis reveals that a combination of these developments together a broader recovery in the broader cryptocurrency markets has led to increase in the price of Komodo.

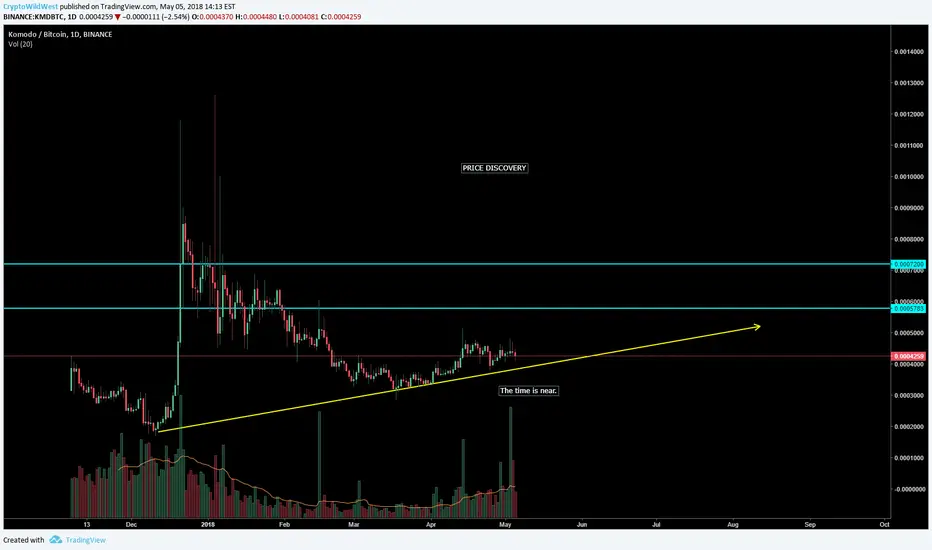
Komodo Dragon Awakens From it's Slumber!Komodo, a valuation that has stayed in constant harmony with it's usd counterpart.
The BTC ratio has been on a steady growth since the launch of this coin.
An actual company with a longstanding history.
Targets are blue.
As always risk only what you are comfortable and good luck!


Kmd bullish double bottomAs you can clearly see kmd forming a double bottom.
Buy:40k
T1:43K
T2:46K
T3:50K
Potential profits 30%


Komodo would probably resume its uptrend again...Technical analysis:
KOMODO/BITCOIN is in a range bound and Resumption of up trend is expected.
The price is above the 21-Day WEMA which acts as a dynamic support.
The RSI is at 58.
Trading suggestion:
The price is in a range bound, but we forecast the uptrend would probably resume.
There is possibility of temporary retracement to suggested support zone (0.000326 to 0.000278), if so , traders can set orders based on Daily-Trading-Opportunities and expect to reach short-term targets.
Beginning of entry zone (0.000326)
Ending of entry zone (0.000278)
Entry signal:
Signal to enter the market occurs when the price comes to "Buy zone" then forms one of the reversal patterns, whether "Hammer" or "Valley" , in other words,
NO entry signal when the price comes to the zone BUT after any of reversal patterns is formed in the zone.
To learn more about "Entry signal" and special version of our "Price Action" strategy FOLLOW our lessons:
Take Profits:
TP1= @ 0.00040
TP2= @ 0.00045
TP3= @ 0.00052
TP4= @ 0.00059
TP5= @ 0.00066
TP6= @ 0.00088
TP7= Free
