DOT breakout: new ATH soon!DOT breakout; easy LONG, keep an eye on the resistance box, if we turn it into support we'll set a new ATH.
Fundamental: Go Polkadot, one of the best projects in crypto! That's it.
IMPORTANT: this is not financial advice, invest or trade at your own risk.
KSM

$KSM - $USDT daily chart -- bullishKSM-USDT daily chart :---
There is SR flip for the previous top. and the ascending trend line looks intact. A bounce from here and KSM could be at 400$ in no time.
do your own research before investing. **

KUSAMA FLYING OFF KUSAMA
I am really really bullish on this project.
To me this will outperform most of the other projects during this bullrun.
Growth is natural and demand will only increase with the Parachain slot auction.
Teams can create a #crowdloan campaign for a parachain slot to attract external $KSM holders to lock up $KSM for the project’s auction bid. Rewards for the supporters of the bidding project may be the project token, or may be other incentives besides tokens.
The Dot ecosystem is planning to lease up to 100 parachains.
Watch Kusama fly and DOT follow up next.
Is it still late to get in, not yet, but this may be our last chance for someone looking for a safe 2x. - I’ve set some buy orders at 400$ - 390$ and 380 $. Hopefully we could get down there and wish some early investor take some EARLY profits (which shouldn’t happen now imo)
I am personally holding this one until scarcity is reflected on price. Which would be around TP3 = 930$ (APPROX)
The canary is flying up to the moon.
Cheers

KSM.USDT (P21.P2.E1).Looking for next candleHi Traders,
KSM or Kusama has a obvious structure that can break to the upside or downside.
If BTC holds 60K, you can be sure its to the upside.
I believe BTC will hold 60K for a while longer, come Monday...that is another question.
An no, I don't think it will drop back deep but we will have volatility which is not good for the ALTs.
All the best,
S.SAri

Hitchhiker's guide to $BTCThis is how you stack sats. There's HODLING, but then there's compounding multiples over time ever increasing your $BTC holdings. Profits should be taken into USD and adding to long-term BTC/ETH holdings (if you're a HODLER/Bitcoiner). Without a weekly close above 58k, I prefer chop/range bound 40-58k, with a final washout to 38-39k to eliminate paper hands before skyrocketing to new ATH's.


KSMUSDT (KUSAMA) - BIG MOVE ANALYSIS 🔎
- KSMUSDT is consolidating in a symmetrical triangle pattern .
- A relatively big move is imminent.
POSSIBLE PRICE ACTIONS
- Uptrend ⬆️: breakout above the symmetrical triangle's inclined resistance.
- Downtrend ⬇️: breakdown below the symmetrical triangle's inclined support.
TARGETS 🎯
- Uptrend ⬆️: Horizontal resistance levels (R1, R2, R3).
- Downtrend ⬇️: Horizontal support levels (S1, S2).

Kusama// Update KSM has been able to show some resilience over the past few days relative to the other Alt coins. Fundamentally, I believe it will continue to grow in price, due to reasons mentioned on the chart.
Technically, we are still on an uptrend, and holding above a strong area of support. If price does happen to close below this level, there is still the 38, 50 and 61% levels to break through before heading to the trend line.
As with any trade, its best to react, rather than predict. So as time goes on and we see more confirmation of trend continuation. I will be looking for long opportunites. Check comments for previous analysis.
Let me hear your thoughts on what you think will happen next.

$KSM/USDT 2h (Binance Futures) Desending wedge breaking outKusama is looking bullish again after that break-out, let's enter here!
Current Price= 224.844
Buy Entry= 225.523 - 220.523
Take Profit= 241.768 | 273.560 | 299.970
Stop Loss= 207.968
Risk/Reward= 1:1.25 | 1:3.36 | 1:5.11
Expected Profit= +25.20% | +67.98% | +103.50%
Possible Loss= -20.25%
Fib. Retracement= 0.5 | 0.786 | 1
Margin Leverage= 3x
Estimated Gain-time= 10 days

🆓Kusama/USDT Analysis (28/2) #KSM $KSMThe selling pressure is dominated and very strong, so it may make KSM lose the 200$ support zone, and that would be a bearish sign
If KSM can stop the decline at this 200$ zone, we could see a recovery to 240$ zone, this would be the strongest resistance in this situation
📅NEWS
👉Mar 31 : Kusama Deployment
📈BUY
-Buy: 135-145$. SL if B
-Buy: 95-105$. SL if B
📉SELL
-Sell: 195-205$ if B. SL if A
♻️BACK-UP
-Buy: 195-205$ if A. SL if B
-Sell: 235-245$. SL if A
-Sell: 280-290$. SL if A
-Sell: 340-350$. SL if A
❓Details
Condition A : "If 1D candle closes ABOVE this zone"
Condition B : "If 1D candle closes BELOW this zone"

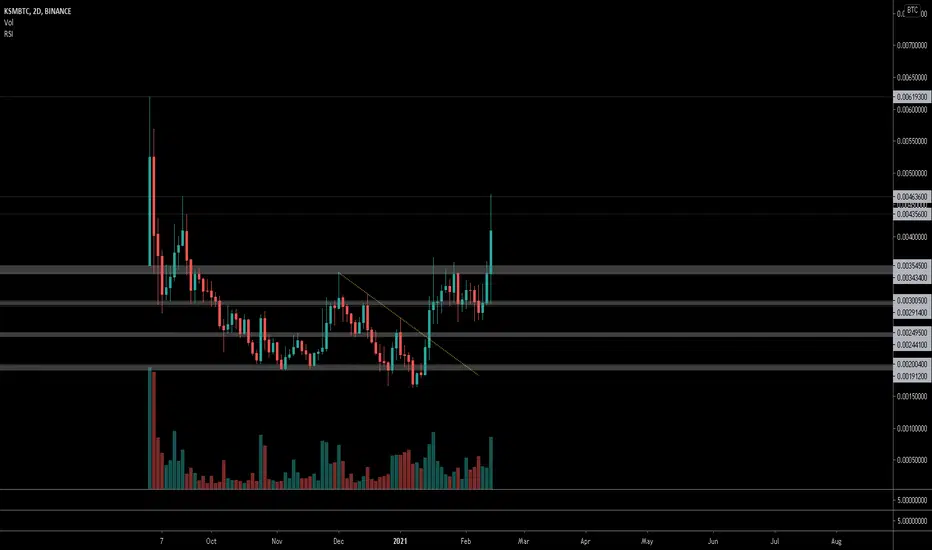
KSMBTC new ATH or Correction?The KSMBTC pair is trading around it's ATH level.
If we look at charts we can see a bearish divergence on the daily chart.
We can see higher highs in price but also see lower highs on the indicators.
This is a sign that there's a weakening of the current trend and a possible reversal.
Target for pullback is the green box
Let's see how this plays out.

$KSM/BTC 1h (Binance Spot) Rectangle breakout and retestKusama broke bullish and is accumulating above the box, trend continuation is likely.
Current Price= 0.004909
Buy Entry= 0.004906 - 0.004826
Take Profit= 0.005270 | 0.005736 | 0.006289
Stop Loss= 0.004542
Risk/Reward= 1:1.25 | 1:2.69 | 1:4.39
Expected Profit= +8.30% | +17.88% | +29.24%
Possible Loss= -6.66%
Fib. Retracement= 0.618 | 1 | 1.414
Margin Leverage= 1x
Estimated Gain-time= 5 days

$KSM needs to bring some price action VERY soon 🧨I would be surprised if this tanks. The testing of new highs looks very bullish.
Let's see how this will play out ⚡️

KSM/USDT BUY SIGNALA little bit late on signal, although KSM still is very bullish and had very little pullback compared to many other altcoins.

💡 It's a great buy opportunity in KSMBTC @kusamanetworTrading suggestion:
. There is a possibility of temporary retracement to suggested support line (0.00361). If so, traders can set orders based on Price Action and expect to reach short-term targets.
Technical analysis:
. KSMBTC is in an uptrend and it is expected to continue the trend.
. The RSI is above the uptrend at 68.70.
Take Profits:
TP1= @ 0.00461
TP2= @ 0.00500
TP3= @ 0.00530
TP4= @ 0.00570
TP5= @ 0.00615
TP6= @ 0.00690
SL= Break below S2
❤️ If you find this helpful and want more FREE forecasts in TradingView
. . . . . Please show your support back,
. . . . . . . . Hit the 👍 LIKE button,
. . . . . . . . . . . Drop some feedback below in the comment!
❤️ Your Support is very much 🙏 appreciated!❤️
💎 Want us to help you become a better Forex trader?
Now, It's your turn!
Be sure to leave a comment let us know how do you see this opportunity and forecast.
Trade well, ❤️
ForecastCity English Support Team ❤️

💡 It's a great buy opportunity in KSMBTC @kusamanetworTrading suggestion:
. There is a possibility of temporary retracement to the suggested support line (0.00361). If so, traders can set orders based on Price Action and expect to reach short-term targets.
Technical analysis:
. KSMBTC is in an uptrend, and it is expected to continue the trend.
. The RSI is above the uptrend at 68.70.
Take Profits:
TP1= @ 0.00461
TP2= @ 0.00500
TP3= @ 0.00530
TP4= @ 0.00570
TP5= @ 0.00615
TP6= @ 0.00690
SL= Break below S2
❤️ If you find this helpful and want more FREE forecasts in TradingView
. . . . . Please show your support back,
. . . . . . . . Hit the 👍 LIKE button,
. . . . . . . . . . . Drop some feedback below in the comment!
❤️ Your Support is very much 🙏 appreciated!❤️
💎 Want us to help you become a better Forex trader?
Now, It's your turn!
Make sure to leave a comment. Let us know how do you see this opportunity and forecast.
Trade well, ❤️
ForecastCity English Support Team ❤️

Polkadot (DOT)Salve
Dr.Gavin is the Beast
Dot tg 45--50--60--70----100
Polkadot is a platform that allows diverse blockchains to transfer messages, including value, in a trust-free fashion; sharing their unique features while pooling their security. In brief, Polkadot is a scalable heterogeneous multi-chain technology..
Buy
bye!

KSMUSDTPrice trending since Febuary 15th with higher highs and a higher lows. Looks to be a good trade with price now retracing to the 50% fibb line of the B-C move with confluencw with the Febuary trendline, momentum begining to shift to the upside indicates potention price movement higher to the 127.2% fibb extension of the A-B-C move.

$KSM, Looking strong today w/ a new volume spike..$KSM
Looking strong today w/ a new volume spike..
Almost at price discovery against /btc
UCTS Bullish across multiple timeframes (bot took the trade on the breakout (1D Buy) and currently 15% up..)
Let see how far it can go
#KSM
$KSM - infinity bidding started The Tradingview mods might complain about not enough explanation
We're in a rising sector
I can push out any chart with a Long investment strategy.
Silly "Chartists"

KSM/USD Long limit entryEnter long limit 142,5
SL 132,5
PT1 166
PT2 189
BE 156
RRR 2:1
BINANCE:KSMBUSD

#ksmusdt #dailyHi guys..its the latest analyze chart of KSMUSDT in daily timeframe .if you are interested any crypto that you want analyze with me and any questions please do not hesitate and comment below the chart!
if u like it press like-comment and folow me.thx

