KSM is about to end his trending down soonI think KSM is about to end his trending down soon.
In short times KSM in a descending channel.
In long times KSM is in button line of his ascending channel.
I think maybe it is best time to buy KSM because KSM has no way to go except UP
KSMUSDT

KSM Long HereKSM Sitting in the Symmetrical Triangle
RSI Moving ABOVE Based MA
Expecting a push and break above the falling resistance trendline

KSMUSD D2: 300% gains XABCD BEST LEVEL TO BUY(SL/TP)(UPDATE)Why get subbed to me on Tradingview?
-TOP author on TradingView
-2000+ ideas published
-15+ years experience in markets
-Professional chart break downs
-Supply/Demand Zones
-TD9 counts / combo review
-Key S/R levels
-No junk on my charts
-Frequent updates
-Covering FX/crypto/US stocks
-before/after analysis
-24/7 uptime so constant updates
🎁Please hit the like button and
🎁Leave a comment to support our team!
KSMUSD D2: 300% gains XABCD BEST LEVEL TO BUY(SL/TP)(UPDATE)
IMPORTANT NOTE: speculative setup. do your own
due dill. use STOP LOSS. don't overleverage.
🔸 Summary and potential trade setup
::: KSMUSD 2days/candle chart review
::: updated/revised outlook
::: still great setup for 300% gains
::: speculative XABCD setup in progress
::: BULLS get ready to BUY LOW point C
::: from my level TP +300% gains
::: this is BUY/HOLD setup
::: patient traders only
::: not for gamblers
::: SPECULATIVE SETUP
::: do your own due dill
::: and use proper risk management
::: TP bulls is +300% gains 850 USD
::: details: see chart
::: FINAL TP +300% gains point D
::: recommended strategy: BUY/HOLD
::: SWING TRADE: BUY/HOLD IT
::: bull run not over yet
::: good luck traders!
::: BUY/HOLD and get paid. period.
🔸 Supply/Demand Zones
::: N/A
::: N/A
🔸 Other noteworthy technicals/fundies
::: TD9 /Combo update: N/A
::: Sentiment mid-term: BULLS/PUMP/point D
::: Sentiment short-term: BEARS/PULLBACK/point C
RISK DISCLAIMER:
Trading Crypto, Futures , Forex, CFDs and Stocks involves a risk of loss.
Please consider carefully if such trading is appropriate for you.
Past performance is not indicative of future results.
Always limit your leverage and use tight stop loss.


LONG KSMUSDT | LONG KSM / USDT | Elliott Wave ImpulsiveThis can be an opportunity to take advantage of the last wave of the impulsive Elliott Wave Pattern.
Entry Price: 308.7
Target Profit: 347.7
Stop Loss: 302.6
Ratio Risk / Reward ≃ 6.30
Potential Profit: 12.54%
This could be a good opportunity associated with a margin position as the ratio risk/reward is good.


KSM Kusama Pullback LONG !KSM Kusama seeing some great resistance as the confluence of 50, 100, 200 EMAs around the 330 price level.
Price action showing long bearish wicks at this area, validating this area as strong resistance.
We look for a pullback down to the fib retracement of 0.618 @ 290 - 300 price level (white zone)
SL below the bullish wick of 23 Dec @ 267.5, where going below this level will give us invalidation of higher lows.
TP 1 @ 330
TP 2 @ 368
Do like and comment your thoughts if you liked my content, follow me for fast updates on any real time trades.
Thank you for your support!

KSMUSDKSMUSD 2days/candle chart review. still great setup for 350% gains. XABCD setup in progress. BULLS get ready to BUY LOW point C. this is BUY/HOLD setup. patient traders only. not for gambler. TP bulls is +350% gains 850 USD. FINAL TP +350% gains point D. SWING TRADE: BUY/HOLD IT. bull run not over yet.

$KSM Idea going into Q1My thoughts on KSM going into 2022. The fundamentals are looking very nice to allow this to happen.

KSMUSD D2: 350% gains XABCD BEST LEVEL TO BUY(SL/TP)(NEW)Why get subbed to me on Tradingview?
-TOP author on TradingView
-2000+ ideas published
-15+ years experience in markets
-Professional chart break downs
-Supply/Demand Zones
-TD9 counts / combo review
-Key S/R levels
-No junk on my charts
-Frequent updates
-Covering FX/crypto/US stocks
-before/after analysis
-24/7 uptime so constant updates
🎁Please hit the like button and
🎁Leave a comment to support our team!
KSMUSD D2: 350% gains XABCD BEST LEVEL TO BUY(SL/TP)(NEW)
IMPORTANT NOTE: speculative setup. do your own
due dill. use STOP LOSS. don't overleverage.
🔸 Summary and potential trade setup
::: KSMUSD 2days/candle chart review
::: updated/revised outlook
::: still great setup for 350% gains
::: speculative XABCD setup in progress
::: BULLS get ready to BUY LOW point C
::: from my level TP +350% gains
::: this is BUY/HOLD setup
::: patient traders only
::: not for gamblers
::: SPECULATIVE SETUP
::: do your own due dill
::: and use proper risk management
::: TP bulls is +350% gains 850 USD
::: details: see chart
::: FINAL TP +350% gains point D
::: recommended strategy: BUY/HOLD
::: SWING TRADE: BUY/HOLD IT
::: bull run not over yet
::: good luck traders!
::: BUY/HOLD and get paid. period.
🔸 Supply/Demand Zones
::: N/A
::: N/A
🔸 Other noteworthy technicals/fundies
::: TD9 /Combo update: N/A
::: Sentiment mid-term: BULLS/PUMP/point D
::: Sentiment short-term: BEARS/PULLBACK/point C
RISK DISCLAIMER:
Trading Crypto, Futures , Forex, CFDs and Stocks involves a risk of loss.
Please consider carefully if such trading is appropriate for you.
Past performance is not indicative of future results.
Always limit your leverage and use tight stop loss.

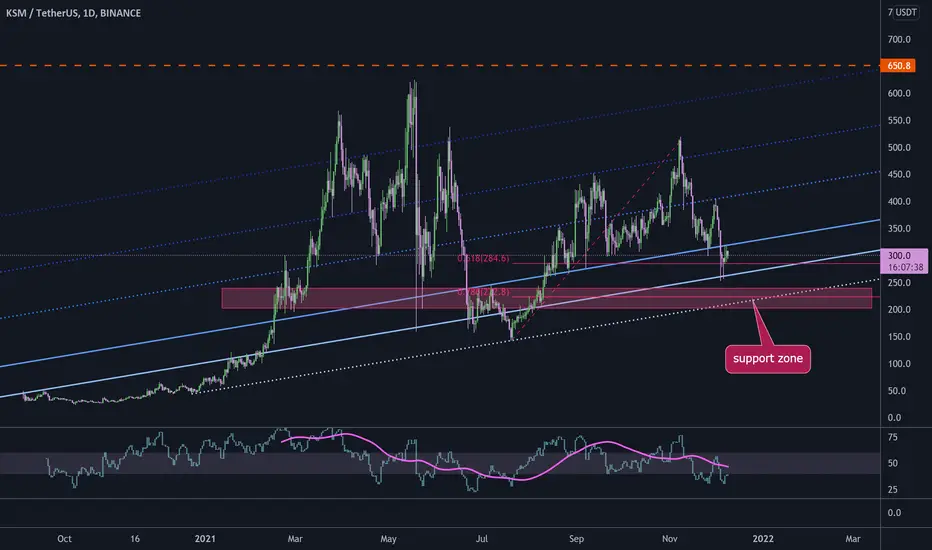
KSM potential to increase 100% to 190%#KSM/USDT
$KSM hold above long term ascending support that is the same with 0.618 fib level of last swing high.
it is possible to have another leg down to touch 0.786 fib level that is the same with a major support zone.
by the way if price bounce from here or $223, it will go up to ascending trend lines to reach $650.
KSMUSDT - Long💡💡#SIGNAL 💡💡
KSM / USDT
▶️ Buy NOW (30%) + 335.6 (70%)
🔴 SL - 319
Let's try the head and shoulders pattern
#KSMUSDT_4h_281121

KSM Getting readyKSM still doesn't look very bullish, but I think now is a great time to buy.
It just needs to break the green line upwards to start a good uptrend.

KSMUSDTOne of the good currencies of market that breaks out the triangle and has a high growth potential.
good luck ;)

KSM (kusama) bullish set-upKSMUSDT is looking bullish as it established a strong support above 392 and ready to march towards 480.
KSM is currently undergoing ABC correction. Presently, we are riding the B impulsive wave and found a stable support above one of the strong previous swing lows at 392 level. As long as we stay above this price , it makes sense to target 480. Nonetheless, if we see a throwback to anything lower than 392 with a couple of 4hr candles below, it means that the C corrective wave of the ABC correction is playing out, in which case the trade gets invalidated and gives us a fantastic chance of entering KSM at a discounted price.
If we remain strong and have a daily close above the ATH , we can expect new ATH's going forward.

KSM/USDT analysis on 4H Time FrameKSM/USDT is on trend line which show neutral behavior either break trend line then opening a short position is a good option for profit and if not break the trend line we have a good long opportunity for profit..
Always do your own research before going to trade this is not a financial advice

KSMUSDT Perfect breakout & Retesting KSMusdt is looking great and has taken a perfect retest to buy zone $450 and you are in the game. Keep your eye on that level and fill your bag for the moon ride.

$KSMKSM retraced from breakout, good to test buy imo.
3 target prices. Sell 1/3 value on each. I see this going way more up -- re: KSM parachain auction success

KSM to $742Based on my TA, KSM is in its second cycle and currently we are in wave 3.
So, I'd look to enter around: $475.5 - $483
SL: $424
tp1:$539.8
tp2:$614.6
tp3:$742.9

KSM analysis Time to ta ke a short position
Ksm took a big shoot so it need a little correction
Targets are according to fib retracement
Risk -- High

KSMUSDTToday ksm make break of structer in h4 time frame. Now wait for mitigate price to order block zone the find a entry point and get a buy trade with proper money managment. Good luck


KSM in the flag pattern.Parachains are up and running and Dot is on the verge of Price-discovery; Kusama is Bullish than ever!
It's currently unlikely to break the resistance
Now is the time to buy and hold. But when it was in the support zone.
personally have already bought it and as long as it's on this Sideway channel, I'll buy more KSM within the support range and sell some of them in the resistance Until it breaks resistance upwards.
Please Note: Nothing is certain and the final decision is Bitcoin! So always put SL or take some profit.
