The beginning of the upward trend of the KSM currency#KSM time 1W currency analysis
Considering the favorable chart conditions and the creation of the classic inverted head and shoulder pattern in the weekly time, we can expect a good growth from the created support range of $25, and the long-term price target is the resistance level of $200.
KSMUSDT

KSMUSD 1WKSM ~ 1W 📈
#KSM We Found a H&S Pattern Formed Here. Gradual buying is the best way to follow this bull pattern.

KSM LOOKS BEARISH (1D)KSM with wave C can sweep the liquidity pools on the left side of the chart and reach the green box in the coming days and weeks.
For risk management, please don't forget stop loss and capital management
Comment if you have any questions
Thank You

#KSM/USDT#KSM
The price is moving in an upward channel on a 1-day frame and we have a support area in green at the 34 level
We have a higher stability moving average of 100
Now we have a nice breakout coming up
Our RSI indicator has a well reliable upward trend
Entry price is 58.70
The first goal is 62.42
The second goal is 68.53
The third goal is 75.43

#KSM/USDT#KSM
The price is moving in a bearish channel on a 4-hour frame.
The price is moving within it and adhering to it to a large extent. We have a support area in green, from which it rebounded at the $40 level.
We have a higher stability moving average of 100
We have a downtrend on the RSI indicator that supports the rise and is about to break higher
Entry price is 47.38
The first goal is 47.00
The second goal is 52.00.
The third goal is 58.00

KSMUSD 1WKSM ~ 1W 📈
#KSM Make purchases gradually after successfully breaking through this resistance line, with a target of at least 20%++ from here. The bulls will start to dominate after breaking through this resistance line.

KSMUSDT Elliott Waves AnalysisHello friends.
Please support my work by clicking the LIKE button👍(If you liked). Also i will appreciate for ur activity. Thank you!
Everything on the chart.
wanna see last upward movement in wave of v
Entry: market and lower
Targets: 64 - 67 - 70
after first target reached move ur stop to breakeven
Stop: (depending of ur risk). ALWAYS follow ur RM .
risk is justified
Good luck everyone!
Follow me on TRADINGView, if you don't want to miss my next analysis or signals.
It's not financial advice.
DYOR!

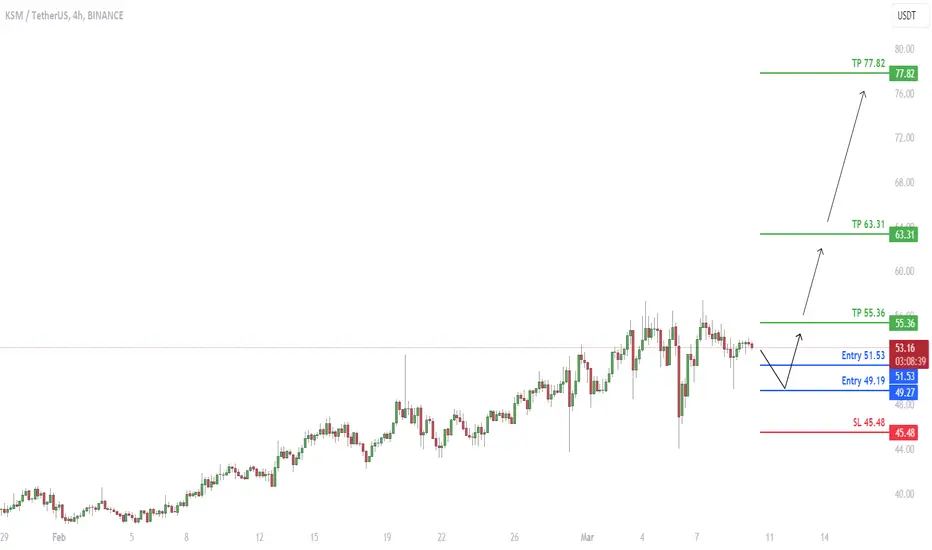
KSM has formed a Bullish patternKSM has formed a Bullish pattern
🔵Entry Zone 49.19 - 51.53
🔴SL 45.48
🟢TP1 55.36
🟢TP2 63.31
🟢TP3 77.82
Risk Warning
Trading Forex, CFDs, Crypto, Futures, and Stocks involve a risk of loss. Please consider carefully if such trading is appropriate for you. Past performance is not indicative of future results.
If you liked our ideas, please support us with your likes 👍 and comments.
KSMUSDT Elliott Waves (Local Setup)Hello friends.
Please support my work by clicking the LIKE button👍(If you liked). Also i will appreciate for ur activity. Thank you!
Everything on the chart.
Entry: Market and lower
Targets: 55 - 63 - 70
after first target reached move ur stop in breakeven
Stop: under 35 (depending of ur risk).
RR: 1 to 3
ALWAYS follow ur RM.
risk is justified
Good luck everyone!
Follow me on TRADINGView, if you don't want to miss my next analysis or signals.
It's not financial advice.
Dont Forget, always make your own research before to trade my ideas!
Open to any questions and suggestions

Alikze → KSM | Dynamic trigger supportIn daily and 4h time, it is moving while maintaining the dynamic trigger. Targets will be available if it stabilizes above $40. In the 4-hour time, maintaining $40 will conquer the $45 area, and in the daily time, with the break of the $45 range, the path for the next area, as well as the supply area of the previous major ceiling, and then the most important resistance to reach the ceiling of the channel will be the $50 range. .
🟩Sup: 40$
⛳️Tp 1:45
⛳️ Tp2 :50
⛳️ Tp3 : 85
-----------------
Please support this idea with a LIKE and COMMENT if you find it useful and Click "Follow" on our profile if you'd like these trade ideas delivered straight to your email in the future.
Thanks for your continued support.
Sincerely.❤️

KSM/USDT Keep an eye on the demand! Price rejected on the supply💎 KSM has recently demonstrated significant market dynamics, experiencing a rejection at the supply area. There's potential for the price to undergo a downward retracement and retest the demand zone around the 37.7 area to establish new momentum.
💎 Alternatively, if KSM manages to break out above the supply area without a retest, it probability could signal a move towards our target area.
💎 However, KSM must bounce from the demand zone and resume its upward trajectory in an attempt to break above the resistance level. Failure to do so could result in a breakdown below the demand zone, leading to further downward movement towards the support area.
💎 The support area holds significant importance as it represents the last line of defense for bullish momentum. If this area fails to hold and KSM breaks below it, it could signal a continuation of the downward trend.

KSM Waiting the buy zoneKusama is in a strong bear trend, and it's breaking support over support. I identified a strong accumulation zone on higher timeframe at 29-32 USD. I expect the price to slowly come there, and after some accumulation it should bounce. I'll wait the price there before open any trades

KSM/USDT upward momentum from demand zone? 👀KSM Analysis 💎 Paradisers, focus on #KSMUSDT, as it's currently exhibiting indications of a significant movement from an essential demand level.
💎 #Kusama is on a rising trajectory, suggesting a possible bullish break from its present demand zone. The expectation is for a retest of the demand level at $40.56 before it continues its upward journey. If #KSM successfully sustains above this level, it could pave the way for a climb towards the major supply zone at $63.04.
💎 However, if #KSM faces challenges in maintaining its stance above the $40.56 mark, we might need to rethink our trading strategy. Under such circumstances, our attention would shift to potentially starting a bullish movement from a lower bullish Order Block (OB) level at $33.52.
💎 It's crucial to keep a close watch on this level, as a breach below it could lead to a significant downward trend.

KSM/USDT Perfectly Bounce. It's ready for back to upward ??💎 KSM's market performance has been turning heads, especially with its recent vigorous rebound marked by a robust green candle at the demand zone. This rally suggests a potential uptrend, directing attention to the supply area as the next significant hurdle.
💎 A successful breach of this supply threshold could propel KSM towards a strong resistance target, probability indicating a sustained bullish run.
💎 On the flip side, should KSM struggle to puncture through the supply area, it might retreat to the demand zone for another attempt at gathering momentum. The demand zone thus becomes a pivotal region to watch. KSM's ability to either sustain its position or falter here could be telling of its short-term market direction.
💎 If KSM fails to maintain its ground in the demand area and succumbs to a breakdown, a bearish scenario may unfold. Such a development could lead KSM to spiral downwards, potentially hitting lower support levels or revisiting previous demand zones.
💎This phase is critical for KSM; maintaining buoyancy in the demand zone could be the key to averting a downward spiral and setting the stage for a recovery and possible bullish surge.

#KSM/USDT LONG#KSM
The price has been moving in a reversal bearish flag since last February and the downtrend of the flag has been broken.
We have oversold on MACD
And the moving of the 100 thousand was broken up
The resistance area was reached and rebounded from it
Current price 25.68
First Goal 36.80
This represents 160% of the current price

#KSMIn the 2-hour and 4-hour timeframes, after a Sharpie growth, a zigzag correction has already been carried out, which is placed in the corner, which should probably have an unsuccessful exit from the top, and then continue the correction in the specified areas for a complete cycle. complete a 5-wave movement that after the completion of the last wave, we should see an X wave upwards.
In addition, contrary to this move, the 4-hour candle above $50 should be closed.

KSM/USDT Potential for Bullish Movement? 👀🚀 KSM Analysis💎 Paradisers, direct your attention to KSMUSDT, as it is currently demonstrating noteworthy market activity. After being repelled from the supply zone, KSM is setting up for a potential bullish move from the demand zone.
💎 Analyzing Kusama's market progress, it has skillfully moved through a descending trendline, breaking above it to signal the start of an upward trend. At this critical point, KSM could potentially maintain its bullish path from the demand zone around $26.67, assuming it keeps up its current momentum.
💎Conversely, should KSM face challenges in holding this momentum, we could anticipate a bullish drive emerging from a lower support zone at $21.9.
💎 Traders should also be cautious of the scenario where KSM dips below the $21.9 support level, as this could suggest a change to a bearish trend.
💎 Stay vigilant and well-prepared, Paradisers. Your ParadiseTeam is dedicated to steering you through these market shifts, equipping you with the necessary knowledge for making strategic trading decisions.

KSM/USDT Perfectly Bouncing on the support area, Ready to up ?💎 KSM has been making waves in the market with a notable bounce off its support level, marked by a strong green candle. Should this bounce prove to be a valid indicator of momentum, the next key level for KSM is the supply area. Successfully breaking through this supply area, probability could smooth KSM's path toward our designated target area.
💎 However, if KSM struggles to break through the supply zone, there's a chance it might revert to retesting at the support level to gather new momentum for another upward attempt.
💎 The support area is a critical juncture for KSM. At this point, it's imperative for KSM to either achieve a strong bounce or risk breaking down below the support level. Should KSM fail to rebound and instead break down, it could potentially continue on a downward trend, moving further down and potentially reaching the demand area.

KSMUSDT Alert: Triple Top Signals Trend Shift📈 Overview:
Despite a bullish trend, KSMUSDT faces challenges with a triple top formation and a bearish divergence. The recent establishment of the first lower high (LH) adds to concerns.
📊 Technical Signals:
Triple top formation, LH, and bearish divergence indicate potential weakening in the bullish momentum.
📉 Trade Strategy:
Traders should exercise caution. A break below the last low may trigger a short position, with a predefined take-profit level.
🛑 Risk Management:
Implementing stop-loss orders is crucial to manage risks in the face of a potential trend reversal.
📉 Conclusion:
Monitor KSMUSDT closely for a break below the last low, signaling a possible trend reversal and offering a trading opportunity on the downside.

KSMUSDT.1DBased on the given market data, the KSM/USDT pair is currently trading at $52.86. The Relative Strength Index (RSI) for the 4-hour, 1-day, and 7-day periods are 71.47, 90.94, and 82.16 respectively, indicating that the pair is currently in an overbought zone. This may signal a potential pullback or price correction in the short term.
The Moving Average Convergence Divergence (MACD) for the 4-hour, 1-day, and 7-day periods are 5.57, 4.77, and 3.85 respectively. These figures indicate a strong bullish momentum in the market. The Bollinger Bands (BB) for the same periods are 64.50, 53.14, and 44.99 respectively, suggesting a high level of price volatility.
The pair has important support levels at $43.52, $35.05, and $29.93 for the 4-hour period, and $32.80, $21.64, and $19.10 for the 1-day period, and $25.13, $19.58, and $16.44 for the 7-day period. If the price breaks down these levels, it could lead to a bearish trend.
On the other hand, the key resistance levels are $56.32, $64.88, and $71.69 for the 4-hour period, and $57.39, $68.40, and $72.72 for the 1-day period, and $56.32, $72.89, and $108.00 for the 7-day period. If the price breaks above these levels, it could lead to a bullish trend.
In conclusion, although the KSM/USDT pair is currently in an overbought zone, the strong bullish momentum suggests that the pair might continue its upward trend in the short term. However, traders should be cautious about a potential price correction due to the overbought conditions. As always, it is recommended to use stop losses and take profits at strategic points to manage risk effectively.

#KSM/USDT#KSM
The price has been trading in a large bearish range since the beginning of the year
Recently, the bearish pattern was broken strongly
The rise is expected to continue for the coming period
From current price 21.65 $
With a target of 43.93 $
That is, approximately 200% expected goal
Supported by oversold MACD and high volume
and as usual follow your trading plan and manage your risk.
Be patient and good luck!
If you like this kind of analysis don't forget to like and follow

$KSM Touched 3rd Target & Our Trade Ended SuccessfullyHi everyone,
Well, NYSE:KSM touched the third target and our trade ended successfully.
Trade details :
🪙 KSM/USDT
💹 Binance
🛒 Entry
🟢 $23.59
💵 Targets
🔴 $32.38
🔴 $50.00
🔴 $63.92
⛔️ SL $16.53
📅 18/11/2023
I hope you have used this idea.
"Like" & "Follow " if you want to see more of these ideas.
Sincerely,
BJWise

$KSM Successfully Reached 2nd TargetHello everyone,
After reaching the first target, NYSE:KSM managed to reach the second target at the $50 level in less than 24 hours. According to that 100WMA is considered a major resistance for NYSE:KSM , if NYSE:KSM can cross it, I expect it to easily reach the 3rd target.
Do your own research, watch out & don't be greedy.
"Like" & "Follow" if you want to see more of these ideas.
Goodluck
