KSS Trading Guide 4/21/25Kohl's Corporation (KSS) Trading Analysis for Monday, April 21, 2025
Sentiment Analysis
----Overview: Sentiment on platforms like X and StockTwits leans bearish, driven by tariff concerns and Kohl’s weakening fundamentals, with projected sales declines of 5-7% in 2025. JP Morgan’s Underweight rating and $7 price target as of April 14 underscore margin pressures, though a ~12% dividend yield provides some appeal for income-focused investors.
----Implication: The prevailing negative sentiment, coupled with macroeconomic headwinds, is likely to exert downward pressure on KSS, overshadowing the dividend’s stabilizing effect.
Strategic Outlook
----Assessment: The outlook for Monday is bearish, fueled by significant put activity in weekly options, persistently oversold technical indicators without reversal signals, and a VIX at ~40, reflecting heightened market volatility.
----Implication: Anticipate a price range of $6.20 to $6.50, with a risk of breaching support at $6.20, potentially driving the stock toward $5.80 if bearish momentum persists.
Market Influences
----Overview: No new Federal Reserve decisions today; however, recent guidance on April 17 signals a cautious approach to rates, which could dampen retail spending. Kohl’s next earnings are scheduled for May 21, per TradingView data. Fitch Ratings downgraded KSS from BB to BB- on April 7, citing financial strain. Social media discussions on X, WallStreetBets, and StockTwits remain bearish, focusing on the impact of 10% baseline tariffs on margins. Additionally, the departure of Chief Technology Officer Siobhán Mc Feeney on April 1 introduces further uncertainty.
----Implication: The absence of positive catalysts, combined with tariff pressures and leadership changes, solidifies a bearish outlook for Monday.
Price Context
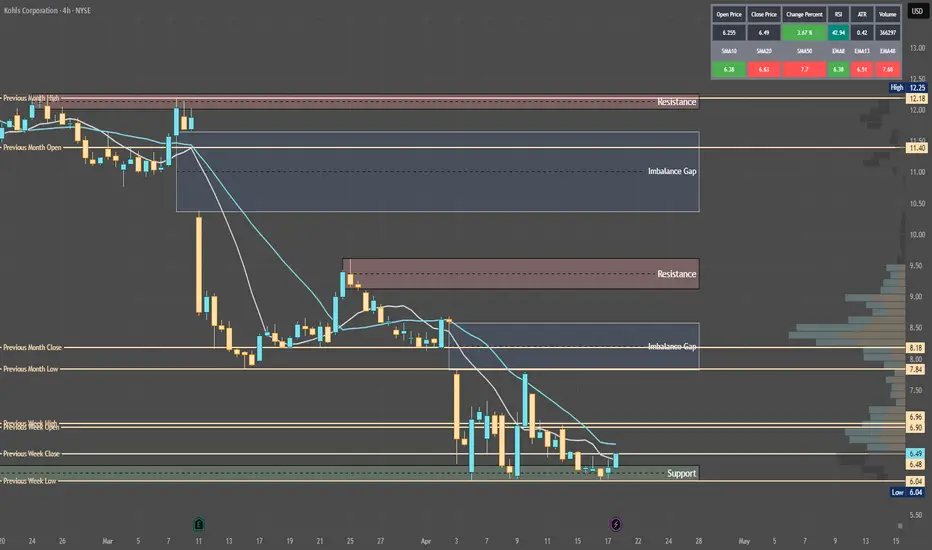
----Overview: Current price at $6.48. The stock has declined 21% over the past month from $8.20 on March 31 and is down 73% year-over-year from $23.94 in April 2024. Support lies at $6.20 (recent low on April 17), with resistance at $6.89 (April 14 open).
----Implication: Recent declines, driven by tariffs and executive turnover, suggest continued downward pressure, with a break below $6.20 likely to accelerate losses.
Technical Indicators
Monthly: RSI at 22 (oversold), Stochastic at ~12 (oversold), MFI at ~18 (oversold). Price below 10/20-month SMAs ($8.50/~$9.50, bearish).
Implication: Long-term bearish trend with extreme oversold conditions, yet no reversal signal is evident.
Weekly: RSI at 27 (oversold), Stochastic at ~17 (oversold), MFI at ~20 (oversold). Price below 10/20-day SMAs ($6.70/~$6.90, bearish).
Implication: Bearish trend confirms downside bias for weekly contracts.
Daily: RSI at 30 (nearing oversold), Stochastic at ~15 (oversold), MFI at ~22 (oversold). Price below 10/20-day SMAs ($6.40/~$6.50, bearish).
Implication: Daily trend supports weekly bearish bias.
4-Hour: RSI at 35 (nearing oversold), Stochastic at ~18 (oversold), MFI at ~28 (nearing oversold). Price below 10/20-period SMAs ($6.30/~$6.40, bearish).
Implication: Medium-term bias aligns with weekly outlook.
Hourly: RSI at 32 (nearing oversold), Stochastic at ~15 (oversold), MFI at ~25 (oversold). Price below 10/20-hour SMAs ($6.35/~$6.40, bearish).
Implication: Intraday bias supports weekly trade direction.
10-Minute: RSI at 38 (neutral), Stochastic at ~20 (oversold), MFI at ~30 (nearing oversold). Price below 10/20-period SMAs ($6.45/~$6.47, bearish).
Implication: Short-term bias reinforces weekly contract setup.
Options Positioning
Overview: Weekly options show high put volume at $6.50 (1,500 contracts, 70% at bid), with a put-call ratio of 2.5 (bearish) and IV skew favoring puts ($6.50: 50%, rising). Monthly options have a put-call ratio of 2.0, with put IV rising ($6.00: 48%). 3-Month options show a put-call ratio of 2.3, with put IV rising ($5.50: 45%). VIX at ~40 (down 5%, above 30-day average of ~35).
Option Flow Dynamics (OFD) Analysis:
Vanna:
Impact: -$0.10 intraday.
Insight: Rising put IV at 50% compels dealers to sell shares to hedge delta as IV increases, exerting downward pressure. A VIX of 40 heightens this effect.
Stance: Bearish for weekly contracts; neutral if IV falls below 48%.
Charm:
Impact: Pins price ±$0.05, adds $0.03 volatility.
Insight: High put open interest at $6.50 prompts dealers to sell shares to maintain delta neutrality near expiry, pinning the price with minor volatility.
Stance: Bearish for weekly contracts; neutral if price holds $6.50.
GEX (Gamma Exposure):
Impact: Pins price ±$0.10, adds $0.05 volatility.
Insight: Negative gamma from elevated put open interest drives dealers to sell shares on price declines, pinning at $6.50 while adding volatility on breakouts.
Stance: Bearish below $6.50 for weekly contracts; neutral at $6.50.
DEX (Delta Exposure):
Impact: $0.20-$0.30/day downward pressure.
Insight: High put open interest creates a delta imbalance, compelling dealers to sell shares on price drops, adding consistent downward pressure.
Stance: Bearish for weekly contracts, particularly on high volume.
OFD Summary: Weekly flows signal a bearish bias, with $0.30-$0.50 downward pressure driven by Vanna and DEX selling. Pivot at $6.50; weekly range $6.20-$6.50 (pinning). A VIX of 40 amplifies downside risk, and a break below $6.20 could trigger $0.15 volatility (GEX). Monthly and 3-month expiries, with put-call ratios of 2.0 and 2.3, provide bearish confluence.
Implication: Bearish bias for weekly contracts; elevated VIX suggests downside volatility, with a $6.20-$6.50 range for Monday.
ICT/SMT Analysis
Overview: Weekly: Bearish, support at $6.20, resistance at $6.89, SMT divergence versus WMT confirms weakness. Daily: Bearish, FVG $6.50-$6.89, OB $5.80. 4-Hour: Bearish, MSS below $6.48, liquidity below $6.20. 1-Hour: Bearish, MSS below $6.48, liquidity below $6.20. 10-Minute: OTE sell zone $6.50-$6.60 (Fib 70.5%), target $6.20.
Implication: Bearish across all timeframes; a breakdown below $6.20 is likely, aligning with the weekly contract setup.
Edge Insights
Dark Pool Activity: Large sell orders at $6.50 in recent dark pool prints (April 18) indicate institutional bearishness, potentially increasing selling pressure if retail traders follow suit on Monday.
Sector Dynamics: The consumer discretionary sector is down 17.8% year-to-date (Morningstar); Kohl’s heavy reliance on imported goods amid tariffs makes it more vulnerable than peers like Walmart, which benefits from stronger domestic sourcing.
Short Interest Pressure: Short interest at ~45% of float (MarketBeat) raises the risk of a short squeeze if the price breaks above $6.89, though current momentum favors shorts targeting $6.20.
Implication: Institutional selling and sector weakness reinforce the bearish bias for weekly puts; remain vigilant for a potential squeeze if the price approaches $6.89.
Trade Recommendation
Analysis:
Bearish: 55% likelihood (negative MSS, OFD flows, tariff pressures).
Neutral: 30% likelihood (GEX pinning at $6.50, high VIX choppiness).
Bullish: 15% likelihood (oversold indicators, potential bounce above $6.89).
Action: Recommend a bearish weekly trade below $6.20, targeting $5.80. Purchase $6.50 puts (weekly expiry) at ~$0.25, aiming for $0.50, with a stop at $0.15 if KSS breaks $6.60. Risk $50 (2.5% of a $2,000 account).
Conclusion for Monday: Kohl’s faces a bearish trajectory driven by tariff pressures, negative options flows, and leadership uncertainty. The recommended strategy focuses on a breakdown below $6.20 for weekly bearish trades, targeting $5.80. Elevated VIX and institutional selling add risk—execute with tight stops to manage volatility.
KSS
KSS Kohl's Corporation Options Ahead of EarningsAnalyzing the options chain and the chart patterns of KSS Kohl's Corporation prior to the earnings report this week,
I would consider purchasing the 27.50usd strike price Calls with
an expiration date of 2024-10-18,
for a premium of approximately $3.90.
If these options prove to be profitable prior to the earnings release, I would sell at least half of them.

Kohl's KSS PutBuy Nov-10-23 $22 Strike Puts @ 0.64 Limit to Open
Bounced hard off the $18 zone as retracement. Right now at important resistance with the possibility of dropping from here on out under a bear trend.

Short Kohl'sStock is in a clear downward channel.
Financials aren't looking great.
Based on current market conditions, I predict $16-$18 range by early-mid July.

KSS Kohl's Corporation Options Ahead of EarningsLooking at the KSS Kohl's Corporation options chain ahead of earnings, i would buy the $34 strike price Calls with
2022-11-18 expiration date for about
$0.64 premium.
If the options turn out to be profitable Before the earnings release, i would sell at least 50%.
Looking forward to read your opinion about it.

$KSS is poised for a drop on Earnings!$KSS is at the peak of the regression channel, on a down trend, with two candles rejecting resistance levels. Money momentum is not only shifting out of KSS, but creating divergence on the 4hr time frame. Although our middle band shows us in a bull market momentum, we are on the verge of a complete breakdown. The catalyst will be the ER set to take place in a few days. The estimated EPS is 1.12, but my guess is that KSS hits lower. Regardless, the last four ER and dividends, KSS crashes. Get in early, at the top, and ride the inevitable movement lower!

KSS Inverted H&S Monthly Taking another look at the inverted H&S on this monthly timeframe
This is an addition to my previous analysis for KSS

KSS outlookTrend:
Below 50,100 and 200 EMA
Positive ADX, DI below 20
Trend seems to be weak
Macro impact:
Consumer cyclical stock are not a good buy
Inflation impact on consumer purchase
High interest impacting credit buying
Recommendation:
Wait for price to cross above the resistance @ 47.5 for a reassessment

KSS Indecisive Gaussian ChannelKSS compared to ENJ
Both share the same trait of an Indecisive Gaussian Channel
Following this period of indecision, bulls ultimately win

KSS exclusive negotiations for buyout. Arbitrage opportunity! Kohl's Corp is in exclusive talks with the Franchise Group (FRG) over a possible $8 billion takeover.
Franchise Group to pay $60 a share for Kohl's.
The deal has entered a three-week exclusive discussion window.
From this price level there is a 45.44% arbitrage opportunity if the deal goes through.
Looking forward to read your opinion about it!

KSS Kohls has ER tmrw in pre market .. picked up puts confident it can drop some more.
There is a gap to be filled near 33$ -- in all honesty I think this could be worth $20 a share but who knows.

Kohl's (NYSE: $KSS) Gapping Up Massively Pre-Market 🤯Kohl's Corporation operates as a retail company in the United States. It offers branded apparel, footwear, accessories, beauty, and home products through its stores and website. The company provides its products primarily under the brand names of Apt. 9, Croft & Barrow, Jumping Beans, SO, and Sonoma Goods for Life, as well as Food Network, LC Lauren Conrad, and Simply Vera Vera Wang. As of January 30, 2021, it operated 1,162 Kohl's stores; a website www.Kohls.com; and 12 FILA outlets. Kohl's Corporation was founded in 1962 and is headquartered in Menomonee Falls, Wisconsin.

KSS LongDespite the recent pullback in the US stock market, I remain bullish on KSS. As shown in my analysis, there is a pretty clear bull flag patter formed in Kohl's price movement. The last KSS bull run yielded 250% return so there is significant upside should a breakout occur.
Not finacial advise, simply speculation (:
Good luck!

KSS LONGFundamental Valuation $100. Forever consolidating. Once it breaks out, it will double. Long term play!

10% Gap up over the weekend opportunity.Great scope off one of yesterday's biggest losers. Classic gap-up opportunity. Set sell orders at 75%


KSS - Rounding bottom in making(chart updates) & Business updatePlease see my preview call on KSS link below
ASX:KSS
cdn-api.markitdigital.com
As per Management:
Demand for KSSmaritime data sets is driven by high financial, societal and environmental costs of illegal activitySlide 11For personal use only
Targeting a Geospatial Solutions Market of $549 Billion by tackling Global Economic, Societal and Security Challenges.Deployed by Coast Guards, Navies & Maritime Security operators to identify, monitor coastlines and ultimately to intercept illicit traffic.
Leveraged by insurers, regulators and governments to prosecute ships owners for carrying out illegal activities e.g. illicitly fishing, oil spills, piracy.
selling actionable data vital to:
•Defense and Security Market
•Maritime Intelligence Market
•Insurance Market
•Regulatory Market
Environmental Protection

KSS - Strong online retail salesKohl's raised earnings expectations heading into Tuesday morning from previous quarter. Revenue expectations are $6 billion, March 2020 was $6.54. The options put call ratio is bullish at .30 . There are 2200 $ 57.50 calls sitting in March 19 open interest. Good luck this week!

ASX:KSS KLEOS Space SA - #KSS chart updateKleos Space, a space-powered Radio Frequency Reconnaissance data-as-a-service company, on the successful deployment of its first four Scouting Mission satellites (KSM1). Based in Luxembourg, the company only started three years ag

Index Reconstitutions: Is there a trade?A friend asked a very good trading idea question: Can we profit from additions and subtractions to stock indexes? The addition of NASDAQ:TSLA was a very public event this year and definitely led to a bull run in that stock. What about other stocks that were added and removed this year?

$KSS Swing trading Idea. Support and Resistance zones. As you see that $KSS is on its support zone. I Got rejected few times and I think it is the right time to Buy it to swing trade. Because $KSS had bad earnings but it topped the revenue estimates. Also, in short term support It couldn't break the support.

$KSS Kohls Breaking Down - Bearish Options Activity$KSS Kohls Breaking Down - Bearish Options Activity
After finding some support just below $19 in late June, we've seen a recent choppy mild uptrend. I'll be watching for a break of the lower channel support line in the next week. With a break we should see price action sub-$19 in the near term, leading up to ER early Aug.
Earnings can obviously go either way - but given recent trends in Retail foot traffic, specifically Retail Dept Stores, with strong COVID second waves in highly populated states...I'm bearish.
Bearish Options Activity Today :
1k $20 strike Jan 2022 puts traded today for $720K

