KuCoin Token (KCS) Full Analysis · Past Cycle & PresentKCS is preparing for something really nice, very similar to 2021. In 2021 KuCoin Token grew 5,655%. From 0.500 to 28.77. The entire move from bottom to top lasted 511 days, the bottom being around July 2020, then the market went sideways before the bullish phase. The meat of the move happened in a total of 329 days.
If we take the current cycle bottom to be around August 2024, 511 days gives us a date of 29-December 2025. In 2017 Bitcoin peaked around December. So this is a good date.
I cannot calculate the analog using the 329 days for the "meat of the move" because the bullish breakout is not yet in place. But, late 2025 is what we are aiming for mainly for the next all-time high across the market. We remain open to see this go beyond and reach 2026 but this is something that we will have to wait and see. For now our focus is on what the data provides.
Actually, many pairs, as we saw some weeks ago, are giving out strong signals pointing to Q1-Q2 2026 for their top. Others late 2025. So we have mixed signals and that's normal because the market is really big right now. Not everything can peak at the same time on the same date and not everything hit bottom at the same time.
KuCoin Token is a great example, here the market bottom happened August 2023 and we then see a clear change of dynamics. Ethereum bottomed June 2022 and many altcoins hit bottom just recently, on and on. I keep harping on this just so you know that we cannot generalize anymore. Each project needs to be considered individually if we want accurate results.
KuCoin Token (KCSUSDT) has been bullish growing from its base. A top happened March 2024 and a lower high late January this year, 2025. This does not invalidate the long-term bullish bias and potential.
One major resistance zone remains between $13 and $16, matching the last two peaks just mentioned. We will never wait for "confirmation" here as it would mean a lost opportunity. The market will grow and will break this resistance zone easily and continue higher likely to reach new all-time highs.
So this resistance range, rather than a level that needs to be conquered to confirm a bullish bias, can be taken as weak targets. By weak I mean that we do not sell here. We wait and sell only higher since the market is moving much higher it would be a waste to sell too early. One of the mistakes that can be made in this phase of the market cycle.
Hold strong. Everything looks good. There is huge potential for growth.
$44 is a great target but there is also $69. Which one to choose depends on how the overall market is doing and the date these targets are hit (or missed). For example, if KCS is trading near $40 in just two months, we can aim higher. On the other hand, if KCS is trading around $40 in December, then we can start to consider taking profits.
Of course, this is just a brush-off, you need to do your own research and thorough planning.
Namaste.
Kucoin

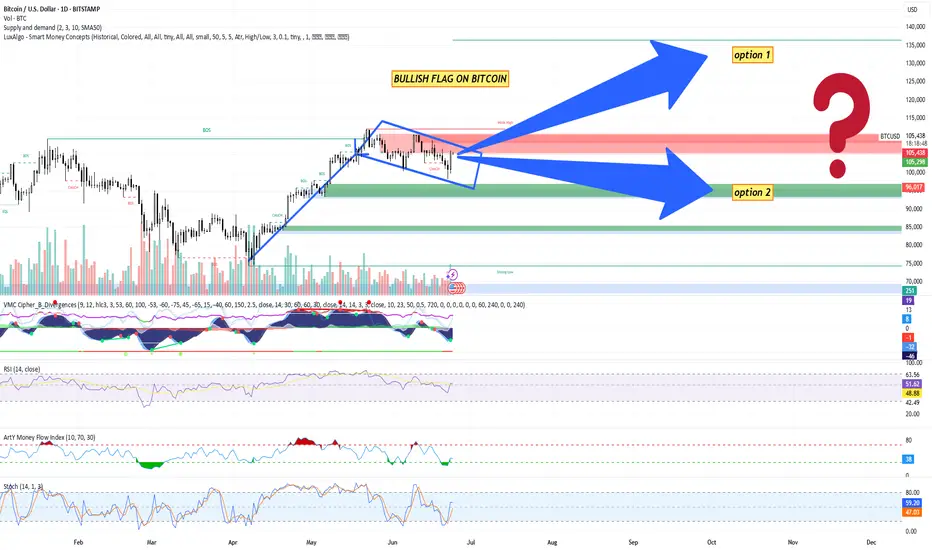
Bitcoin (BTC/USD) Technical Analysis + trade planBitcoin (BTC/USD) Technical Analysis – June 24, 2025
Pattern Identified: Bullish Flag Formation
A clear upward impulse leg followed by a downward-sloping consolidation (flag) indicates a continuation pattern.
The flag is bounded within a descending parallel channel, suggesting a potential breakout to the upside.
Break of Structure (BOS): Multiple BOS signals indicate strong market structure shifts favoring bullish continuation.
Change of Character (CHOCH): Minor CHOCH noted inside the flag, indicating local liquidity grabs but no trend reversal yet.
Key Levels
Current Price: ~$105,126
Flag Resistance: ~$105,291 (watch for breakout)
Major Supply Zone (Resistance): ~$115,000 (red zone)
Demand Zones (Supports):
$96,000 (minor)
$85,000 (medium strength)
$75,000 - $70,000 (strong low / high-confluence area)
Volume Analysis
Declining volume during flag formation supports the bullish flag hypothesis (low-volume pullback).
Anticipate increased volume on breakout for confirmation.
Indicators Summary
1. VMC Cipher B
Green dots signal potential local bottoms.
Wave trends support bullish reversal setup, though momentum still neutral.
2. RSI (14)
Current RSI: ~50.76
Neutral zone; not overbought/oversold – provides room for upside movement.
3. Money Flow Index (Art’y)
Positive inflow recovering, signaling accumulation phase.
4. Stochastic RSI
Blue line crossing above orange around 46. Indicates bullish crossover from the oversold region – early entry signal.
Bitcoin Trading Plan
Trading Bias: Bullish (Contingent on Flag Breakout)
Entry Plan
Breakout Entry: Enter long above $105,300 with confirmation (4H or daily candle close).
Aggressive Entry: Pre-breakout entry inside the flag at ~$104,000–$105,000, anticipating breakout.
Stop Loss
Conservative: Below $96,000 (below key support + 50 SMA).
Aggressive: Below $102,500 (inside flag, tighter stop).
Take Profit Levels
TP1: $110,000 (local high)
TP2: $115,000 (strong resistance zone)
TP3: $123,000–$125,000 (measured move from flag breakout target)
Measured Move Target: Height of the pole ($25K) added to the breakout zone ($105K) = Target zone: $130,000 (theoretical).
Alternative Scenario – Bearish Breakdown
If BTC breaks below $96,000, the bullish structure is invalidated.
In that case:
Look for short entries below $95,500.
Target zone: $85,000 – $75,000.
SL above $98,000.
Risk Management Guidelines
Risk per trade: 1–2% of capital
Use position sizing tools to determine trade size.
Monitor macroeconomic news (Fed, inflation, ETF flows) and crypto market sentiment.
To sum up things:
BTC is consolidating within a textbook bullish flag.
Momentum indicators align with a potential breakout.
Caution warranted until clear breakout occurs – volume confirmation is key.
Keep alert for fakeouts due to low summer volatility.
Energy Web Token—EWT—Triple Recovery: 1000% PP (TAC-S7)All right, here we are.
I appreciate the insistence and support, I like people who never give up. It is a stressful work but I will always comeback and give you what you want. I hope you enjoy the analysis.
Energy Web Token produced a bearish impulse starting May 2024, it ended in April 2025, almost an entire year. This is the last ABC on the chart. The market was sideways and then we have this correction.
Now that the correction is over, we can expect a change of trend.
Current action for EWTUSDT is happening above the August 2024 low. Also above the November 2024 low.
The correction was strong but even stronger where the last two weeks. EWT recovered almost six months of bearish action in just two weeks. This strong bullish momentum gives us a clue of huge rising potential in 2025.
The week before last, 5-May, EWT started trading around $0.687. It went full blown bullish and broke its November 2024 low resistance. The week that followed, 12-May (last week), started red and this resistance was tested as support and holds. Then again, strong bullish momentum and EWTUSDT moved above its August 2024 low. This is a major, major bullish development.
The current weekly session/candle, while pretty young is also good. It started red and wicked lower. The wick did not reach the August 2024 low support but reversed sooner. This is another strongly bullish development and can signal that there will be additional growth this week, next week, and so on.
Trading volume becomes really high in October and November last year and this is also really good because the action is happening above those prices. So the market went through a final full flush, removing all the stop-loss orders and weak hands and is now ready for long-term growth.
The signals here are very, very strong. We don't need to consider the bottom dynamics, the rounded bottom and such because prices are the same now as back in September 2024, which is exceedingly good.
The market dropping for years on end, it seemed like forever, means that there is no need for this Altcoin to move back down again. Don't get me wrong, there can be corrections and retraces based on the short-term, but, when it comes to the bigger picture, we are going up.
I plotted several targets for you on the chart. The main one goes to 1,000%. If you were to calculate this same target coming from the market low, total growth potential amounts to ~2,900%, really strong.
This is it for now. Thanks again for your continued support.
Namaste.

Fartcoin: Is the Smell of a Downtrend in the Air? 📉 Fartcoin: Is the Smell of a Downtrend in the Air? 💨
🚨 Alert: The RSI is holding its nose... and so should we.
After a suspiciously bubbly rally, $FARTCOIN is now showing bearish RSI divergence on the 4H chart — and let’s be honest, it’s starting to stink. 🦨
The recent price action looks like someone tried to pump it... but forgot to ventilate. 💣💨
🧻 Support is about to get wiped.
💩 MACD says momentum is going down the drain.
🚽 Volume drying up like gas after Taco Tuesday.
TA Summary:
RSI Divergence ✅
Rising wedge (aka clogged pipes) ✅
Community still in denial? ✅

CAT - Falling Wedge PatternKUCOIN:CATUSDT (3D CHART) Technical Analysis Update
CAT is currently trading at $0.000008225 and showing overall bullish sentiment
Price has broken out from the falling wedge pattern and we are seeing beginning of the bullish trend. Expecting this trend to continue until the price hits the resistance zone.
Entry level: $0.000008225
Stop Loss Level: $0.000004602
TakeProfit 1: $0.000011536
TakeProfit 2: $0.000011536
TakeProfit 3: $0.000034238
TakeProfit 4: $0.000065098
Max Leverage: 2x
Position Size: 1% of capital
Remember to set your stop loss.
Follow our TradingView account for more technical analysis updates. | Like, share, and comment your thoughts.
Cheers
GreenCrypto


S-P-E-L-LSpell seems VERY VERY interesting. Looking at spell and comparing it to XCN which had absolutely insane gains this past month. Spell could quite possibly do the same. Nearly 2000% to the top. Just like XCN with is waterfall downward with similar pushes near the bottom.
Also volume is picking up heavily.
one more touch to the top line and we could see a quick 80%+ push (practically a meme coin)
We have 3 taps to the resistance line around $0.0018350.
We could see the first push to
$0.0033701
Small retrace and push all the way to $0.006
This is a risky trade, wait for confirmation before entering. Keep in mind it’s quick percentage up but it’s the same for down.
Good luck and have fun with it.

ITS ALL MATHAMATICS…. and psychologyThe mighty mos math. Just keeping an eye on this one, waiting for a confirmation break above the previous high about $0.29 and support on 200ema would be nice. But nearly 100%+ in potential profits, could be a nice wave to ride.
Good luck and have

Crystal clearWe can see a clear double top on XCN this could push down to $0.3455 or a bit lower but it’s also supported by the 200ema.
after that we’re off the the races, I hope you enjoyed this 100% daily gain.
TOSHI, is the best decision to buy when Xcn was topping out hands down.
Good luck and have fun with it.

Just a lookLooking at a meme coin for fun. The main reason is for volatility, the 2nd would be that is coinebases meme and knowing, when people with power say 1 thing in twitter the coin can go flying. All publicity and very high risk.
Has potential to drop nearly 50% or more so be careful if you do enter
Just looking for now while XCN continues to fly
However it could be POPCATs price in the future just keep that in mind
Good luck and have fun with it

Call it cup and handleI’m unsure why they names LCX LCX I’m sure it on google somewhere, but they should have just named the coin cup and handle because it’s clearly multiple cup and handle patterns.
The last push was nearly 350% push. I believe we will see a major use coming soon.
In the 15min. We’ve seen 3 tests to the Tom the the downward trend line once that break LCX will fly $0.289 will be the breaking point more or less.
Good luck and have fun with it.

TradeCityPro | KCS: Navigating KuCoin's Cryptocurrency Waters👋 Welcome to TradeCityPro!
In this analysis, I will be examining the KCS coin, associated with the KuCoin exchange, one of the largest crypto exchanges globally.
📅 Weekly Timeframe
In the weekly timeframe, we are witnessing a very large and long-term range box, where the price has been fluctuating for about 1421 days. The price floor of the box is at 3.905 and the ceiling at 25.505.
🧩 This range box is vast, about 500% wide, but considering the volume and market cap of this coin, it makes sense for it to oscillate in such a broad range over 1400 days.
📈 Currently, the price is moving upwards from the box's floor towards its ceiling, with buying volume gradually increasing along this path and decreasing during corrections, indicating a strong bullish trend.
✨ The main resistance the price is now approaching is at 14.884, which the price has touched once before and is currently attempting to test again after rebounding off the trend line.
📊 If the area at 14.884 is breached, there is no significant resistance until the box's ceiling, and the price could stabilize above 14.884 and move towards 25.505. Increased buying volume and breaking through RSI regions could assist the price in reaching this target.
🔽 Should the trend line break and corrections begin, significant correction areas would be at 5.853 and the main support at 3.905. Such a correction could occur if the broader market and other altcoins also enter a correction phase.
📅 Daily Timeframe
In the daily timeframe, we observe an upward price structure starting from a base of 7.247, with the first leg moving up to 13.749.
🔍 The upward move corrected to the 10.546 area, coinciding with the 0.5 Fibonacci level, and after forming a smaller box visible in lower timeframes, the price is again trending upwards.
✅ The next immediate resistance is at 13.749, which appears accessible, and I expect the price to reach it soon. Breaking this area could see the next resistance at 15.775.
📉 In a correction scenario, if the price creates a lower high than 13.749, a decline to at least 10.546 is plausible. Further correction zones would be the 0.618 Fibonacci level at 8.719. Breaking these levels could bring the next support at 7.247 into play.
⚡️ If the RSI drops below 50, it could confirm the onset of bearish momentum in the market. This is a risky move, and I prefer to wait for more certain triggers.
📝 Final Thoughts
This analysis reflects our opinions and is not financial advice.
Share your thoughts in the comments, and don’t forget to share this analysis with your friends! ❤️

Ondo first entryHere Ondo, it’s just looking like a good set up. It’s over the 200ema and holding support on the daily, as well as just now push over the 50% on RSI. We also see divergence.
Removed all profits from XCN waiting to see it more stable while we play with Ondo for a bit, let’s see what can happen, but it looks good so far.
We could see a push to $1.74 and then $2.15 before seeing what the market prints for us.
Good luck and have fun with it

Multiverse is hidden gem?KUCOIN:AIUSDT
✅Before we start to discuss, I would be glad if you share your opinion on this post's comment section and hit the like button if you enjoyed it.
Thank you.
Possible Targets and explanation idea
➡️When nobody talk about coin its mostly the best time to buy.
➡️Volume trade increases insanely since August 2022
➡️Multiverse Labs, in collaboration with the government of Sharjah, launches its first Metaverse city in UAE
➡️Investors Samsung NEXT, Fenbushi Capital, Huobi Ventures
➡️More than 450 days in accumulation phase, now under -0.27 zone (historically investment zone)
➡️Got perfect rejection in July 2021 at 0.23 level by FIB. This D fib still relevant
➡️Take Profit targets minimal 0.618 level by Fib around 0.14 cents and 1.618 around 0.30 cents. Not sure about 2.618 - 0.45$
Hope you enjoyed the content I created, You can support with your likes and comments this idea so more people can watch!
✅Disclaimer: Please be aware of the risks involved in trading. This idea was made for educational purposes only not for financial Investment Purposes.
* Look at my ideas about interesting altcoins in the related section down below ↓
* For more ideas please hit "Like" and "Follow"!

Staring at the SOLI’m just going to leave this here. Anytime we see a break of a ATH we can expect to see the bull run begin. As we all wait patiently for the 20th we see some movement in the market with Bitcoin dominance in fluctuation. I’ll be holding some SOL to see if we can reach the sun.
We could see over $1000 per SOL just for fun.
Good luck and have fun with it.

Ruthless 500% (top gainer)As called previously I hope you all held though the boring part. But for a 500% return that’s not a bad wait. I have pulled a majority of my profits as I was heavily invested more than I should have been but have reentered for a quick scalp or continuation hold.
If it is not a scalp I’m selling and waiting for the market to retrace
A break below the uptrend (black line) invalidates the immediate continuation but could bounce back with a bear trap
I could see as low as $0.00555
But the potential upside past $0.017
Is nearly $0.05 as it next stop
We see a “W” forming in the 15 min
We see a lot of support in the 15min and 4hr
And in the daily it’s very bullish obviously but we know crypto I can reap 500% in a quick retrace so keep an eye out.
Good luck and have fun with it.

SILLY/USDT 1DKey Observations:*1. *Current Price:
- 0.01668 USDT
- Daily Change: +0.00028 (1.69%)
- Volume: 2.41 million
2. Resistance Levels:
- Monthly Resistance: 0.03571 USDT
- Weekly Resistances: 0.02816 USDT, 0.01700 USDT
3. Fibonacci Retracement Levels:
- 0.236: 0.01307 USDT
- 0.382: 0.01745 USDT
- 0.618: 0.02182 USDT
- 0.786: 0.01937 USDT
- 1.0: 0.02182 USDT
- 1.618: 0.02890 USDT
- 2.618: 0.04035 USDT
- 3.618: 0.05180 USDT
- 4.236: 0.05888 USDT
4. Moving Averages:
- MACD: Shows a blue line (MACD line) and a yellow line (signal line), indicating potential bullish or bearish trends based on crossovers.
5. Annotations:
- Price Targets:
- 0.01882 USDT: Gain of 111.62%
- 0.01151 USDT: Gain of 68.28%
Analysis:*1. *Support and Resistance:
- The price is currently at 0.01668 USDT, approaching the weekly resistance of 0.01700 USDT.
- If it breaks this level, the next targets are 0.02182 USDT (0.618 Fibonacci) and higher levels like 0.02816 USDT (weekly resistance).
2. Fibonacci Levels:
- These retracement levels suggest potential support and resistance zones where the price might reverse or consolidate.
3. Volume Analysis:
- The trading volume is significant, indicating active market participation, which can confirm price movements.
4. MACD Indicator:
- The MACD can help identify potential bullish or bearish trends. A crossover of the MACD line above the signal line could indicate a buy signal, while the opposite crossover could suggest a sell signal.
Strategy:- Entry Point: Around the current price, if the price breaks and closes above the 0.01700 USDT resistance level.
- Stop-Loss: Just below the 0.236 Fibonacci level at 0.01307 USDT to manage risk.
- Profit Targets: Aim for the Fibonacci extension levels at 0.02890 USDT, 0.04035 USDT, and 0.05180 USDT for potential gains.
DYOR
NFA
TYOR
DCA

BustinBtrst has declined over the years but has recently moved over the 200ma when this holds we could see the next push possibly to $0.88, with a continuation up to $1.20 before resistance or just tear through resistance and push up past around $2. This is on a 15 minute chart
We see in the past when it breaks $1.38 it has little resistance until $2.63. Take all information with a grain of salt.
Good luck and have fun with it.

XCN for the skyHere we have XCN. I previously got trapped in XCN due to coinbase randomly deciding to shut down right when I was going to exit the trade. Since then we have retraced.
We have touched 0.0033 3 times now and can see a ATH of $0.10.
We are at the bottom just before an important break.
The next stop past this could be, 0.017 which is roughly a 555% gain. From there we could see some resistance then 0.053
As we can see when we zoom out…with fib retracement it is about $0.053–$0.066.
2 things to say about this coin.
1– it’s JP Morgan’s coin
2– it has X in the ticker like other well know financial use coins (XRP, XLM)
Good luck and have fun with it.

XYO fanXYO has been very successful these past years with massive quick gains and stability. I have entered XYO again as the new news is they are partnering with Tesla which means if Elon Musk approves of it, well that’s enough reason to go all in on this.
Good luck and have fun with it

Xyo fo showXYO is taking off, we can expect some stronger resistance around $0.01324– $0.01400
This coin has shown almost no resistance in the past in this area. It’s typical to have a sell off but I believe we could still see another 45% gain coming in quick.
Good luck and have fun with it.

KuCoin (KCS) Kucoin price today is $8 with a 24 hour trading volume of 25 million dollar. KCS price is up 18% in the last 24 hours
KCS is the native token of KuCoin, which was launched back in 2017 as a profit sharing token that allows traders to draw value from the exchange. It was issued as an ERC-20 token running on the Ethereum network and was supported by most Ethereum wallets. The total supply of KCS was set at 200 million, and there is a planned buyback and burn until just 100 million KCS remain. Sooner or later, as the KuCoin decentralized trading solution goes live, KCS will be the native asset of KuCoin's decentralized financial services as well as the governance token of the KuCoin community in the future.
6 is huge buy zone for KCS and every time we reach this level we face huge demand and support from bulls
8, 9 and 10 are next targets for kcs

KuCoin Is Looking For A Bullish ContinuationKuCoin with ticker KCSUSD is nicely rising as expected after we spotted a completed higher degree wave IV correction and bullish breakout for a higher degree wave V a year ago.
As you can see today, KCSUSD is still holding up well and it may actually formed a lower degree bullish setup formation with subwaves 1 and 2, which can now extend the rally within subwave 3 of a five-wave bullish cycle within that higher degree wave V.
KCS is KuCoin's native token, launched in 2017 as a profit-sharing token. Initially issued as an ERC-20 token on Ethereum, its total supply was 200 million, with plans to reduce it to 100 million through buybacks and burns. KCS will eventually become the native asset for KuCoin's decentralized financial services and governance. KuCoin aims to empower KCS, making it a key product within its ecosystem. As KuCoin develops its DEX and KuChain, KCS will serve as the primary token for these decentralized products.
