Kucoin


KCS - Two Possible Scenarios!Hello TradingView Family / Fellow Traders. This is Richard, as known as theSignalyst.
WEEKLY: Left Chart
KCS broke below our 10.0 support zone so we have got two possible scenarios now.
H1: Right Chart
Scenario 1: For the bulls to take over again and reclaim the support, we need a break above the 10.0 and last major high in gray. In this case a movement till the upper resistance 15.0 would be expected.
Scenario 2: Meanwhile, until the bulls take over as per scenario 1, the bears would be in control trading inside the red wedge pattern and a movement lower will be expected till the next support 5.0 - 7.0
Which scenario do you think is more probable and why?
Always follow your trading plan regarding entry, risk management, and trade management.
Good luck!
All Strategies Are Good; If Managed Properly!
~Rich


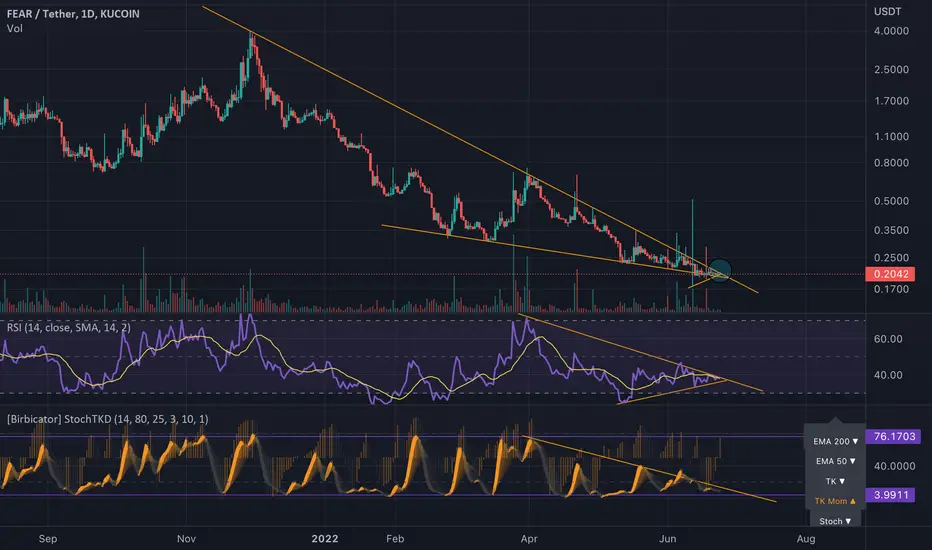
$FEAR on Kucoin looks to Break out of Adam & Eve pattern??Closely monitoring this adam eve pattern with one of my favorite coins on kucoin. Its a horror gaming metaverse play that already has an establish fan base for their games. Keeping a close eye on it as it looks to break out of Adam Eve pattern at the same time it aims to break out of SToch Rsi and normal RSI levels . A healthy or flat bitcoin can give this coin the momentum it needs to break out. With a circulating supply of 6 million the breakout could be violent. #ThisNotFA

KCSUSDT 1D Entry points for medium-term tradesThe Kcsusdt price of continues to move along the falling channel and in its lower part.
The other day, the KCS price fell to a critical level of around 8 dollars, where it was the last time a year ago. And now buyers are trying to turn the Kcsusd price upwards together with the crypto market.
It is also valid to assume that a global trend reversal of the Kucoin token price movement can occur through "the Head and Shoulders pattern"
And also we found a fractal of the price movement, which fits into the possible movement of the KCS price with an H&S pattern.
Everyone has to decide individually where to buy KCS here.
From the bottom of the descending channel to the top +100% price movement.
The next safe long entry point is if and when the KCS price fix above $12. But the possible upward movement of the Kcsusdt price from there will be only +45%
_______________________________
Since 2016 , we have been analyzing and trading the cryptocurrency market.
We transform our knowledge, trading moods and experience into ideas. Each "like under the idea" boosts the level of our happiness by 0.05%. If we help you to be calmer and richer — help us to be happier :)

KCS/USD - Massive Bullish Divergence. Can KuCoin PUMP? 🚀With KuCoin making another local low, the three-day timeframe is now giving a massive bullish divergence on the RSI.
This is significant and it may take some time to materialize. As long as the price manages to hold at this support level then a relief rally becomes quite likely in the near term.
The market appears to have found a local bottom around these levels and with a bit of buy volume, it can reverse this downtrend, at least in the next few weeks.
On the daily timeframe, the chart is bullish but lacks sufficient volume right now.
The bias is mildly bullish right here, but it is contingent on the support holding.
Time to be patient, but taking a long position on dips may be the better trade right now compared to shorting.
Like and follow if you liked this idea!

KCSusdt is in a sensitive area!KCSusdt is in a sensitive area!
On the other hand, the floor has 2 channels that can be supported
On the other hand, negative news leads to weekly support
What do you think will happen?

DOT symmetrical triangle#DOT/USDT
$DOT inside symmetrical triangle, possible to drop to lower line.
then decide which way to break!
I'm goin to buy more at $7, what about you?

BItcoin pullback and then bull move?Btc has been falling like a rock however, it looks like it has been supported at the 18k mark could there be a fib pullback or it becomes a reversal back to the short side. On the 4 hr 200 ema the price it touching the ema could for sure be major resistance. KUCOIN:BTCUSDT

KCSUSDT on the Channel's bottom. If broken = Selloff to 1W MA200The KuCoin token (KCSUSDT), is having a very bearish 7 day stretch that has brought the price exactly on the Higher Lows (bottom) trend-line of the 14 month Channel Up. All this bearish sentiment is coming amid general negativity in the crypto market and despite KuCoin's efforts to support the token with great promotions such as the latest BNB-7D\BNB-14D fixed with an APR of up to 8% (more info on their news webpage).
This is the last chance for the coin to recover the losses and make a market bottom, otherwise a weekly close below the Higher Lows trend-line can open the way to an even worse sell-off with a first target the 1W MA200 (red trend-line). As you see that aligns perfectly with the -0.236 Fibonacci extension.
On the bullish case, the 1D CCI Lower Highs formation has given us in the past 3 occurrences, a rebound to at least the 1D MA50 (blue trend-line), which is currently at 13.600. By the time of this potential contact, the 1D MA50 will most likely be on the 0.236 Fibonacci retracement level. A signal for a long-term bullish reversal can only be given by a break above the 1D MA200 (orange trend-line).
--------------------------------------------------------------------------------------------------------
Please like, subscribe and share your ideas and charts with the community!
--------------------------------------------------------------------------------------------------------

KCS/USDTesting/tracking elliot wave theory. Please do not trade off idea without S/L. Not financial advice.
RR: 8
Possible upside: 315%
Possible downside: 39% - 69%. It can go to the lowest green support line and that would be 69% drop (highly unlikely).

KCS/BTC - The KCS magic vs Bitcoin may be fading! 😢KuCoin managed to outperform Bitcoin for the first six months of 2022. However, things appear to have changed in the past two months with KCS failing to make higher highs vs Bitcoin.
Now, the price is found at critical support at 5k satoshi and if it fails to hold here then KCS could fall back to 4k-3k satoshi.
The indicators are bearish and the USD chart is not looking better either. See below.
At best, KCS could consolidate above 3k satoshi and hopefully the market together with BTC will find a bottom that will allow KCS to recover again.
The bias remains bearish on this price action and I will revert back to this chart once we have a clean break from this current level.
Like and follow if you liked my idea!

KCS/USD - KuCoin Token about to re-test CRITICAL SUPPORT! 😮KuCoin Token failed to bounce in any significant way in the second half of June and was sharply rejected by the resistance at $11.
Now, the price is going back to the critical support at $9. If it fails to hold here then the path will open up for a much lower valuation. Maybe even $6.
Unfortunately for KCS, the market remains bearish and with BTC under 20k, hopium is in short supply.
The indicators on the daily timeframe and above are still bearish. There is some hope that the RSI could make a bullish divergence in the future which could materialize later on. However, it is too early now to hope for that.
All eyes are on the $9 level. Can buyers save KCS here again?
The bias remains bearish due to the current price action.
Like and follow if you liked my idea!

KCSUSDT 1D Buys and sells zones for Kucoin TokenLast week, we wrote that the purchase KCS at $10 for long-term trade can be considered a profitable purchase.
The trade is relevant, and the possible reversal pattern "Head and Shoulders" is also relevant and possible.
If you missed last week's idea, today fate gives you another chance to buy KCSUSDT
Purchase zone $9.05-9.55
Short-term take profit - $12.55
Medium-term take profit -$17.40
Global and critical stop for all positions below $8.24
_______________________________
Since 2016 , we have been analyzing and trading the cryptocurrency market.
We transform our knowledge, trading moods and experience into ideas. Each "like under the idea" boosts the level of our happiness by 0.05%. If we help you to be calmer and richer - help us to be happier :)

How To Analyze Any Chart From Scratch - Episode 8Hello TradingView Family / Fellow Traders. This is Richard, as known as theSignalyst.
Today we are going to go over a practical example on KCS, but you can apply the same logic / strategy on any instrument.
Feel free to ask questions or request any instrument for the next episode.
You can find the previous episodes below "Related Ideas"
Always follow your trading plan regarding entry, risk management, and trade management.
Good luck!
All Strategies Are Good; If Managed Properly!
~Rich

KCS - My Detailed Trading Plan in a video!Hello TradingView Family / Fellow Traders. This is Richard, as known as theSignalyst.
Here is a detailed update top-down analysis for NZDCAD .
Which scenario do you think is more likely to happen? and Why?
Always follow your trading plan regarding entry, risk management, and trade management.
Good Luck!.
All Strategies Are Good; If Managed Properly!
~Rich

⌼ I AM ADAUSDT @ 0.324 KUCOIN:ADAUSDT
I am ADAUSDT @ TP 0.324
I have located the energy waves created by the emotional/volumetric footprint.
Previously unseen is now seen as the cyan atom like structure within the chart space ⌼
Profit was taken @ 0.324USDT.
Enjoy this destine desire from source.
tradegod

KCSUDT Sideways into a potential MA100 bullish break-outThe KuCoin Token (KCSUDT) has been trading above its 4H MA50 (blue trend-line0 since June 23 in a sideways consolidation. The 1D MACD has just formed a Bullish Cross and the last time this set of conditions emerged on KCS was during May 16-19, when the coin was again consolidating with the 4H MA50 supporting.
What happened after that sideways trade was a test and subsequent break-out of the 4H MA100 (green trend-line). That delivered a rebound to the 4H MA200 (orange trend-line) in 4 days. At the moment the 4H MA100 is at 11.440 and declining fast and the 4H MA200 at 13.920. There is a Lower Highs trend-line involved however, acting as a Resistance so our strategy is to buy when the 4H MA100 breaks but only target the Lower Highs trend-line instead of the 4H MA200 and then re-evaluate on a 1D level.
--------------------------------------------------------------------------------------------------------
Please like, subscribe and share your ideas and charts with the community!
--------------------------------------------------------------------------------------------------------

$KCS Bearish ContinuationLots of charts looking the same, KCS here with the 3rd round of former support tests and getting tight.
Not bad R:R but weekends can be weird.

Fantom Adam & Eve Bottom Pattern Can Lead to 140%+We continue and this time Fantom (FTMBTC) is the altcoin pair at hand.
There are always so many signals and indicators to look at...
But the strongest of all signals is the market cycle.
If you can learn the market cycles you can know when everything will recover/bounce/move up.
Keeping track of the market cycles, once on a bullish wave we can also figure out all the peaks/highs and tops.
For FTMBTC, we have a strong RSI after a new low.
Prices trading above EMA21 and EMA10...
This is another chart setup with LOW RISK and HIGH POTENTIAL REWARDS.
You can find additional details (targets and stop-loss levels) on the chart.
Namaste.

KuCoin can make strong impulse soonToday I want talk with you about KCS/USDT chart.
Price is trading in triangle now and I'm not sure where KCS can go next.
I think that price can make uptrend or downtrend.
It's depend which side of tringle KuCoin will break.
If it will be upside and resistance level 11.0$, price can go higher to resistance zone .
Or KCS can break downside of triangle and price will fall down to support level 9.20$.
So, I'm waiting for this scenario.
This is my opinion, I really hope this will be useful for you.
Be ready and take care your money. Have a great profit !

Every TA Persons Favorite Chart $FearAll altcoins are affected by Bitcoins gravity but we've seen many exceptions to this rule especially during crypto/stock market rallies. $Fear is a Gaming/metaverse company specializing in making successful horror games and now has brought their already popular games to the blockchain. This coin is listed on Kucoin and I have been dollar-cost averaging in as I believe it is massively undervalued. You can check out their website if you care to learn more its Fear.io