XBI biotech ETF EW count optionsSharing an intermediate view of the EW count options for XBI.
The short-term bullish range is $97-$98.
The short-term bearish target ranges are $89 - $88.50 and $87.
The bearish count, in red, drops the price to $81ish as first support. If, $81 range does not hold, $72 is the C wave target.
In the meantime, I anticipate a lot of chop in the range from $86 - $100 in the next couple months until a rate cut occurs.
As speculation of a rate cut increases, the price can begin to gravitate toward $104. When an interest rate cut is proposed, XBI will blast to the $140s but I am reserved about this outcome at this time.
LABD

XBI the ETF for Biotechnology LONGBiotechnology is expected to be a hot subsector this year as healthcare recovered further from
the COVID pandemic anything from startups to big pharma- from vaccines to new drugs for
diabetes, liver disease and obesity. This is shown on a weekly chart to show the long term trend
with XBI pivoting to bullish back in early November. I add long positions when I see a dip
on the 3-4hr chart. My targets are the fib retracement expectation at 116 confluent with
the first upper VWAP band line and then the 135-138 zone underneath the second upper line
shown in thin red on the chart. This ETF smooths out the volatility characteristic of some
of the smaller biotechnology firms making it safer albeit with lesser rewards expectations.
Positions in NVAX and MRNA are having a good start to the week and will reflect in a small
way in this ETF which has broad constituent stocks within its portfolio.

LABU a 3X leveraged ETF of biotechnology stocks LONGLABU on a 240-minute chart has been in a trend up gaining 100% in 3 months. Both the fast and
slow ( green and red) are above the 50 level. Biotechnology is expected to be a hot subsector
this year as healthcare recovered further from the COVID pandemic anything from startups to
big pharma- from vaccines to new drugs for diabetes, liver disease and obesity. Leveraged
funds have time decay from the leveraging and management fees and are meant to be for
short-term trading. Nonetheless, 100% in 3 months is an excellent return. I add to my position
when I see a pullback on the 15-30 minute chart. If price rises more than 2% in a day I may
take 1-2 shares off the position to realize some profit and recycle ( compound) into the next
buy. According to those that follow sectors, LABU should outperform this year.

LABU / LABD Ratio Anchored VWAP over /under LABU LONGOn the weekly chart a LABU / LABD ratio is plotted with anchored VWAP bands and a volume
profile overlaid. I wanted to analyze this to affirm the highest of prospects for the
Biotechnology sector for 2024. LABU is triple leveraged Up while LABD is the inverse Down.
A good unleveraged biotech ETF is XBI. The chart shows LABU in a VWAP band and breakout
through the hohg volume area and then over it beginning early November. Unusually high
relative volume and volatility ramped up about the same time.
I readily conclude that LABU is the buy right now with the ratio rising. It is a low beat ETF
with good range due to the leveraging and high forecasts for 2024. I will make buys on
LABU at regular intervals on a 60-120 minute time frame looking for the weekly lows.
I will set an alert for a falling ratio on the 3H to daily chart to assess should the supertrend
fade. I believe that this will be a safe low risk swing long trade.

Strong bullish case for $LABDCan see this at $15.00 given that is where most shares are currently held, according to FRVP; this means there will likely be little downwards price pressure until then. Biotech is generally bearish outside of select, short-lived bull runs - this, in my opinion, creates an opportunity for sentiment arbitrage and is my reasoning for the trade (short term/long term outlooks are both bearish)

LABU / LABD Medical Leveraged ETFs Flip Strategy.LABU is shown here on a 2H time frame. I am holding 500 shares having bought November 14th
on golden cross of fast and slow hull moving averages. The unrealized gain is 50%.
Here, I determine that I should en bloc or in increments close the position.
First, on the dual time RSI indicator of Chris Moody, the RSI is now over 60 and approaching
65. Price pivoted when RSI was in this range as shown by the red down arrows on the chart.
A fibonacci analysis is that the LABU downtrend of early September to late October has now
retraced in the range of 50% with the mid levels shown on the chart from the drawing tool.
Because of these two considerations, I believe that I should bank the 50% profit in less than
3 weeks and perhaps take a position in the inverse ETF LABD. I will do this on a 15 minute
time frame, take off one fifth of the position daily at the high of day as determined by an
alert for the faster Hull Moving Average doing down instead of upsloping. At the same time
on the LABD 15 minute chart I will buy a corresponding position at the low of day again using
an alert. By the end of the five days, the LABU position will be closed and the profits
redeployed into LABD. When LABD retraces 505 of its downtrend and RSI rises above 60, I will
consider fading the position and retaking a position in LABU. thus toggling positions in the
inverse ETFs as analysis and indicators dictate.

FULC fades after a big move for a SHORT tradeFULC a biotechnology firm with a mixed earnings report early in the month just
printed a big move and then stalled at the NY lunch - hour and faded. Will the fade
continue or will there be an upward continuation? The 15 -minute chart seems to suggest
a downtrend:
1, The volume profile shows heavy trading at the top. This could be short sellers and
late-coming long trades. Once a trend down is underway, the short sellers will begin to
take profits buying to cover while the long trades will sell at a loss. Probably at this level
there will be more longs exiting than shorts until a substantial fall dictates the latter
to buy to cover.
2. New short sellers will pile into the trade pushing price down while few new long traders
will participate in accelerating the move down.
3. The relative strength on that indicator falling confirms the trend as does the Average Positive
Directional Index falling with the combined falling as well.
4. The mass index indicator documents a reversal
Accordingly,
I will take a short trade and assist the trend down in my own little way. I may take a trade of
100 shares and then sell a call option. In the meanwhile, I will take a put option striking
$5.00 for September 15th. I expect a decent realized profit from these trades in this
at least currently high volatility biotechnology penny stock.

LABD 3X BEAR BIOTECH LONG DAYTRADEAs shown on the 15-minute chart, LABD is bouncing between stardard deviations of the VWAP in a 6% price range
fluctuation day to day. At the upper end it is reversing at the POC of the volume profile confluent with one
standard deviation above VWAP while at the bottom it is bouncing from the bottom of the lower high volume area
of the profile and two standard deviations below VWAP. I see this as an opportunity for a 6% upside long day
trade especially if the general market is uptrending after the weekend. Alternatively, a 5 DTE call option
with a strike of $ 15.50 or $16.00 looking for a 30-40% return on the premium over the upcoming week. ( The
zero lag MACD confirms the buy signal.)

(WARNNG) Extreme Bear Volume in $XLF, Shorting next hourly LH- QQQ double topped with Tuesday top, had a 15m bull flag during consolidation with no red flags until mid morning.
- XLF increasing bear volume with zero bounce and very notable big money exiting. Fear creeped into the market
- VIX up 20%
- QQQ went from lead bull to bear when all sectors starting to drop at the same time after XLFs huge drop. dragging SPY down too.
- lots of negative news and sentiment regarding banks and how much they dropped SI down over 80% in just two days.
- Bears now in total control.
- huge drop in XBI & IWM as well.
SMH might go from lead bull to lead bear tomorrow
looking to short the next hourly or 15m lower high pretty much almost on any bounce if we get a bullish reaction to data tomorrow during PM will be shorting that bounce.

Fast trade on LABDLabd reached a support area where there will be a strong buyer
Entry is done by putting a stoploss as shown in the graph .
For further more wait for our updates .

LABU 3X LEVERAGED BIOTECH ETF on support for LONGAMEX:LABU
LABU a 3x leveraged EFT in the biotechnology sector has diverse holdings.
My thesis is that biotechnology and healthcare are relatively unhinged from the broader general market.
On this 15 minute chart, consolidation at support is seen in July, Price then rapidly rose
into a triple top in mid-August followed by a descent into a double bottom at the support level.
This is a leveraged ETF with good volatility which can be traded.
The volume profile of July through mid-August sets a POC as 8,65. This is the best support level
within the zone. In the same fashion the volume profile of mid-August through the present sets
a POC at 12.45 which is the bottom of the resistance zone. The spread is approximately 40% upside
over perhaps two weeks of the expectant uptrend.
The zero-lag SMA / EMA oscillator is showing green at its most recent print with an uptrend noted.
I will take a trade in a call option with a strike 20 % higher than current price
given the potential immediate upside of 40%. I will select an expiration in 4-6 weeks and hope
for a 100-200% return.

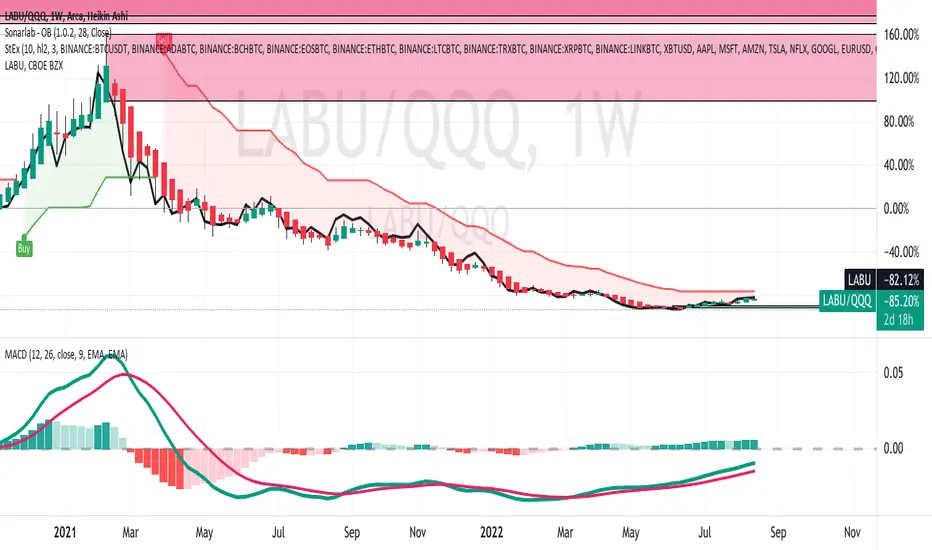
LABU 3X Leverage BIOTECHNOLOGY a potential Recession playLABU a 3x leveraged EFT in the biotechnology sector has diverse holdings.
My thesis is that biotechnology and healthcare are relatively unhinged from the broader general market.
Here I chart LABU / QQQ ratio to determine relative strength.
On this weekly chart, the ratio and so relative strength are at more than a 52 week low.
The MACD indicator shows the MACD and signal line ascending and below the histogram.;
moreover the MACD in green is running above the signal line. This favors a trend reversal.
All in all, this seems to be a setup for a long swing trade or investment.
I will take a trade in a call option with a strike 50% higher than current price
as I see a potential for a large percentage gain for LABU. The diversity of the ETF
will serve to mitigate some of the risk. A stop loss will be 1% below current price
with an expectation of more than a 50 % return in the remainder of the calendar
year but far more in the case of the call option scenario
LABU LEVERAGED BIOTECH ETFThis Daily Chart plots LABU to LABD ratios over time. LABU is 3X Leveraged ETF of a variety of biotechnology
stocks while LABD is the inverse.
By plotting the ratio of LABU to LABD, what can be found is the precise end of the LABU downtrend (LABD uptrend)
and reversal into LABU uptrend ( LABD downtrend).
In this case, the reversal occurred about June 17th while the SPY reached its current market bottom.
This type of analysis can be used to make trade decisions regarding a contrasting pair of stocks or forex pairs.
It makes the decisions more informed. IF going down to a 1H or 4H timeframe, the accuracies will be higher
and the pivots more frequent also making potential profits higher.
This can be used with other ETF inverses such as
GUST /DRIP
BOIL /KOLD
JDST / JNUG
YINN / YANG
SOXL/ SOXS
FAZ / FAS
TMF /TMV
By setting up all of these also with alerts such as ratio decreasing or ration increasing
a trader with very little time to trade and diversify and automate his/her trading
resulting in risk stratification and mitigation and economy of time.

looking for 83.50 then short off of D legtook a small position on labu at 7.77, looking for 83.50 then short off of D leg

looking for pop, then retest to 73.50 areaseeing bearish pattern set up, a pop then retrace near the .236 fib line

It's a small trendline break but I'll take it.I took a small CALL option position this morning. Got the 5/13 $8 calls for $1.20. Now $1.65.
BIIB and PFE both report in the morning.

MRNA Looks ready to roll overMRNA has gone on an absurd run, and the technical setup looks ripe to the short side. It's all over WSB, looks ripe for a slaughter. There is upside risk with a possible FDA approval so trades have to factor that in.

Is LABD looking to break out of this ascending triangle?As far as popular reversal patterns go, ascending triangles are no bottom of the barrel. Although I still am a new trader, I have been committed to the market for just over 1 year. With that said I have been watching LABD/LABU in proximity of market trends. When the overall market is bullish I trade LABU with success. When Market is bearish I trade LABD with success. My number #1 rule is follow the trend. That is why I am bullish on LABD. With the market making irrational highs despite COVID fears of a new variant, I have noted that LABD make this ascending triangle formation. So far it has held true. This could just be paranoid shizophrenia (I have an MD by the way), but my inner voice has been telling me to watch biotech for the market fall. My theory is that if and when the market falls LABD is going to get pumped like there is no tomorrow, similar to the VIX. But the good part is it is not as volatile as fear is. I can trade its inverse and watch the volume in both directions. So far it seems even, so i don't think any one knows what is coming next, except for maybe the FED. Unless LABU turns around I think LABD can go up to 40, if in fact there is a bubble burst on the horizon.


1 Month Vix vs LABD correlationInteresting correlation between VIX and LABD over the last month. Really goes to show how volatility/sentiment is driving LABD right now and not any view of fundamentals. There has also been a tight correlation between LABD and TXN too, but only over the last month. 1Y TXN LABD is not closely correlated.
VIX
LABD
TXN


Biotech Looking a Little Sick: LABDAnother descending triangle has appeared in LABD. My numerous other finds have yielded decent results but we have yet to see a turn in the market indicating a new direction. The play itself might be worth a couple of percent gain but please trade safely. The downturn near the end of Friday's session is forecasting a likely poor Monday opening in addition to the negative news that continues to come out of the ECB and New York.

LABD: Bearish on biotech tomorrowI don't know how other people are feeling but there are a lot of bearish declining wedges appearing in the leveraged ETFs and elsewhere. Makes me wonder what news we're getting between now and then.
