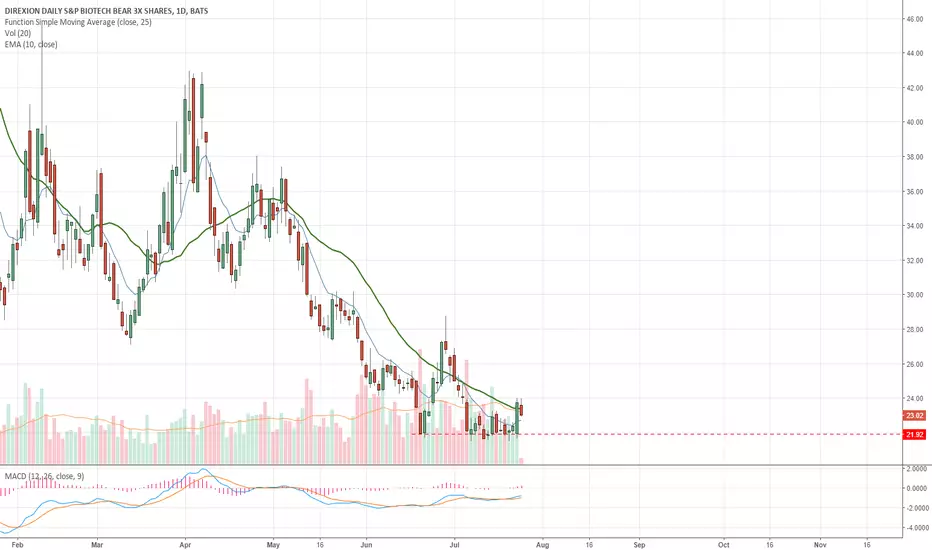
LABD Long IdeaI bought LABD last week based on this chart. The price closed above the supporting moving averages. The general markets are extended past 34 days in this cycle. Usually a market top happens about now.
LABD


Technicals versus PolicitiansWIth Warren and Bernie fading a bit, Bio/health have jumped nicely. Too much too soon IMO, at the minimum a short term pull back is coming. I am hoping we can become more range bound in the technicals and return to cyclical trading between 78 and 87, this type of cycle is great IBB and XBI, however getting caught when it breaks down can hurt! I use XBI has my measure, but trade LABU and LABD.
**Short XBI via LABD

Build Positions in BiotechAs the month of October begins and broader markets sold off, Biotech sectors are still negative/ flat for the year. Market headlines from high prescription drug prices and lawsuits regarding the opioid epidemic have plagued some of the IBB's largest holdings; which have held biotech ETF's down while the S&P reached all time highs.
Fast-Track Synopsis:
Biotech is a known high volatility trading environment;
More Investors will become "Traders" with new $0 trading fee platforms from Schwab and TD Ameritrade.
Once people begin trading stocks, they will find that high volatility is how the "big" day-trade/ swing trading money is made.
New Med-tech and Biotechnology therapies (i.e. gene therapies, NASH/ NAFLD) are ripening and getting closer to approval.
There are currently over 240 biotechnology companies with Gene therapy IP
IP has been growing with RMAT and Breakthrough Designations due to unmet need of new novel treatments;
As Biotech rolls into year-end, lower interest rates will propel company growth models which I believe will help drive buy outs.
LABU Technical Analysis:
Bullish Harmonic Gartley pattern and close to 52-week low.
1-year Gartley pattern should move LABU stock price back up to around $40 level (resistance) where we will be watching for a potential breakout
CCI measured "oversold" with the end of September pullback, CCI-slope is now trending higher,
This last pullback also measures a double bottom (data points are from Christmas 2018 and present)
Intra-day bullish RSI divergence, Daily RSI trending higher;
the MS Signal recently flipped green as of 10/1/2019 and is still indicating a nice swing opportunity to come.
Three-drives pattern bouncing toward resistance concurrent with double bottom and Gartley pattern.
Look for the support level (marked (x)) to hold.
See conclusion here !
Please like and follow so we can continue finding awesome charts/ trades. For more pre-researched Biotech trade-ideas click and visit us at MS Money Moves . Thanks in advance everyone!!
Disclosure: I do not own LABU, I may buy or sell within the next 48 hours. This is not a recommendation to buy or sell. Please do your homework before investing.

Long-term bearish divergence in Biotech The NASDAQ Biotech has just broken the monthly support line with bearish divergence. Bear marketing coming soon?

Cala #VolatilityWatchAfter a recent selloff in mid June 2019, Stock price went from from $6.70 down to $3.44. Cala looks to have established a double bottom. New strong uptrend suggests it has potentially capitulated from the selloff making these levels very attractive for any investors who are sidelined and looking for a good technical/ fundamental trade in biotech. Cala looks to be in the midst of a new uptrend.
June 2019 selloff marked double bottom for CALA.
This looks to be very attractive from risk vs reward standpoint (Assuming markets stay strong, I see approximately $0.40 downside vs $1.50 upside).
Extrapolating previous price patterns (shown in chart) Cala looks to be in the midst of 2nd wave (Bullish corrective wave).
the projection is based off previous price patterns where CALA retraced approximately .618 and extended above the 1.618 Fibonacci extension level.
trend indicators also signaling uptrend in play (see chart).
Tip # 9: Stop losses are a good way to get you out of a trade that you don't want to be in. But remember, they only work during market hours.
Please Like and Follow so I can continue giving trade ideas and build up my reputation. Thank you in advance =)
Have a Instagram or Twitter? follow me @VolatilityWatch
Disclosure : I do not own a position in Cala. I may buy/ sell within the next 72 hours. This is not a note to buy or sell. Please do your own homework before investing.

Sangamo's: Doom or Gloom ScenarioRecent data release may have changed SGMO's future outlook. Sangamo's long-term chart suggests a potential pullback to $4 is a possibility, but that was before a recent data release by the company for updated Phase 1/2 Results for SB-525 . This is an investigational Hemophilia-A gene therapy that showed sustained increased Factor VIII Levels with no reported bleeding events and no factor usage for as long as 24 weeks of follow-up.
Some traders do not believe in technical analysis, that's fine, but I think you may want to re-consider and hear me out on this one. Most didn't believe in Sangamo either (aren't I right Sangamo fan's)!!
What Does The Chart Say?
The long-term pattern (from day of IPO) suggests that if Sangamo Therapeutics stock price continued its trend, it was a possibility that pattern would repeat therefore potentially pulling back to December 2016 lows of around $3.67. Although this may still be a possibility, Sangamo caught wind in its sails on good data release recently, re-igniting investor optimism. I remain cautiously optimistic with Sangamo, so I went ahead and put together a short-term game plan just in case. Take a look at short list of what I will be watching for while I wait for further confirmation of long-term trend indication.
When making previous highs, Sangamo's stock price has entailed devastating 5-wave corrections, however:
The daily chart suggests that instead of a 5-wave correction that could potentially take SGMO to sub $4, SGMO's chart details an AB=BC corrective wave that could potentially mark the low of the long-term selloff.
AB=BC corrective waves are equal in length/or magnitude and on a Bullish correction would bounce off the 0.786 retracement level.
SGMO had a sharp bounce off this level in Feb 2019 and closed the day right above the 0.786 retracement zone. This is a very important level of support to close upon.
If this did not happen I would be on the other side of the trade waiting for a wash, down to $4. But from my experience there still may be fighting chance.
Short-term (from Feb 2019 to now) SGMO continues to make higher lows, this is #Bullish.
Although SGMO looks to have failed to break current resistance in the chart above,volume/optimism packed enough punch to test $11.85 which is a 1.618 Fibonacci extension (normal extensions range from 1.272 or 1.414).. . #Bullish
May not be exactly what a Long-term investor's of SGMO would want to hear, but a pullback around .618-.786 retracement (shown in green-zone on chart) would be a nice place to add for swing-trade up to earnings.
Previous earnings have brought 10-20% run-ups, but be careful to not get trapped in an earnings selloff.
If SGMO continues to make higher-lows, this could be a potential range to be looking for a swing position.
Breakout of this zone could mean big $$
Fall below blue trend line could mean devastation
my stop-loss will be set below blue trend-line.
Again, it's a long way down to $4 if trend continues to follow its Long-term pattern. Previous trends have issued 5-wave correction, peak to trough, the current pattern details an AB=BC harmonic pattern (outlined in #RED) please press play and zoom out to see what I am referring to.
Tip # 5 : A trend line in mathmatical terms means the line of best fit. When using them, make sure they touch as many points as possible on the chart.
Please like and follow so I can continue doing technical analysis. Thank you in advance everyone =)
@VolatilityWatch
@scooby_snack
Disclosure: I do not own SGMO. I may buy/sell within the next 72 hours. This is not a note to buy or sell. Please do your homework before investing.
//----------------------------------------------------------------------------------------------------------------------------------------------------------------------------
Check out my some of my current trades.


I am a permabear... but how can you ignore all this confluence? Target 10,000. I can't believe I said that... but there is just too much confluence to ignore this possibility. However, a breakdown from this wedge will likely eliminate this play. Either we hit it fast in 2019, or this long is off the table. Let me know your thoughts.

Biotech symmetry. Let the market settle down, and then go long.The biotech sector is really interesting when you dive down into the symmetry of the last few cycles. Early 2000s-2008 and 2016-2018 are mini rallies within the bigger wedge. If this pattern is to continues, you can look for entry around the end of 2020 when we bump up against the larger support line (around $3600), and expect to hit the resistance of the larger wedge ($10,000). There is also a lot of confluence around the $7500 mark so we could fall back to that after hitting 10k. This would repeat this pattern for the third time.
Near term, I have some shorts in this sector because I think many of this small biotech companies have been operating at negative cash flow with a ton of free credit. I don't expect massive gains on these shorts, but I will certainly be going long towards the end of 2020.

to low 50'slong term chart uptrend. massive move for biotech in this bull cycle. inflated drug prices... swan $IBB $LABD


Short idea (Biotech ETF)Short here on the next 3 day new low. XBI weekly losing all momentum with dying volume $LABD $IBB

Short set up XBI- DBiotech past week has been in a downtrend. Short below yesterday's close. $IBB $XBI $LABD

LABD IdeaWith the markets possibly topping, the inverse of LABU, which is LABD may be a good long here. Looks to have strong support at $22. MACD divergence.
Biotechs getting readyXBI getting ready for a move after some super healthy consolidation, bulls need to see a break of the 101.05/101.06 double top and a break of RSI resistance for room to the upside. Earnings from some larger names will like help XBI to pick a direction soon. LABD and LABU will be on my radar this week. I will be much more likely to play a break if overall market moves in the same direction.

13% down on XBI, 40% upside on LabDNice double top, retrace to the bottom of the channel, potential full breakdown depending on the broader market over the next month.

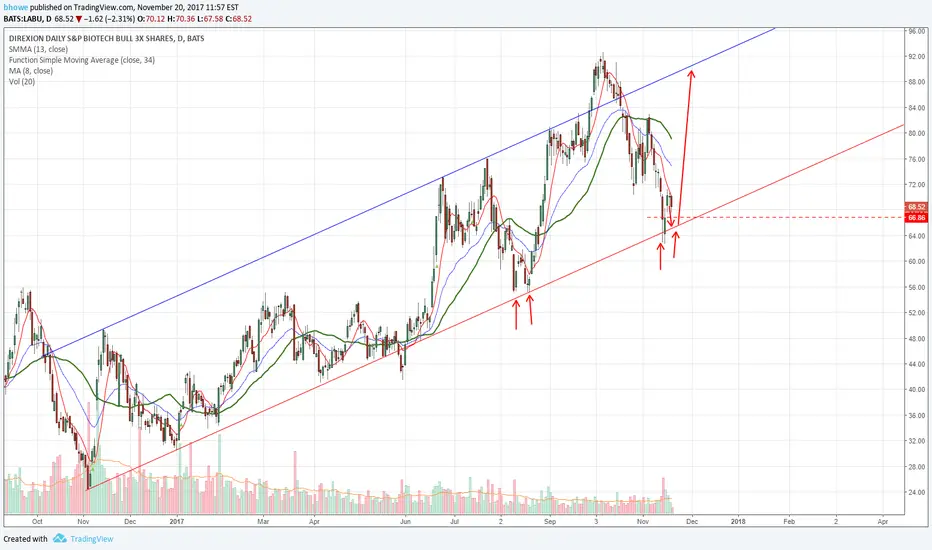
LABU Long IdeaLooking to go long with LABU. Looking for a retest of the lower trend line. Previous times it bounced and retrested the break. BUY limit order at $65.50
LABD trade ideaLABD, the 3x inverse ETF of LABU is showing a break above previous highs on the weekly chart. I expect continues move higher. General markets are consolidating which should add to further pressure on the IBB. 1st target $6.

XBI / LABD / LABUwho has the insight?
Option A: crazy breakout to the upside
Option B: Big ol' Bear! (growl)

