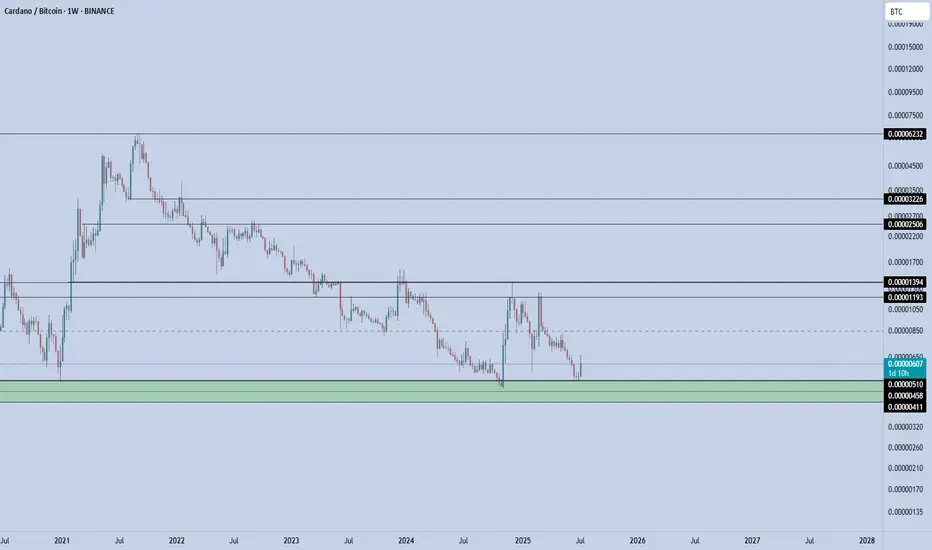
ADABTC – Long-Term Demand ZoneThe green box is a multi-year demand zone, tested multiple times, with each test producing strong upward moves.
Current structure aligns with previous cycle bottoms.
If BTC dominance stalls or rotates, alt/BTC pairs like ADA/BTC could rotate sharply upward.
📌 Risk Management:
A weekly close below 0.0000450 invalidates the long thesis. Until then, the risk-reward favors accumulation.
If market conditions align, ADA could be preparing for one of its classic ratio expansions — especially if Bitcoin cools and capital rotates into majors.
Largecap
Lunar Signal Generator My Lunar signal generator uses a sinusoidal wave which is matched in frequency to the sinusoidal motion of the moon. The indicator is based on research which suggests that there are increased returns on days surrounding the new moon and decreased returns on days surrounding the full moon.
The indicator represents a two week trading strategy and prints buy signals before the new moon, and prints sell signals on the full moon. If used as a trading strategy the 5 & 10 year win rates are 70%, profitability is dependent on your choice of stoploss. I suggest a 9% Stoploss however this is discretionary. Can be used on any financial product, however it works best on large cap equities.
Just place on any chart, and trade according to the buy and sell signals
Check out my website, (press the little globe below my profile description)
Please reach out for any questions/concerns

BAJAJHFL Short term IdeaBAJAJHFL is at breakout level. It has tested the TL 2 times and now the swing broke.
People who are looking for low risk and High reward can look this.
This is not a call, please analyze and consult your financial advisor before investing.
Entry can be at Spot(115.29) or safe players can enter above 120, your Risk will be 110(Stoploss) and Targets T1 - 145, T2 - 180.
Estimated Holding time - 3 to 6 months, maximum - 1 year

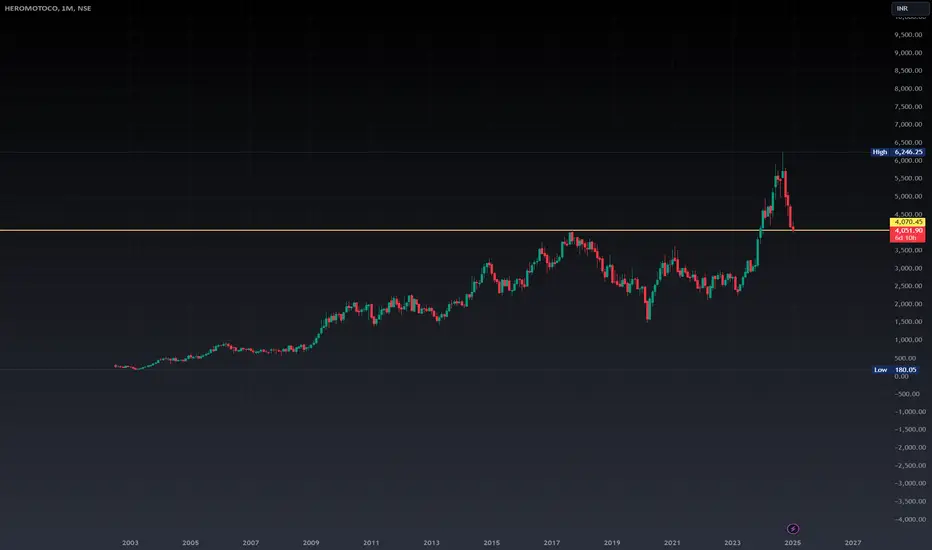
HEROMOTOCO on supportHeromotoco is on crucial support of previous ATH, will it bounce back, time will tell.
current market condition is not good, be very cautious while taking any trade.
so where is the new top?most analysts i pay attention to dont try to put an exact top on moves like this. the reason being trend based indications dont work when there is a one sided trade. going above 6000 seems likely, but where it will go in the interim isnt clear. it doesnt need to be clear for maintanance on remaining long with the trend.
ive marked out the support and resistance in bull or bear terms based on POC.

NEO: Potential Breakout from Falling Wedge?Hey everyone!
If you're enjoying this analysis, a thumbs up and follow would be greatly appreciated!
NEO looks good in daily time frame. It is forming a falling wedge like structure and trying to breaks out from it. It also holds a support (Green box) very well so far. After a confirmed daily candle close expecting a good 70-80% move to the upside from here.
Entry range:- $10-$11
Targets:- $12.3/$14.4/$16.8/$19.5
SL:- $8.30
What are your thoughts on NEO's current price action? Do you see a bullish pattern? Share your analysis in the comments below!

Navigating Frothy US Equities with S&P SpreadsNavigating frothiness in US equities requires both caution and tact. With the S&P 500 nearing its all-time high amid flashing recession signals, investors must be vigilant with volatility during upcoming earnings season, driven by outsized expectations.
This paper explores the persistent recession indicators and forces at play during upcoming earnings. The paper posits a spread trade using CME’s Micro E-Mini futures (Long S&P 500 and Short Russell 2000) to maintain upside potential with reduced downside risk.
RECESSION RISKS PERSIST AS RATES REMAIN HIGH
On Friday, the PCE Price Index (Fed’s preferred gauge) showed inflation cooling to 2.6% in May, in line with expectations. Price pressures are slowly abating.
Numbers aside, the broader economic landscape presents a complex picture.
Signals from the job market point to unemployment claimants at a record high for the past two and a half year with job openings shrinking drastically. Personal earnings were higher than anticipated in May (0.5% vs 0.4%), but spending was below expectations. Consumers are being more cautious. Mint Finance covered these nuances in a previous paper .
Housing is flashing weakness as new housing starts hit a four-year low in May. Soaring prices and steep mortgage rates are weighing on demand.
The Fed’s policy path remains unconfirmed. However, consensus point to a rate cut as early as September. Even if that happens, rates are expected to decline gradually.
Source: CME FedWatch
Despite risk of recession, the S&P 500 has had an exemplary showing this year, trading near their all-time high. YTD performance of 15% in 2024 has been far higher than the 74-year average of 4%.
Yet, the performance has been increasingly top-heavy. Nvidia, Apple, and the rest of the tech titans have contributed much of the gains in the broad S&P500 index as it is market cap weighted. The index is heavily reliant on and sensitive to the performance of these mega-caps.
The equal-weighted S&P 500 index is up only by 4% in sharp contrast. The spread between the S&P 500 and its equal-weighted counterpart is near its highest point since 2008. The spreads between the S&P 500 and both the Russell 2000 and S&P Midcap indexes have reached multi-decade highs.
Outperformance was re-affirmed after the recent earnings season. Mega-caps crushed EPS and revenue expectations and reported phenomenal guidance while other stocks, especially utility and energy sector reported revenue and EPS figures below estimates according to FactSet report .
Rallies in mega-cap stocks are being driven by idiosyncratic tailwinds, such as advancements in AI. Meanwhile, slowing consumer spending in the US is raising concerns for the broader market.
RISK OF SHARP CORRECTION WARRANTS SPREAD POSITION
According to FactSet , Q1 earnings season was positive. Only 19% of firms reported earnings below expectations. Actual average EPS YoY growth for the index was 5.9% (above 3.4% expected as of March 31).
Frothiness in the equity market is palpable. Consistent outperformance by mega caps is baked into investor expectations. Strong earnings are already factored into prices, as evidenced by the S&P 500's P/E ratio of 28.38x (far higher than the 10-year average of 20x translating to a 42% above average earnings expectations). Average P/E ratio in the best performing tech sector is even higher at 37.47x.
Even minor shortfalls in guidance or revenue/earnings can lead to significant corrections in such a climate. The FactSet reports that 31.8% of firms which beat earnings EPS estimates by up to +5% saw average price decline of -0.9%.
Source: FactSet Research
In fact, overall, positive earnings only drove a 0.9% increase in price (1% 10Y historical average) while a negative earnings report led to 2.8% drop (-2.3% 10Y historical average).
Source: FactSet Research
Market frothiness elevates risk of a sharp price correction in single names during Q2 earnings. Analysts are concerned as expectations for Q2 EPS YoY growth have been lowered from 9% on 31/March to 8.8% as of 22/June.
Despite this, mega-caps remain in solid position. Robust demand for AI, buoyant advertising revenue, globalized revenue streams, and substantial market dominance have positioned them to continue growing at a disproportionate rate.
In case the upcoming Q2 results pan out similarly to Q1 in favor of mega-caps, the S&P 500 will continue to outperform the broader market indices.
HYPOTHETICAL TRADE SETUP
The S&P 500, with its high concentration of mega-cap stocks, is likely to perform better than broader market indices in the coming earnings season. However, recession signals are also flashing.
The S&P 500 does not perform well during recessions. Over the last four recessions, it has declined an average of -14%. Comparatively the spread between S&P 500/Russell 2000 spread has increased 1.7%.
The S&P 500/Russell 2000 spread has also outperformed during the six-month preceding recessions.
Given the S&P 500-Russell 2000 spread's historical outperformance during recessions, a spread position presents less downside risk compared to an outright long position in the S&P 500.
This strategy also maintains a bullish outlook on the top-heavy S&P 500's potential to outperform in the upcoming season.
Moreover, the spread trade preserves the upside potential in the ongoing rally, as its performance has been comparable to an outright long position in the S&P 500.
A view on the spread between the S&P 500 and Russell 2000 can be expressed using CME Micro E-Mini Equity futures. At 1/10th the size of the full-size E-mini futures, the Micro contracts allow for smaller trades with more granular exposure.
A long position in the Micro E-Mini S&P 500 futures expiring in September (MESU2024) can be offset by a short position on 2 x Micro E-Mini Russell 2000 futures expiring in September (M2KU24). This position is highly margin-efficient as CME offers margin credit for this spread.
Hypothetical trade set up in summary requires entry at 2.69x, with a target at 2.78x coupled with stop loss at 2.6x.
The simulated payoffs are described below.
MARKET DATA
CME Real-time Market Data helps identify trading set-ups and express market views better. If you have futures in your trading portfolio, you can check out on CME Group data plans available that suit your trading needs www.tradingview.com
DISCLAIMER
This case study is for educational purposes only and does not constitute investment recommendations or advice. Nor are they used to promote any specific products, or services.
Trading or investment ideas cited here are for illustration only, as an integral part of a case study to demonstrate the fundamental concepts in risk management or trading under the market scenarios being discussed. Please read the FULL DISCLAIMER the link to which is provided in our profile description.

Utilities setting up?The daily chart on XLU provides rationale to keep a place on our watchlist. Recently it made a golden cross and seems to have broken free of a downdraft in price. Now it looks like the RSI could be searching for overbought.
One option is a momentum trade targeting the $71+ price. Personally I'd like to see it hit overbought, then that a position of it pulls back down around the 50 & 200 day MSAs. Looks like with some patience there could be 15% out there depending on how things develop.

VALUE in SBI CardsSince the past three years, business profits have been on a rise, whereas the stock has delivered negative returns. The stock is considerably cooled off and a new rally is awaited.
I encourage you to study these developments and keep in mind that any decision involving financial consideration will be completely at your own risk. This post, like all others on my channel are for educational purposes only.

LONG WIPRO We have a Range breakout in #Wipro after making a successful base around 350-380 levels, stock has managed to break the range upwards.Imp Levels marked in Black. Wipro can go towards new highs, Buy on dips until 370-377 Levels held!
R1- 490
R2- 540
R3- 615
S1- 444
S2- 377
S3- 355.

JSW steel - long"JSW Steel has broken its all-time high today, ranging between 816 and 770. If you can get this share at any price within this range, you can consider investing in it, as it is expected to provide excellent returns in the near future."


AXIS Bank LongAlthough it depends on the overall market condition still it is a good long-term trade as it is on a weekly frame.
The dotted green line is your target.
Put the stop loss according to your risk management.

Profits Over Patients: The Morally Complex Realm of Big PharmaThis strategy dissects the dual nature of big pharmaceutical firms like Johnson & Johnson, Pfizer, Moderna, and Merck & Co viewed through base Fibonacci Extension Clustering. Despite big pharma's significant contributions to healthcare, these firms have benefited from questionable practices, including price manipulation and exploiting addictions . Price manipulation is a notorious strategy where companies arbitrarily hike drug prices, often without any significant improvements in their efficacy.
"Big Pharma" has faced backlash for allegedly contributing to the opioid crisis . By aggressively marketing highly addictive pain medications , they may have exacerbated a public health catastrophe, leading to thousands of deaths annually.
Such practices illuminate the immoral landscape of the pharmaceutical industry. While these firms play a vital role in global healthcare, their business tactics often prioritize profits over patients, demanding a closer scrutiny of this sector's ethics.
1. Johnson & Johnson (JNJ): Around $440 billion
2. Pfizer Inc. (PFE): Around $240 billion
3. Moderna Inc. (MRNA): Around $110 billion
4. Merck & Co., Inc. (MRK): Around $200 billion
TOTAL = 1 Trillion

heres how im slicing iti used this swing strategy to develop hourly levels where i think resistance or support could occur. im long or short breakouts ir breakdowns of rangebound action here, and im long or short higher lows or lower highs forming around those levels as well in trending conditions.

5 ways to play the current macro environmentWhy We Rallied
It's been a strong few months for the S&P 500, which is up about 13% from the October lows. There were five reasons for the rally:
1) P/E ratios got attractive, especially for small-to-mid caps.
2) Inflation peaked, which historically has sometimes marked the bottom for stocks.
3) Global liquidity turned upward. Every major bond market was pricing a central bank pivot, and the big central banks (particularly Japan and China) added about $1 trillion to their balance sheets.
4) Economic data remained surprisingly strong, which raised hopes of a "soft landing."
5) Possibly there was a bit of forced buying due to a "short squeeze."
Why the Rally Is Probably Over
However, I believe we've now reached an inflection point where these tailwinds will turn into headwinds.
1) The S&P 500 and Russell 2000 P/E ratios are once again looking high (although S&P 400 and S&P 600 still look cheap). (See this report from Ed Yardeni.)
2) Inflation is no longer surprising to the downside. The last couple prints have been exactly in line with forecasts, and leading indicators of inflation have been creeping back up. See, for instance, this chart of service sector wages, this chart of copper prices, and this Goldman Sachs forecast of crude oil prices. This is partly because of the global liquidity boost and continued deficit spending , and it's partly because of China ending its Covid-zero policy and reopening its economy. (China is the largest importer of crude and the second-largest importer of liquified natural gas in the world.)
3) With inflation set to stay high, liquidity has tightened a lot. The market is no longer pricing a Fed pivot , and analysts suggest the central bank liquidity boost may be over . Stocks have now gotten significantly higher than liquidity measures would predict , which suggests they may need to come down a little.
4) Economic data are deteriorating. Leading indicators have been pointing toward recession for months , but consumer savings and a glut of job openings have helped delay it. We're definitely starting to see weakness, though. Credit card debt has soared to an all-time high , we're seeing more late payments , and the housing market is cooling off fast , with inventories of unused construction materials piling up . We've seen "soft landing" hype before: in 2000 and 2007 , just before those recessions hit. Unless the Fed pivots immediately, it's probably not "different this time."
5) The short squeeze is over for large cap tech, with most of the shorts already forced out.
Five Ideas for How to Reposition
How to trade a coming recession?
1) The obvious trade is long bonds, short stocks. Bond market valuations are very attractive relative to stocks, with bond yields only a little below the S&P 500's earnings yield, and bond markets having perhaps gotten too hawkish relative to policy rates. Given the historical correlation between 10-year yields and S&P 500 valuations, the gap that has opened between them may imply an opportunity for a statistical arb. Either stock valuations should drop or bond yields should rise. Historically, in a recessionary environment, the bond market has tended to recover first, and the stock market second. So now would be the time to long those bonds.
However , it should be noted that this recessionary environment is an unusual one in a lot of ways. Stocks have already sold off a lot, and valuations are pretty mixed. Bonds should perform well if we get a deflationary recession that allows to Fed to lower rates, but a stagflationary recession might force the Fed to keep rates high even as the economy stumbles. Thus, it may be worth getting a little more specific with our trade. Here are some other ideas:
2) Long investment-grade bonds, short high-yield bonds. If recession is coming, then high-yield spreads are probably way too low . It's possible that high-yield bond rates will rise even as investment-grade, Treasury, and policy rates fall.
3) Long high-quality small- and mid-caps, short low-quality large caps. In my opinion, large cap tech is still way too crowded. I wouldn't want to short Microsoft right now, given the success of Bing AI. But I'd be willing to take a swing at Amazon, Apple, and Netflix as long as I could balance the risk by longing some cheap, quality smalls and mids on the other side. In my opinion, the size factor is ripe for disruption. If you'd asked me two years ago, I would have said that AI would most benefit large cap tech. Now I think it will most benefit smalls. What changed between now and then is that AI went from being the exclusive domain of big companies to being publicly available at shockingly low cost. This happened way faster than I ever would have guessed, and you better believe that small, agile companies will capitalize on the opportunities provided by access to AI!
4) Long cash to buy the dip on energy stocks. Energy historically has struggled in a recession, so it's quite likely that energy stocks will see some downside soon. However, the current free cash flow yield on energy stocks is quite high , and the sector trades at 10x forward P/E . Meanwhile, investment in the sector is still much too low . I believe there will be a decade-long structural bull market in energy due to constrained supply, but that there will probably be some recessionary pain first. Meanwhile, money market funds offer a really high return on cash. My Fidelity money market is giving me almost 4%. Ain't nothing wrong with just collecting that money market rate and waiting for energy stocks to dip for the buy and hold.
With retail investor inflows at an all-time high , I believe the current market environment offers a good opportunity for savvy bears to execute some well-constructed long-short trades. If you look at how the smart money is positioned, it's pretty much the opposite of retail positioning here. There will be a time to get bullish on US large cap stocks, but we probably need to see some weakening of coincident economic indicators like employment first. (Stocks tend to do best when unemployment rates are high .) Remember, market positioning beats market timing, but ideally you could do a little of both!
Thanks for reading, and please share your ideas in the comments below!

we have the fed data compared to potential earnings dataa good beat tommorow means up, and a fair or poorer review means down.
im expecting goog, amzn, aapl, fb and indices to follow suit.

very large cap manufacturer going into freefalli really cant stress enough how much you ahould dump this if you havent. entering heavy set short territory. stock is still a long term buy and hold, but this requires lower prices first.

nothing stopping melt downbroader market etf favorite SPY should lead the market lower soon. credit flow in favor of selling equities.
largest cap AAPL should accep melt down
youtu.be
this is a really good video on the topin from yesterday afternoon tue. 20th dec. 2022

APOLLOHOSP is ready to breakout triangle patternNSE:APOLLOHOSP large cap health care stock is touching triangle's resistance for 5th time in this year.
With positive earnings and bull market, this breakout can sustain if pharma sector picks momentum again.
Key note : Always follow proper risk management to avoid losing capital from false breakouts as this is common.
Caution : This is a knowledge sharing analysis, not a call.
Profits are not made from following ideas, but by following Risk Management .

Maruti BreakoutThe stock has broken out and retested, therefore may undergo a reversal rally. Trade is supported by Supports Nearby.
Risk Reward Ratio - 2:1
SL is placed below the support zone & the lower trendline. The target is placed near resistance.

P&G BreakoutThe stock has broken out and retested, therefore may undergo a reversal rally. Trade is supported by Supports Nearby.
Risk Reward Ratio - 2:1
SL is placed below the support zone & the lower trendline. The target is placed near resistance.

Gillette India BreakoutThe stock has broken out and retested, therefore may undergo a reversal rally. Trade is supported by Supports Nearby.
Risk Reward Ratio - 2:1
SL is placed below the support zone & the lower trendline. The target is placed near resistance.
